
|
|||||
|
 | |
| |
| |
| |
| |
| |
|
Gene: ERF |
Gene summary for ERF |
| Gene information | Species | Human | Gene symbol | ERF | Gene ID | 2077 |
| Gene name | ETS2 repressor factor | |
| Gene Alias | CHYTS | |
| Cytomap | 19q13.2 | |
| Gene Type | protein-coding | GO ID | GO:0000122 | UniProtAcc | P50548 |
Top |
Malignant transformation analysis |
| Identification of the aberrant gene expression in precancerous and cancerous lesions by comparing the gene expression of stem-like cells in diseased tissues with normal stem cells |
| Entrez ID | Symbol | Replicates | Species | Organ | Tissue | Adj P-value | Log2FC | Malignancy |
| 2077 | ERF | S43 | Human | Liver | Cirrhotic | 2.30e-06 | -2.22e-01 | -0.0187 |
| 2077 | ERF | HCC1_Meng | Human | Liver | HCC | 3.60e-53 | -5.39e-02 | 0.0246 |
| 2077 | ERF | HCC2_Meng | Human | Liver | HCC | 3.91e-11 | -8.56e-02 | 0.0107 |
| 2077 | ERF | cirrhotic1 | Human | Liver | Cirrhotic | 7.07e-06 | 1.07e-01 | 0.0202 |
| 2077 | ERF | cirrhotic2 | Human | Liver | Cirrhotic | 6.28e-04 | 3.11e-02 | 0.0201 |
| 2077 | ERF | Pt13.b | Human | Liver | HCC | 7.22e-05 | -1.65e-02 | 0.0251 |
| 2077 | ERF | S014 | Human | Liver | HCC | 3.88e-15 | 7.21e-01 | 0.2254 |
| 2077 | ERF | S015 | Human | Liver | HCC | 1.11e-15 | 8.51e-01 | 0.2375 |
| 2077 | ERF | S016 | Human | Liver | HCC | 9.70e-12 | 5.70e-01 | 0.2243 |
| 2077 | ERF | S028 | Human | Liver | HCC | 1.06e-04 | 3.79e-01 | 0.2503 |
| 2077 | ERF | C04 | Human | Oral cavity | OSCC | 1.93e-08 | 8.16e-01 | 0.2633 |
| 2077 | ERF | C21 | Human | Oral cavity | OSCC | 8.56e-06 | 3.56e-01 | 0.2678 |
| 2077 | ERF | C30 | Human | Oral cavity | OSCC | 1.09e-32 | 1.48e+00 | 0.3055 |
| 2077 | ERF | C38 | Human | Oral cavity | OSCC | 5.00e-06 | 1.14e+00 | 0.172 |
| 2077 | ERF | C43 | Human | Oral cavity | OSCC | 3.70e-18 | 4.47e-01 | 0.1704 |
| 2077 | ERF | C51 | Human | Oral cavity | OSCC | 5.34e-04 | 4.64e-01 | 0.2674 |
| 2077 | ERF | C06 | Human | Oral cavity | OSCC | 2.38e-04 | 1.28e+00 | 0.2699 |
| 2077 | ERF | C08 | Human | Oral cavity | OSCC | 3.61e-25 | 6.17e-01 | 0.1919 |
| 2077 | ERF | C09 | Human | Oral cavity | OSCC | 2.70e-24 | 1.18e+00 | 0.1431 |
| 2077 | ERF | LN46 | Human | Oral cavity | OSCC | 9.67e-06 | 6.54e-01 | 0.1666 |
| Page: 1 2 3 |
| Tissue | Expression Dynamics | Abbreviation |
| Liver | 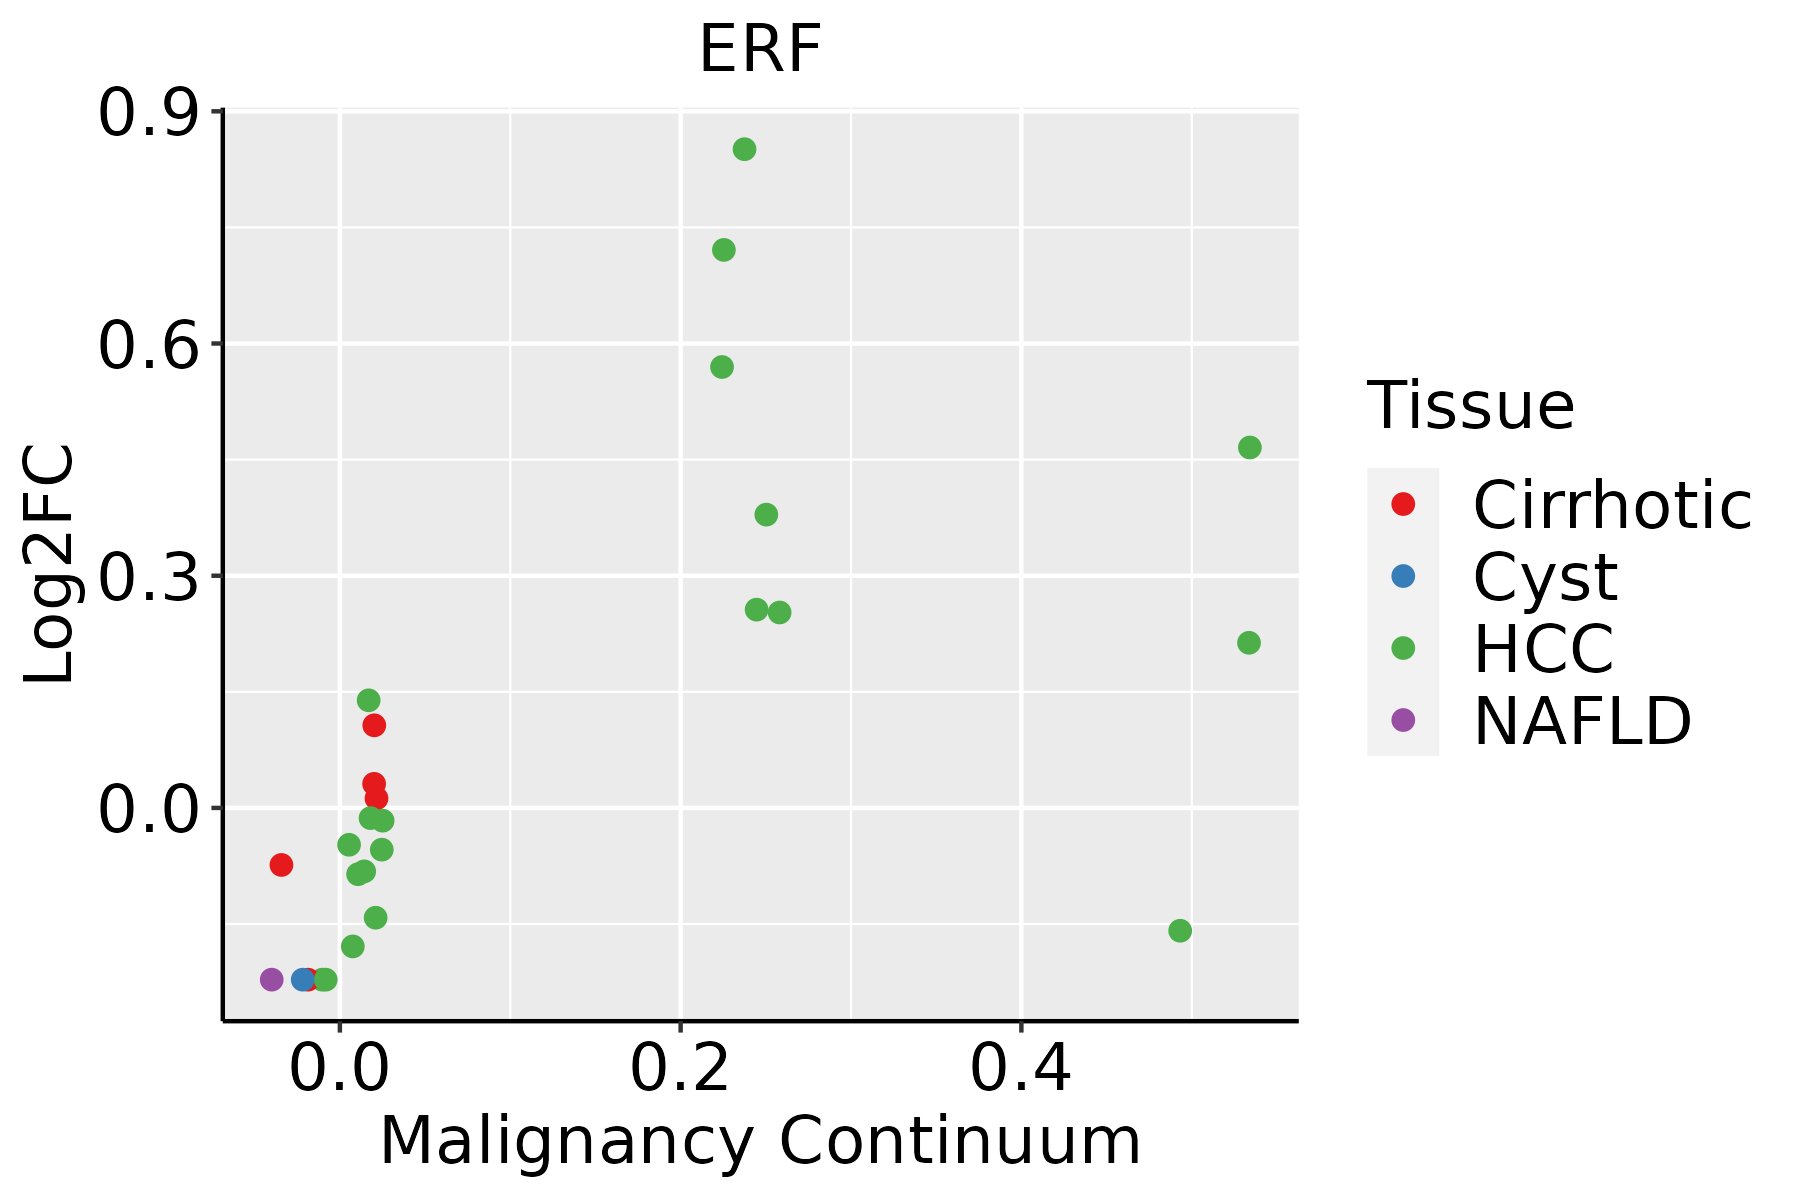 | HCC: Hepatocellular carcinoma |
| NAFLD: Non-alcoholic fatty liver disease | ||
| Oral Cavity |  | EOLP: Erosive Oral lichen planus |
| LP: leukoplakia | ||
| NEOLP: Non-erosive oral lichen planus | ||
| OSCC: Oral squamous cell carcinoma | ||
| Skin | 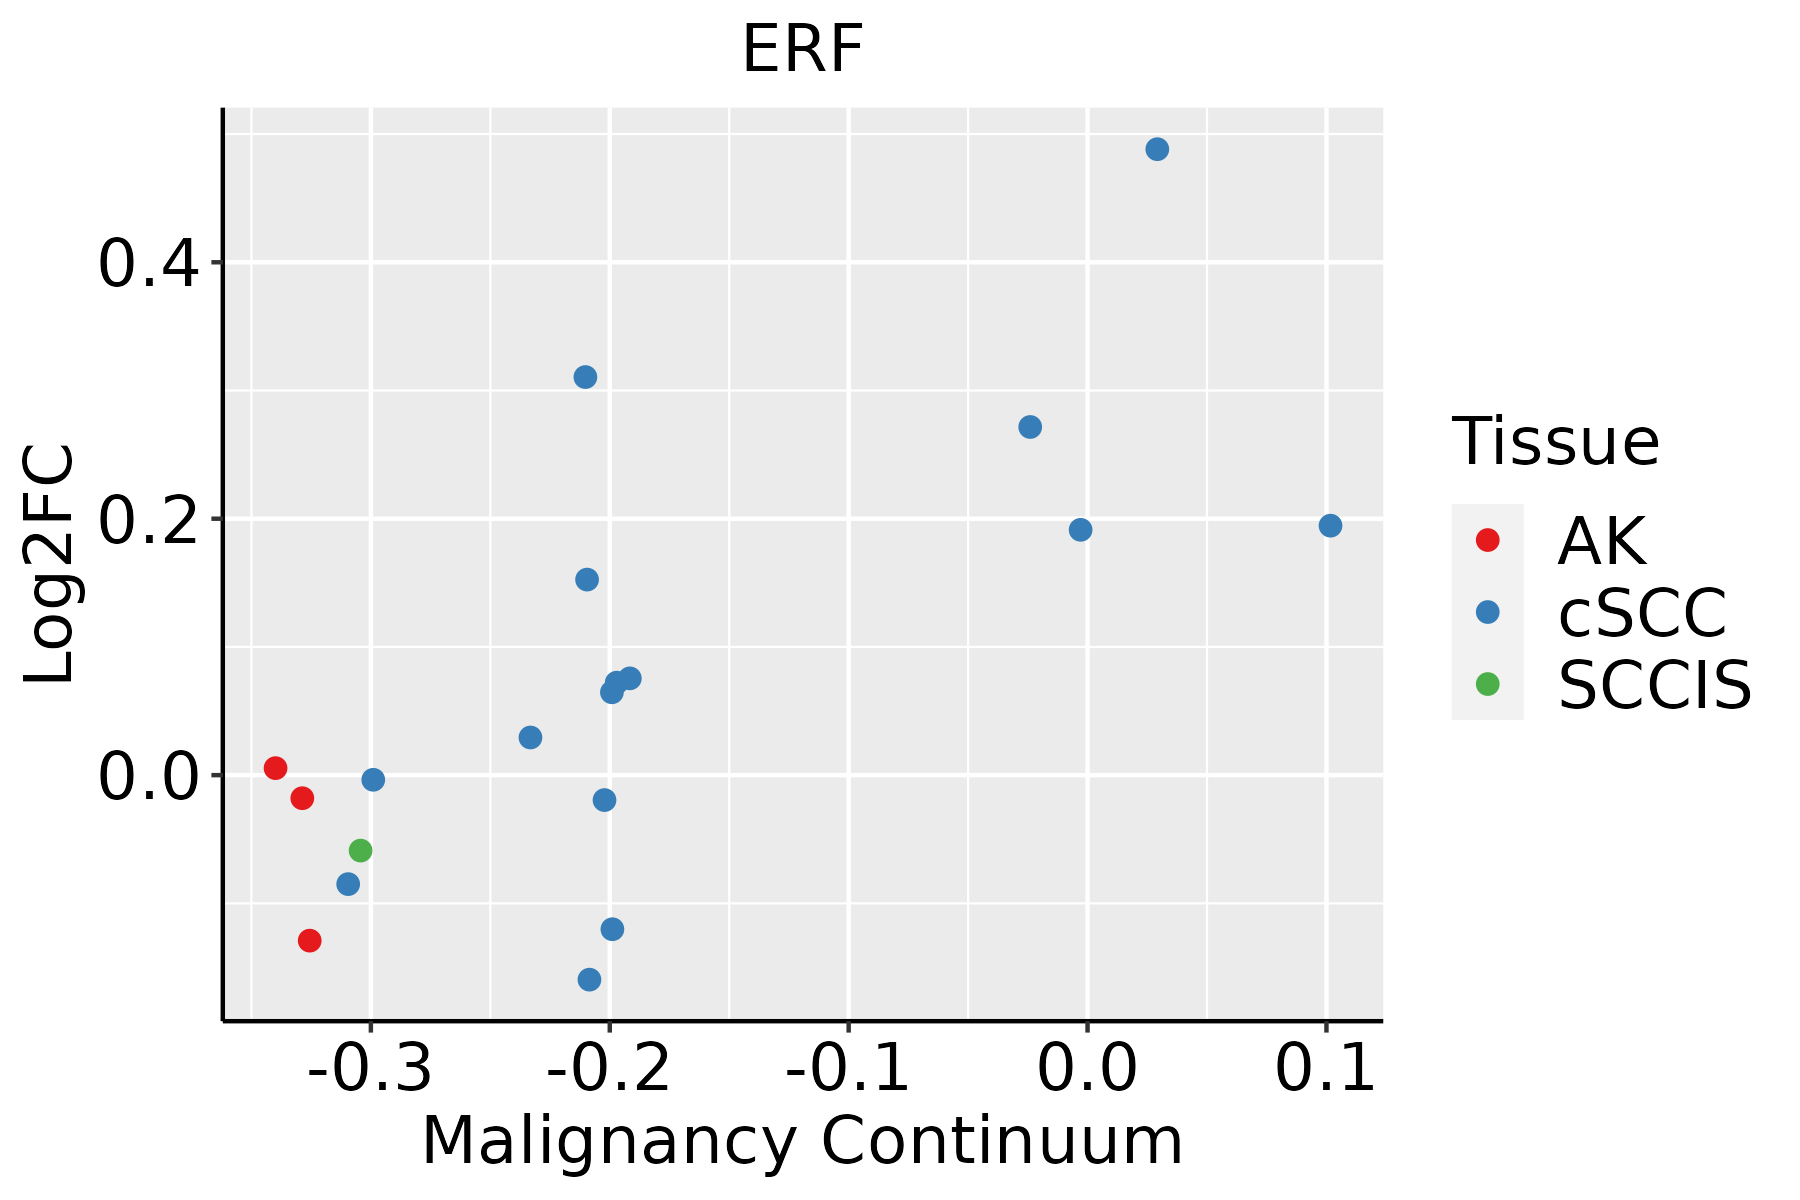 | AK: Actinic keratosis |
| cSCC: Cutaneous squamous cell carcinoma | ||
| SCCIS:squamous cell carcinoma in situ | ||
| Thyroid |  | ATC: Anaplastic thyroid cancer |
| HT: Hashimoto's thyroiditis | ||
| PTC: Papillary thyroid cancer |
| ∗log2FC in expression of this searched gene in stem-like cells from each diseased tissue sample relative to stem-like cells in normal samples in each tissue plotted against the malignancy continuum. Samples are colored based on if they are from different disease stage. |
Top |
Malignant transformation related pathway analysis |
| Find out the enriched GO biological processes and KEGG pathways involved in transition from healthy to precancer to cancer |
| Tissue | Disease Stage | Enriched GO biological Processes |
| Colorectum | AD |  |
| Colorectum | SER |  |
| Colorectum | MSS |  |
| Colorectum | MSI-H |  |
| Colorectum | FAP |  |
| ∗Top 15 enriched GO BP terms are showed in the bar plot of each disease state in each tissue. Each row represents a significant GO biological process which is colored according to the -log10(p.adjust). |
| Page: 1 2 3 4 5 6 7 8 9 |
| GO ID | Tissue | Disease Stage | Description | Gene Ratio | Bg Ratio | pvalue | p.adjust | Count |
| GO:190122231 | Oral cavity | NEOLP | regulation of NIK/NF-kappaB signaling | 24/2005 | 112/18723 | 6.77e-04 | 5.63e-03 | 24 |
| GO:005109231 | Oral cavity | NEOLP | positive regulation of NF-kappaB transcription factor activity | 30/2005 | 152/18723 | 6.81e-04 | 5.66e-03 | 30 |
| GO:003220031 | Oral cavity | NEOLP | telomere organization | 31/2005 | 159/18723 | 6.95e-04 | 5.76e-03 | 31 |
| GO:001063932 | Oral cavity | NEOLP | negative regulation of organelle organization | 57/2005 | 348/18723 | 7.37e-04 | 6.03e-03 | 57 |
| GO:000627831 | Oral cavity | NEOLP | RNA-dependent DNA biosynthetic process | 18/2005 | 75/18723 | 7.69e-04 | 6.20e-03 | 18 |
| GO:005109121 | Oral cavity | NEOLP | positive regulation of DNA-binding transcription factor activity | 45/2005 | 260/18723 | 8.06e-04 | 6.39e-03 | 45 |
| GO:00331382 | Oral cavity | NEOLP | positive regulation of peptidyl-serine phosphorylation | 23/2005 | 108/18723 | 9.48e-04 | 7.33e-03 | 23 |
| GO:003313521 | Oral cavity | NEOLP | regulation of peptidyl-serine phosphorylation | 27/2005 | 144/18723 | 2.67e-03 | 1.66e-02 | 27 |
| GO:19019833 | Oral cavity | NEOLP | regulation of protein acetylation | 17/2005 | 77/18723 | 2.80e-03 | 1.73e-02 | 17 |
| GO:004354331 | Oral cavity | NEOLP | protein acylation | 40/2005 | 243/18723 | 3.85e-03 | 2.21e-02 | 40 |
| GO:000647331 | Oral cavity | NEOLP | protein acetylation | 34/2005 | 201/18723 | 4.76e-03 | 2.61e-02 | 34 |
| GO:003164718 | Prostate | BPH | regulation of protein stability | 111/3107 | 298/18723 | 4.58e-18 | 1.42e-15 | 111 |
| GO:000072314 | Prostate | BPH | telomere maintenance | 52/3107 | 131/18723 | 2.27e-10 | 1.23e-08 | 52 |
| GO:004593618 | Prostate | BPH | negative regulation of phosphate metabolic process | 124/3107 | 441/18723 | 5.95e-10 | 2.90e-08 | 124 |
| GO:001056318 | Prostate | BPH | negative regulation of phosphorus metabolic process | 124/3107 | 442/18723 | 6.94e-10 | 3.25e-08 | 124 |
| GO:004232617 | Prostate | BPH | negative regulation of phosphorylation | 110/3107 | 385/18723 | 2.08e-09 | 8.35e-08 | 110 |
| GO:00322049 | Prostate | BPH | regulation of telomere maintenance | 35/3107 | 80/18723 | 9.96e-09 | 3.34e-07 | 35 |
| GO:000193317 | Prostate | BPH | negative regulation of protein phosphorylation | 97/3107 | 342/18723 | 2.74e-08 | 8.11e-07 | 97 |
| GO:00322005 | Prostate | BPH | telomere organization | 52/3107 | 159/18723 | 4.40e-07 | 8.92e-06 | 52 |
| GO:00070049 | Prostate | BPH | telomere maintenance via telomerase | 29/3107 | 69/18723 | 5.10e-07 | 1.03e-05 | 29 |
| Page: 1 2 3 4 5 6 7 8 9 10 11 12 13 14 15 16 17 18 19 20 21 22 23 24 25 26 27 28 29 30 31 32 33 34 35 36 37 38 39 40 41 42 43 44 45 46 47 48 49 50 |
| Pathway ID | Tissue | Disease Stage | Description | Gene Ratio | Bg Ratio | pvalue | p.adjust | qvalue | Count |
| Page: 1 |
Top |
Cell-cell communication analysis |
| Identification of potential cell-cell interactions between two cell types and their ligand-receptor pairs for different disease states |
| Ligand | Receptor | LRpair | Pathway | Tissue | Disease Stage |
| Page: 1 |
Top |
Single-cell gene regulatory network inference analysis |
| Find out the significant the regulons (TFs) and the target genes of each regulon across cell types for different disease states |
| TF | Cell Type | Tissue | Disease Stage | Target Gene | RSS | Regulon Activity |
| ERF | CD8TRM | Cervix | CC | TRIM24,LINC00641,EVA1B, etc. | 1.62e-01 |  |
| ERF | CD8TRM | Cervix | N_HPV | TRIM24,LINC00641,EVA1B, etc. | 2.98e-01 |  |
| ERF | QUIE | Esophagus | ESCC | IER5,NUMBL,SERTAD1, etc. | 7.95e-02 |  |
| ERF | STM | Esophagus | HGIN | IER5,NUMBL,SERTAD1, etc. | 2.50e-01 |  |
| ERF | STM | Liver | Healthy | PMAIP1,FOXA2,RQCD1, etc. | 6.73e-01 |  |
| ERF | MSC.MVA | Liver | Cirrhotic | CTU1,ZNF781,ABCF2, etc. | 1.27e-01 |  |
| ERF | MVA | Liver | Healthy | CTU1,ZNF781,ABCF2, etc. | 5.47e-02 | |
| ERF | MSC.MVA | Liver | Healthy | CTU1,ZNF781,ABCF2, etc. | 2.64e-02 | |
| ERF | TFH | Lung | IAC | IL15RA,AC007952.4,FRYL, etc. | 1.69e-01 |  |
| ∗The dot plots of a searched regulon are shown for all cell subpopulations in each disease state of each tissue based on the regulon specific score inferred using pySCENIC and by calculating the average expression. |
| Page: 1 |
Top |
Somatic mutation of malignant transformation related genes |
| Annotation of somatic variants for genes involved in malignant transformation |
| Hugo Symbol | Variant Class | Variant Classification | dbSNP RS | HGVSc | HGVSp | HGVSp Short | SWISSPROT | BIOTYPE | SIFT | PolyPhen | Tumor Sample Barcode | Tissue | Histology | Sex | Age | Stage | Therapy Types | Drugs | Outcome |
| ERF | SNV | Missense_Mutation | novel | c.260N>G | p.Tyr87Cys | p.Y87C | P50548 | protein_coding | deleterious(0) | probably_damaging(0.999) | TCGA-4H-AAAK-01 | Breast | breast invasive carcinoma | Female | <65 | III/IV | Chemotherapy | cyclophosphamide | CR |
| ERF | SNV | Missense_Mutation | c.1541N>A | p.Arg514His | p.R514H | P50548 | protein_coding | deleterious_low_confidence(0) | possibly_damaging(0.511) | TCGA-A8-A06X-01 | Breast | breast invasive carcinoma | Female | >=65 | I/II | Unknown | Unknown | SD | |
| ERF | SNV | Missense_Mutation | rs368169058 | c.427N>T | p.Arg143Cys | p.R143C | P50548 | protein_coding | deleterious(0) | probably_damaging(0.928) | TCGA-W8-A86G-01 | Breast | breast invasive carcinoma | Female | >=65 | I/II | Hormone Therapy | arimidex | SD |
| ERF | SNV | Missense_Mutation | c.610N>A | p.Pro204Thr | p.P204T | P50548 | protein_coding | tolerated(0.53) | benign(0.362) | TCGA-C5-A1BQ-01 | Cervix | cervical & endocervical cancer | Female | >=65 | III/IV | Chemotherapy | cisplatin | CR | |
| ERF | SNV | Missense_Mutation | c.1471N>A | p.Asp491Asn | p.D491N | P50548 | protein_coding | deleterious(0) | possibly_damaging(0.746) | TCGA-EK-A2PG-01 | Cervix | cervical & endocervical cancer | Female | >=65 | I/II | Unknown | Unknown | SD | |
| ERF | SNV | Missense_Mutation | c.1513N>C | p.Glu505Gln | p.E505Q | P50548 | protein_coding | tolerated_low_confidence(0.79) | benign(0.014) | TCGA-EK-A2RB-01 | Cervix | cervical & endocervical cancer | Female | <65 | I/II | Unknown | Unknown | SD | |
| ERF | SNV | Missense_Mutation | novel | c.1519G>A | p.Glu507Lys | p.E507K | P50548 | protein_coding | deleterious_low_confidence(0) | benign(0.007) | TCGA-VS-A958-01 | Cervix | cervical & endocervical cancer | Female | <65 | I/II | Chemotherapy | cisplatin | CR |
| ERF | SNV | Missense_Mutation | c.1628N>C | p.Leu543Pro | p.L543P | P50548 | protein_coding | deleterious_low_confidence(0) | probably_damaging(0.996) | TCGA-A6-3809-01 | Colorectum | colon adenocarcinoma | Female | >=65 | I/II | Unknown | Unknown | SD | |
| ERF | SNV | Missense_Mutation | rs767080643 | c.616N>A | p.Ala206Thr | p.A206T | P50548 | protein_coding | tolerated(0.43) | benign(0.082) | TCGA-AA-3492-01 | Colorectum | colon adenocarcinoma | Female | >=65 | I/II | Unknown | Unknown | SD |
| ERF | SNV | Missense_Mutation | novel | c.502N>C | p.Ser168Pro | p.S168P | P50548 | protein_coding | tolerated(0.09) | possibly_damaging(0.763) | TCGA-AA-3877-01 | Colorectum | colon adenocarcinoma | Female | >=65 | I/II | Unknown | Unknown | SD |
| Page: 1 2 3 4 5 6 7 |
Top |
Related drugs of malignant transformation related genes |
| Identification of chemicals and drugs interact with genes involved in malignant transfromation |
| (DGIdb 4.0) |
| Entrez ID | Symbol | Category | Interaction Types | Drug Claim Name | Drug Name | PMIDs |
| Page: 1 |

Copyright 2023-Present -The University of Texas Health Science Center at Houston |