| Tissue | Expression Dynamics | Abbreviation |
| Cervix | 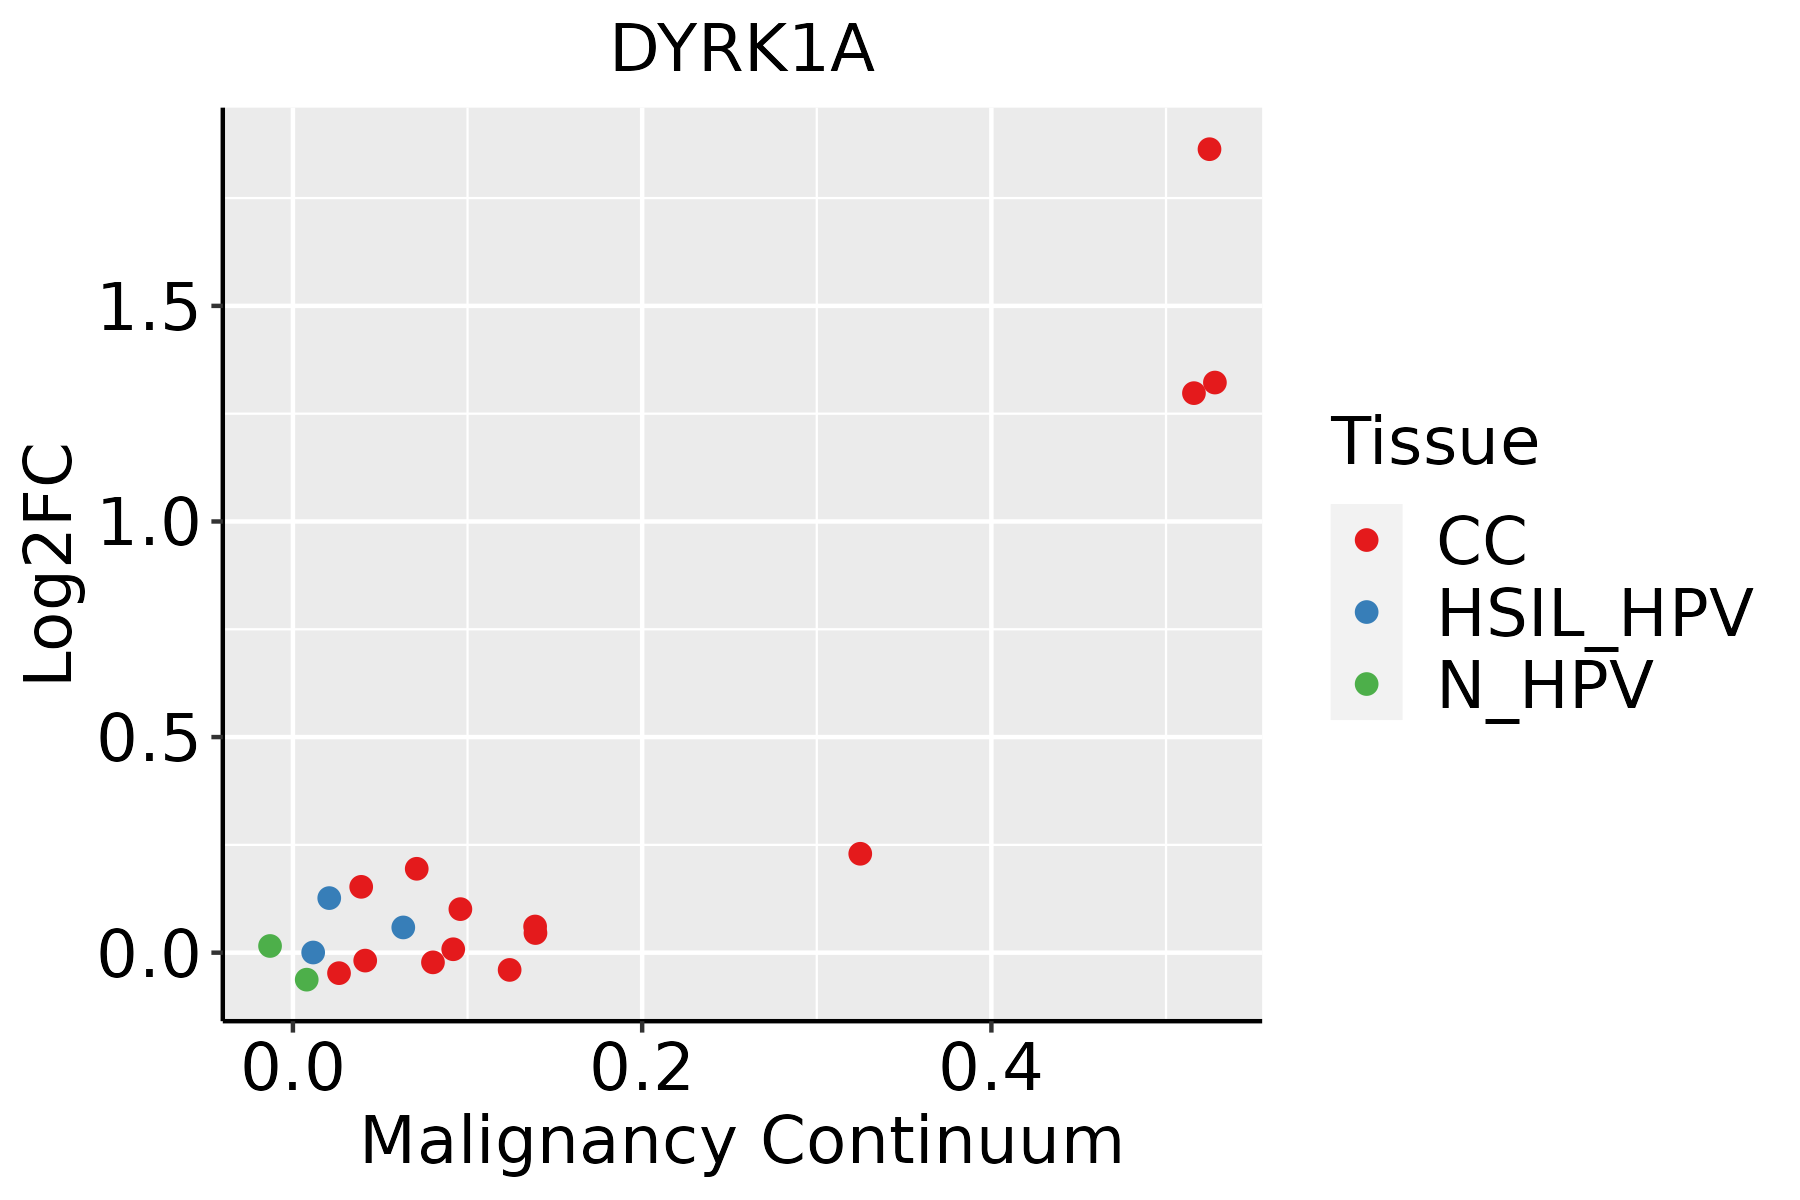 | CC: Cervix cancer |
| HSIL_HPV: HPV-infected high-grade squamous intraepithelial lesions |
| N_HPV: HPV-infected normal cervix |
| Colorectum (GSE201348) | 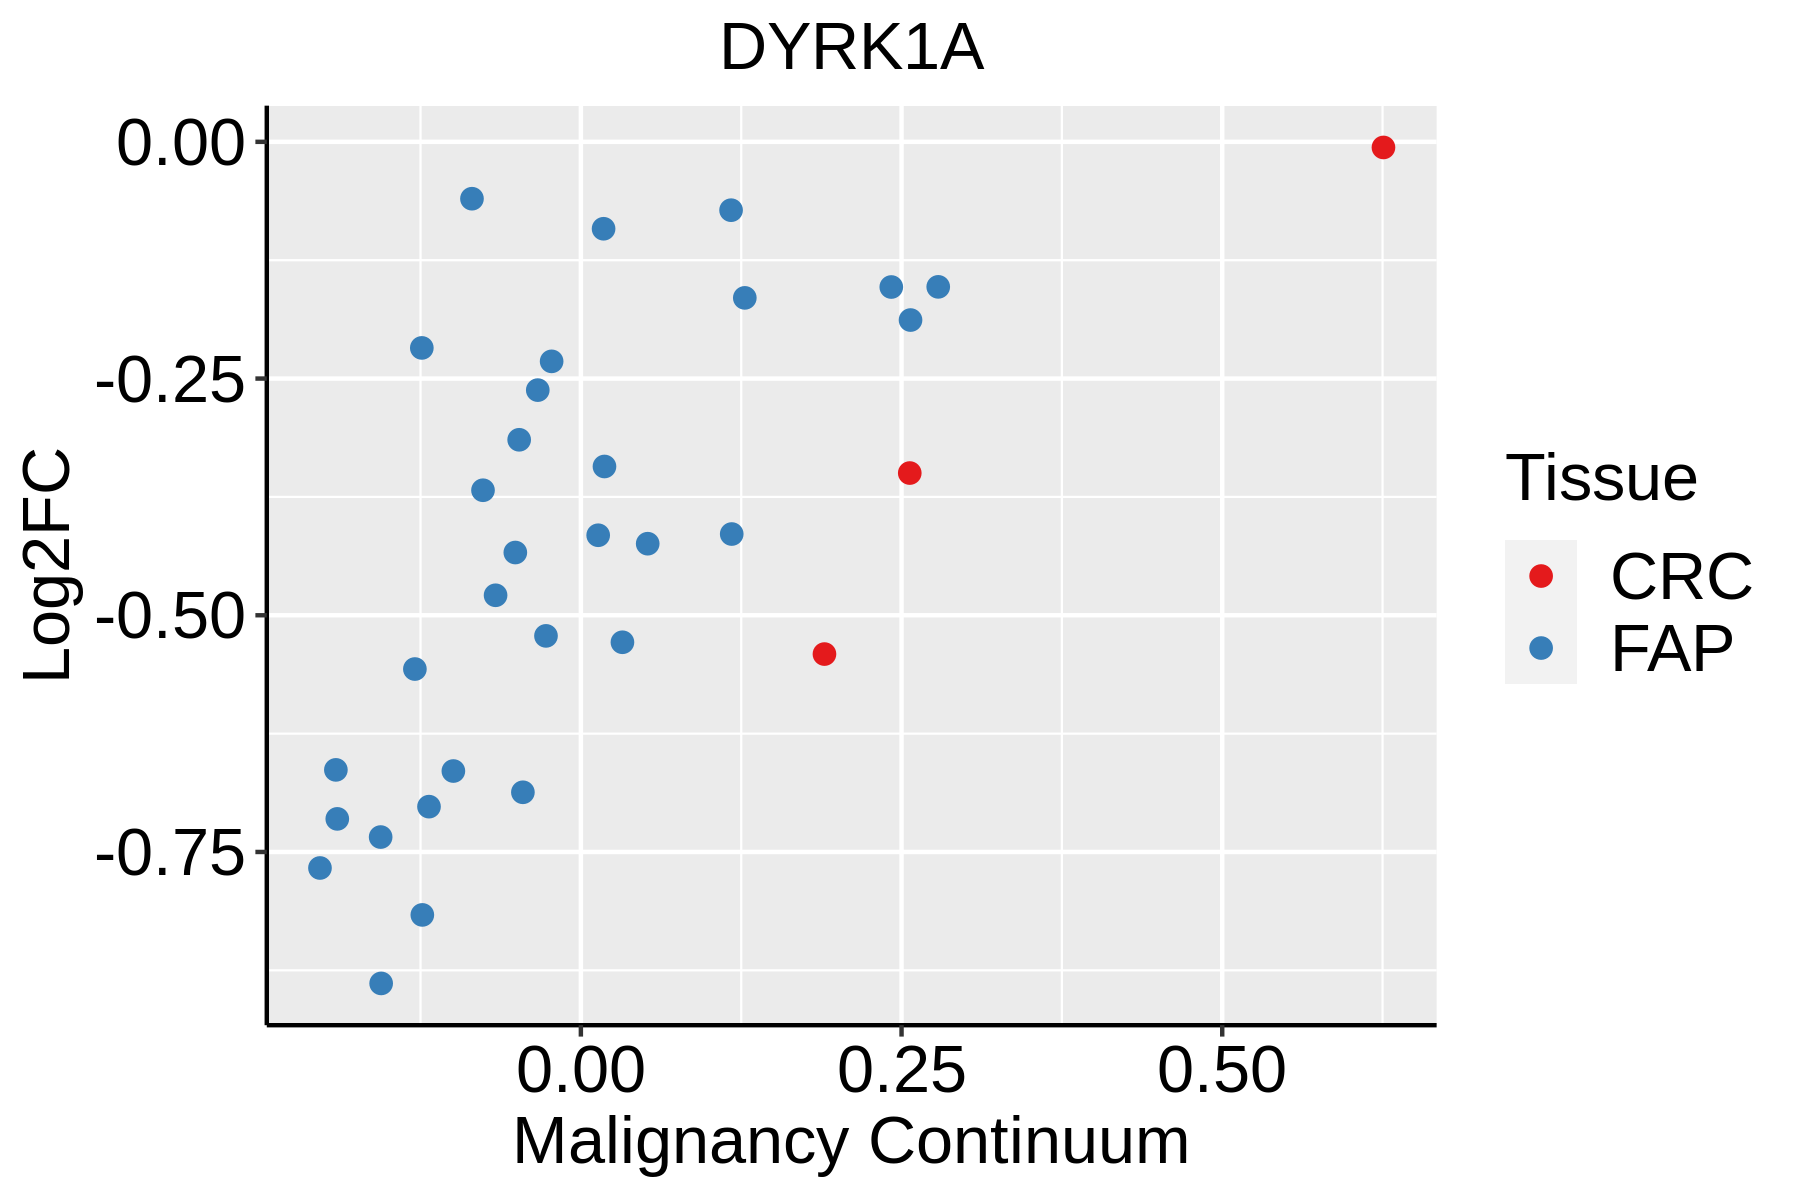 | FAP: Familial adenomatous polyposis |
| CRC: Colorectal cancer |
| Colorectum (HTA11) |  | AD: Adenomas |
| SER: Sessile serrated lesions |
| MSI-H: Microsatellite-high colorectal cancer |
| MSS: Microsatellite stable colorectal cancer |
| Endometrium |  | AEH: Atypical endometrial hyperplasia |
| EEC: Endometrioid Cancer |
| Liver |  | HCC: Hepatocellular carcinoma |
| NAFLD: Non-alcoholic fatty liver disease |
| Lung |  | AAH: Atypical adenomatous hyperplasia |
| AIS: Adenocarcinoma in situ |
| IAC: Invasive lung adenocarcinoma |
| MIA: Minimally invasive adenocarcinoma |
| Oral Cavity | 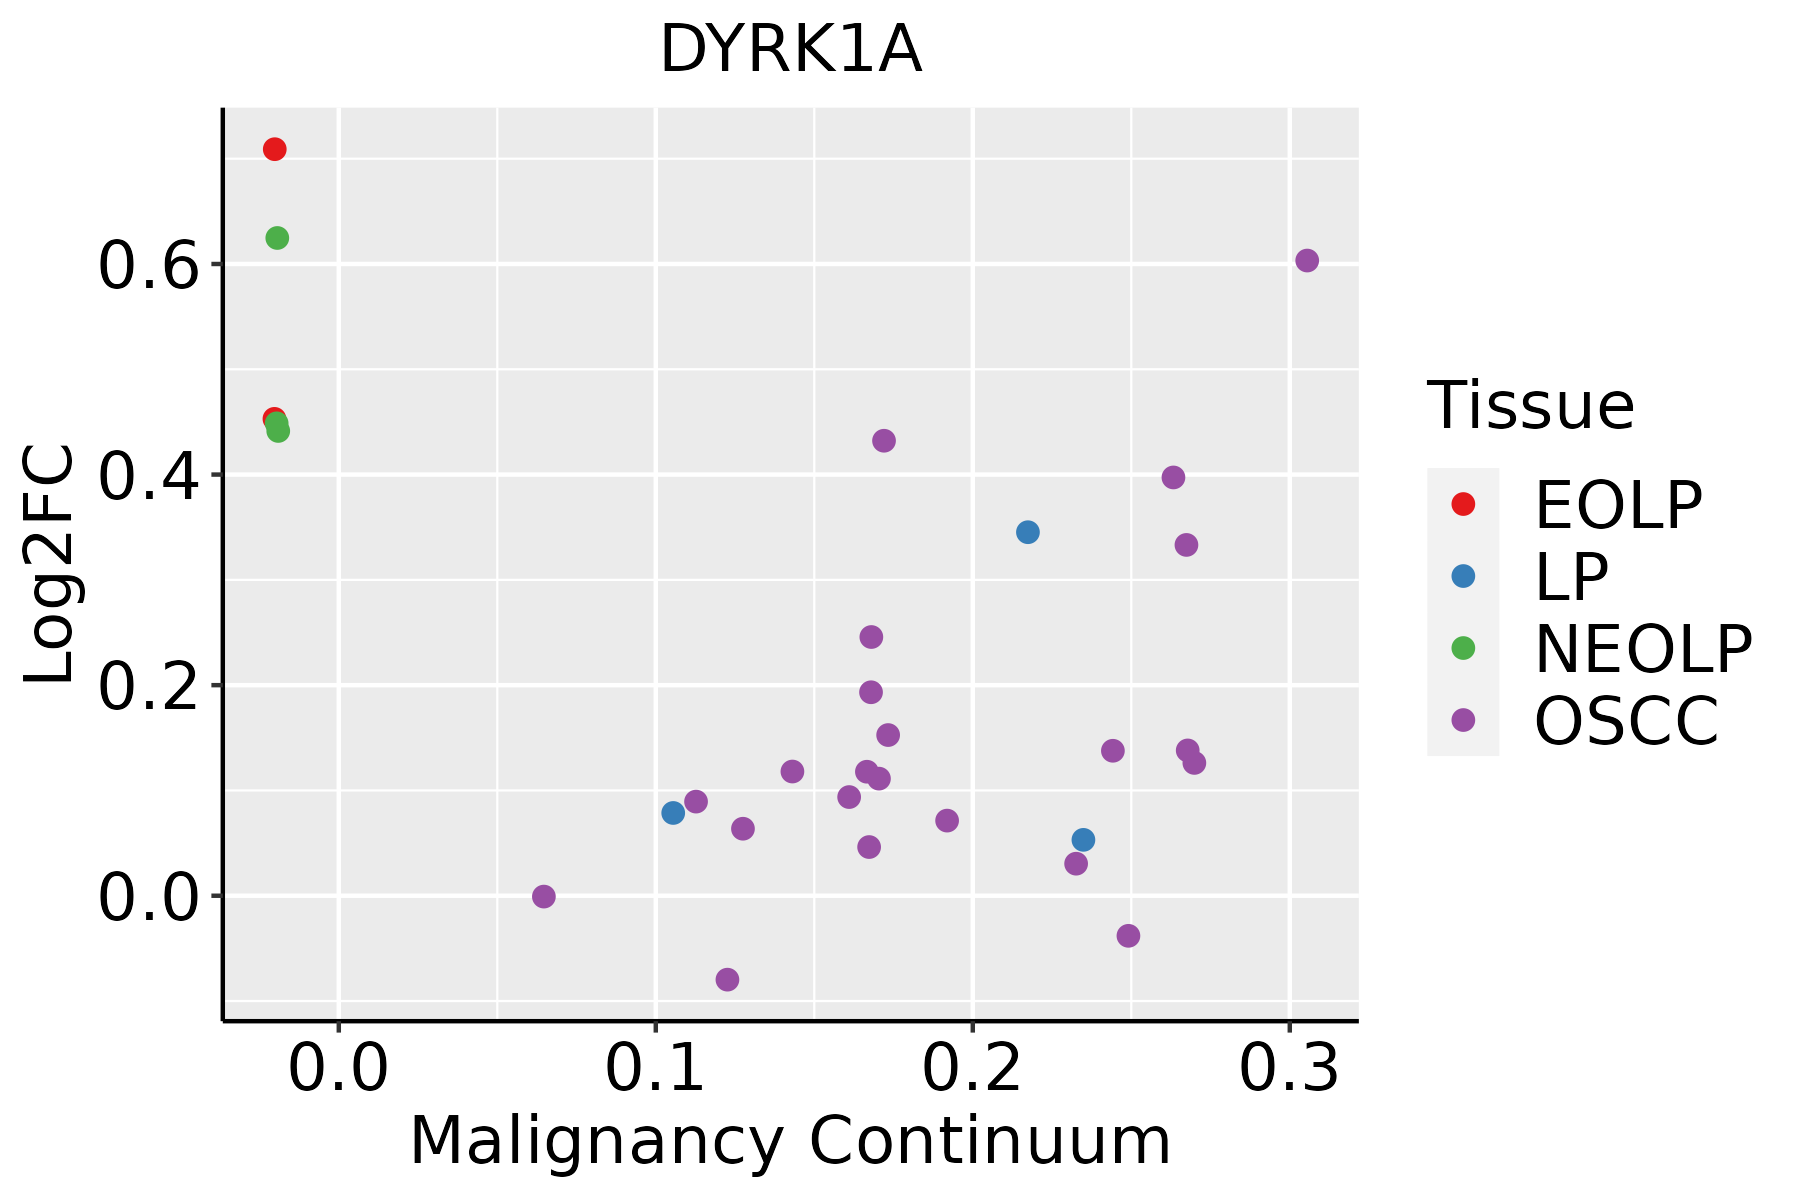 | EOLP: Erosive Oral lichen planus |
| LP: leukoplakia |
| NEOLP: Non-erosive oral lichen planus |
| OSCC: Oral squamous cell carcinoma |
| Prostate |  | BPH: Benign Prostatic Hyperplasia |
| Skin | 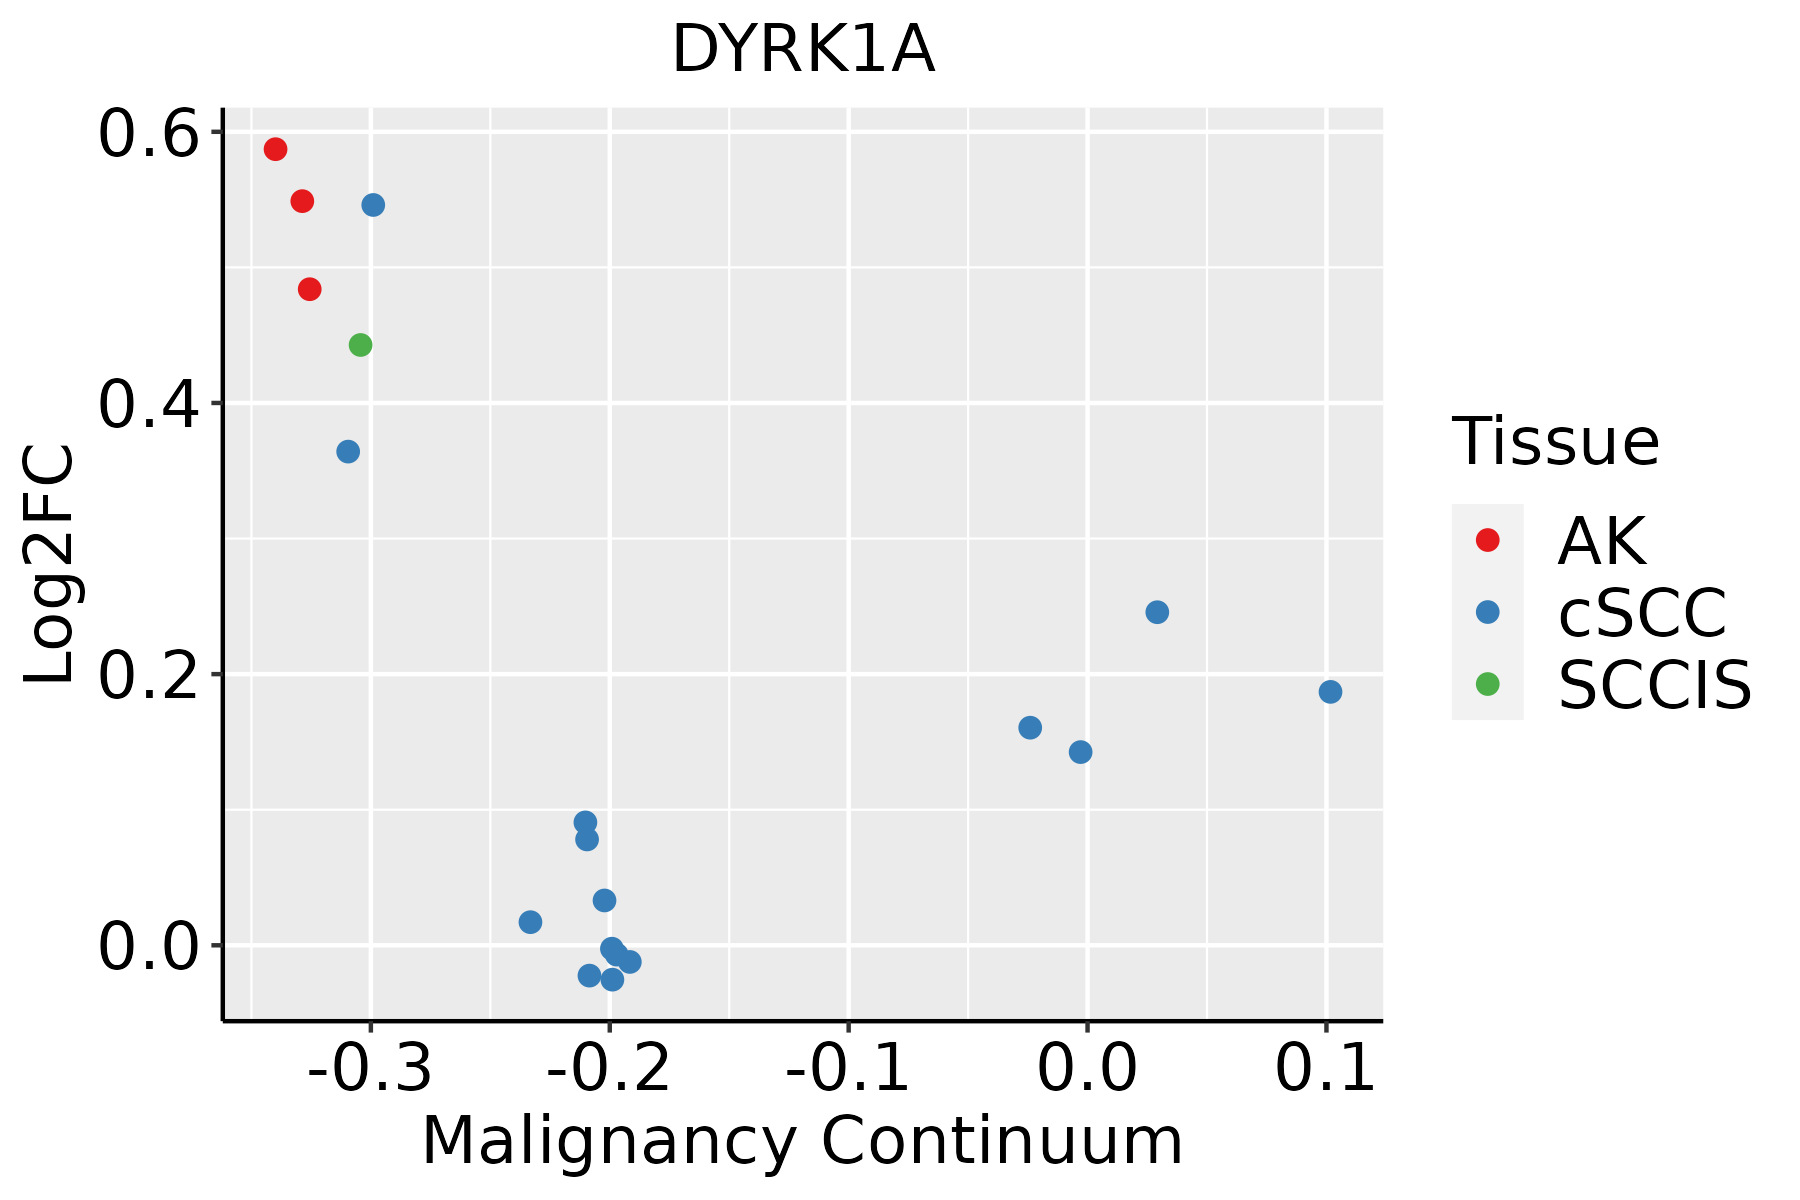 | AK: Actinic keratosis |
| cSCC: Cutaneous squamous cell carcinoma |
| SCCIS:squamous cell carcinoma in situ |
| Thyroid |  | ATC: Anaplastic thyroid cancer |
| HT: Hashimoto's thyroiditis |
| PTC: Papillary thyroid cancer |
| GO ID | Tissue | Disease Stage | Description | Gene Ratio | Bg Ratio | pvalue | p.adjust | Count |
| GO:004677713 | Oral cavity | EOLP | protein autophosphorylation | 49/2218 | 227/18723 | 2.04e-05 | 3.21e-04 | 49 |
| GO:200102024 | Oral cavity | EOLP | regulation of response to DNA damage stimulus | 47/2218 | 219/18723 | 3.47e-05 | 4.85e-04 | 47 |
| GO:003111321 | Oral cavity | EOLP | regulation of microtubule polymerization | 18/2218 | 55/18723 | 3.72e-05 | 5.14e-04 | 18 |
| GO:001063923 | Oral cavity | EOLP | negative regulation of organelle organization | 67/2218 | 348/18723 | 3.78e-05 | 5.21e-04 | 67 |
| GO:000762317 | Oral cavity | EOLP | circadian rhythm | 45/2218 | 210/18723 | 5.24e-05 | 6.79e-04 | 45 |
| GO:190179626 | Oral cavity | EOLP | regulation of signal transduction by p53 class mediator | 25/2218 | 93/18723 | 5.69e-05 | 7.24e-04 | 25 |
| GO:004678521 | Oral cavity | EOLP | microtubule polymerization | 23/2218 | 83/18723 | 6.67e-05 | 8.27e-04 | 23 |
| GO:190290424 | Oral cavity | EOLP | negative regulation of supramolecular fiber organization | 37/2218 | 167/18723 | 1.14e-04 | 1.27e-03 | 37 |
| GO:004802523 | Oral cavity | EOLP | negative regulation of mRNA splicing, via spliceosome | 9/2218 | 20/18723 | 2.23e-04 | 2.21e-03 | 9 |
| GO:007050722 | Oral cavity | EOLP | regulation of microtubule cytoskeleton organization | 33/2218 | 148/18723 | 2.29e-04 | 2.25e-03 | 33 |
| GO:003227216 | Oral cavity | EOLP | negative regulation of protein polymerization | 20/2218 | 80/18723 | 8.40e-04 | 6.56e-03 | 20 |
| GO:00182121 | Oral cavity | EOLP | peptidyl-tyrosine modification | 65/2218 | 378/18723 | 1.25e-03 | 9.02e-03 | 65 |
| GO:000647621 | Oral cavity | EOLP | protein deacetylation | 23/2218 | 101/18723 | 1.42e-03 | 9.65e-03 | 23 |
| GO:00181081 | Oral cavity | EOLP | peptidyl-tyrosine phosphorylation | 64/2218 | 375/18723 | 1.65e-03 | 1.09e-02 | 64 |
| GO:00311091 | Oral cavity | EOLP | microtubule polymerization or depolymerization | 26/2218 | 122/18723 | 2.01e-03 | 1.28e-02 | 26 |
| GO:005068622 | Oral cavity | EOLP | negative regulation of mRNA processing | 9/2218 | 29/18723 | 4.94e-03 | 2.62e-02 | 9 |
| GO:005149416 | Oral cavity | EOLP | negative regulation of cytoskeleton organization | 31/2218 | 163/18723 | 5.09e-03 | 2.67e-02 | 31 |
| GO:003560121 | Oral cavity | EOLP | protein deacylation | 23/2218 | 112/18723 | 5.70e-03 | 2.92e-02 | 23 |
| GO:003111011 | Oral cavity | EOLP | regulation of microtubule polymerization or depolymerization | 19/2218 | 88/18723 | 6.55e-03 | 3.21e-02 | 19 |
| GO:009031111 | Oral cavity | EOLP | regulation of protein deacetylation | 12/2218 | 48/18723 | 8.72e-03 | 4.05e-02 | 12 |
| Hugo Symbol | Variant Class | Variant Classification | dbSNP RS | HGVSc | HGVSp | HGVSp Short | SWISSPROT | BIOTYPE | SIFT | PolyPhen | Tumor Sample Barcode | Tissue | Histology | Sex | Age | Stage | Therapy Types | Drugs | Outcome |
| DYRK1A | SNV | Missense_Mutation | | c.217G>C | p.Asp73His | p.D73H | Q13627 | protein_coding | deleterious(0) | benign(0.364) | TCGA-A2-A0EQ-01 | Breast | breast invasive carcinoma | Female | <65 | I/II | Chemotherapy | adriamycin | SD |
| DYRK1A | SNV | Missense_Mutation | | c.1744C>G | p.His582Asp | p.H582D | Q13627 | protein_coding | tolerated_low_confidence(0.18) | possibly_damaging(0.84) | TCGA-A2-A0EQ-01 | Breast | breast invasive carcinoma | Female | <65 | I/II | Chemotherapy | adriamycin | SD |
| DYRK1A | SNV | Missense_Mutation | | c.1976N>T | p.Ser659Phe | p.S659F | Q13627 | protein_coding | deleterious_low_confidence(0) | probably_damaging(0.962) | TCGA-A8-A094-01 | Breast | breast invasive carcinoma | Female | >=65 | I/II | Unknown | Unknown | SD |
| DYRK1A | SNV | Missense_Mutation | | c.1626C>A | p.Phe542Leu | p.F542L | Q13627 | protein_coding | tolerated(0.05) | benign(0.001) | TCGA-AC-A23H-01 | Breast | breast invasive carcinoma | Female | >=65 | I/II | Unknown | Unknown | PD |
| DYRK1A | SNV | Missense_Mutation | | c.161N>T | p.Ser54Phe | p.S54F | Q13627 | protein_coding | deleterious_low_confidence(0.01) | benign(0.044) | TCGA-AO-A0JC-01 | Breast | breast invasive carcinoma | Female | <65 | I/II | Chemotherapy | fluorouracil | SD |
| DYRK1A | SNV | Missense_Mutation | | c.46C>T | p.Arg16Trp | p.R16W | Q13627 | protein_coding | deleterious_low_confidence(0) | possibly_damaging(0.454) | TCGA-BH-A0HP-01 | Breast | breast invasive carcinoma | Female | >=65 | III/IV | Chemotherapy | doxorubicin | SD |
| DYRK1A | SNV | Missense_Mutation | | c.492G>C | p.Leu164Phe | p.L164F | Q13627 | protein_coding | deleterious(0.02) | probably_damaging(0.949) | TCGA-BH-A0HP-01 | Breast | breast invasive carcinoma | Female | >=65 | III/IV | Chemotherapy | doxorubicin | SD |
| DYRK1A | SNV | Missense_Mutation | | c.2230N>C | p.Asp744His | p.D744H | Q13627 | protein_coding | deleterious_low_confidence(0) | probably_damaging(0.99) | TCGA-BH-A18P-01 | Breast | breast invasive carcinoma | Female | <65 | I/II | Unknown | Unknown | PD |
| DYRK1A | SNV | Missense_Mutation | | c.183G>C | p.Gln61His | p.Q61H | Q13627 | protein_coding | deleterious_low_confidence(0.01) | possibly_damaging(0.626) | TCGA-D8-A1JP-01 | Breast | breast invasive carcinoma | Female | >=65 | I/II | Hormone Therapy | tamoxiphen | SD |
| DYRK1A | SNV | Missense_Mutation | | c.1898A>G | p.Tyr633Cys | p.Y633C | Q13627 | protein_coding | deleterious_low_confidence(0.02) | probably_damaging(0.984) | TCGA-E2-A15E-01 | Breast | breast invasive carcinoma | Female | <65 | I/II | Chemotherapy | doxorubicin | SD |
| Entrez ID | Symbol | Category | Interaction Types | Drug Claim Name | Drug Name | PMIDs |
| 1859 | DYRK1A | DRUGGABLE GENOME, KINASE, ENZYME, TYROSINE KINASE, SERINE THREONINE KINASE | | PMID28766366-Compound-Scheme1WO2011135259 | | |
| 1859 | DYRK1A | DRUGGABLE GENOME, KINASE, ENZYME, TYROSINE KINASE, SERINE THREONINE KINASE | | PMID28766366-Compound-Scheme15-1 | | |
| 1859 | DYRK1A | DRUGGABLE GENOME, KINASE, ENZYME, TYROSINE KINASE, SERINE THREONINE KINASE | | PMID28766366-Compound-Scheme6Pyrrolo[2,3-d]pyrimidines | | |
| 1859 | DYRK1A | DRUGGABLE GENOME, KINASE, ENZYME, TYROSINE KINASE, SERINE THREONINE KINASE | | PMID28766366-Compound-Scheme23MPPDerivatives | | |
| 1859 | DYRK1A | DRUGGABLE GENOME, KINASE, ENZYME, TYROSINE KINASE, SERINE THREONINE KINASE | inhibitor | 249565842 | | |
| 1859 | DYRK1A | DRUGGABLE GENOME, KINASE, ENZYME, TYROSINE KINASE, SERINE THREONINE KINASE | | PMID28766366-Compound-Scheme13INDY | | |
| 1859 | DYRK1A | DRUGGABLE GENOME, KINASE, ENZYME, TYROSINE KINASE, SERINE THREONINE KINASE | inhibitor | 405560505 | | |
| 1859 | DYRK1A | DRUGGABLE GENOME, KINASE, ENZYME, TYROSINE KINASE, SERINE THREONINE KINASE | | PMID28766366-Compound-Scheme4Upper | | |
| 1859 | DYRK1A | DRUGGABLE GENOME, KINASE, ENZYME, TYROSINE KINASE, SERINE THREONINE KINASE | | PMID28766366-Compound-Scheme12-3 | | |
| 1859 | DYRK1A | DRUGGABLE GENOME, KINASE, ENZYME, TYROSINE KINASE, SERINE THREONINE KINASE | | PMID28766366-Compound-Scheme18 | | |


