
|
|||||
|
 | |
| |
| |
| |
| |
| |
|
Gene: USP7 |
Gene summary for USP7 |
| Gene information | Species | Human | Gene symbol | USP7 | Gene ID | 7874 |
| Gene name | ubiquitin specific peptidase 7 | |
| Gene Alias | HAFOUS | |
| Cytomap | 16p13.2 | |
| Gene Type | protein-coding | GO ID | GO:0000723 | UniProtAcc | B7ZAX6 |
Top |
Malignant transformation analysis |
| Identification of the aberrant gene expression in precancerous and cancerous lesions by comparing the gene expression of stem-like cells in diseased tissues with normal stem cells |
| Entrez ID | Symbol | Replicates | Species | Organ | Tissue | Adj P-value | Log2FC | Malignancy |
| 7874 | USP7 | HTA11_347_2000001011 | Human | Colorectum | AD | 4.86e-06 | 4.64e-01 | -0.1954 |
| 7874 | USP7 | HTA11_99999965104_69814 | Human | Colorectum | MSS | 2.08e-02 | 5.37e-01 | 0.281 |
| 7874 | USP7 | A002-C-010 | Human | Colorectum | FAP | 3.22e-03 | -1.50e-01 | 0.242 |
| 7874 | USP7 | A001-C-207 | Human | Colorectum | FAP | 3.18e-02 | -1.97e-01 | 0.1278 |
| 7874 | USP7 | A015-C-203 | Human | Colorectum | FAP | 6.88e-21 | -1.84e-01 | -0.1294 |
| 7874 | USP7 | A015-C-204 | Human | Colorectum | FAP | 1.22e-03 | -6.90e-02 | -0.0228 |
| 7874 | USP7 | A002-C-201 | Human | Colorectum | FAP | 1.48e-07 | -1.24e-01 | 0.0324 |
| 7874 | USP7 | A002-C-203 | Human | Colorectum | FAP | 1.60e-03 | -6.90e-02 | 0.2786 |
| 7874 | USP7 | A001-C-108 | Human | Colorectum | FAP | 7.29e-12 | -8.90e-02 | -0.0272 |
| 7874 | USP7 | A002-C-205 | Human | Colorectum | FAP | 9.49e-15 | -1.65e-01 | -0.1236 |
| 7874 | USP7 | A015-C-006 | Human | Colorectum | FAP | 1.13e-08 | -2.99e-01 | -0.0994 |
| 7874 | USP7 | A015-C-106 | Human | Colorectum | FAP | 1.87e-10 | -6.87e-02 | -0.0511 |
| 7874 | USP7 | A002-C-114 | Human | Colorectum | FAP | 2.40e-11 | -1.95e-01 | -0.1561 |
| 7874 | USP7 | A015-C-104 | Human | Colorectum | FAP | 2.00e-24 | 1.78e-02 | -0.1899 |
| 7874 | USP7 | A001-C-014 | Human | Colorectum | FAP | 3.17e-10 | -1.35e-01 | 0.0135 |
| 7874 | USP7 | A002-C-016 | Human | Colorectum | FAP | 3.35e-18 | -1.93e-01 | 0.0521 |
| 7874 | USP7 | A015-C-002 | Human | Colorectum | FAP | 7.67e-08 | -3.19e-01 | -0.0763 |
| 7874 | USP7 | A001-C-203 | Human | Colorectum | FAP | 1.66e-10 | -9.89e-02 | -0.0481 |
| 7874 | USP7 | A002-C-116 | Human | Colorectum | FAP | 1.94e-22 | -3.34e-01 | -0.0452 |
| 7874 | USP7 | A014-C-008 | Human | Colorectum | FAP | 1.12e-07 | -7.91e-02 | -0.191 |
| Page: 1 2 3 4 5 6 7 8 9 |
| Tissue | Expression Dynamics | Abbreviation |
| Colorectum (GSE201348) |  | FAP: Familial adenomatous polyposis |
| CRC: Colorectal cancer | ||
| Colorectum (HTA11) |  | AD: Adenomas |
| SER: Sessile serrated lesions | ||
| MSI-H: Microsatellite-high colorectal cancer | ||
| MSS: Microsatellite stable colorectal cancer | ||
| Esophagus |  | ESCC: Esophageal squamous cell carcinoma |
| HGIN: High-grade intraepithelial neoplasias | ||
| LGIN: Low-grade intraepithelial neoplasias | ||
| Liver | 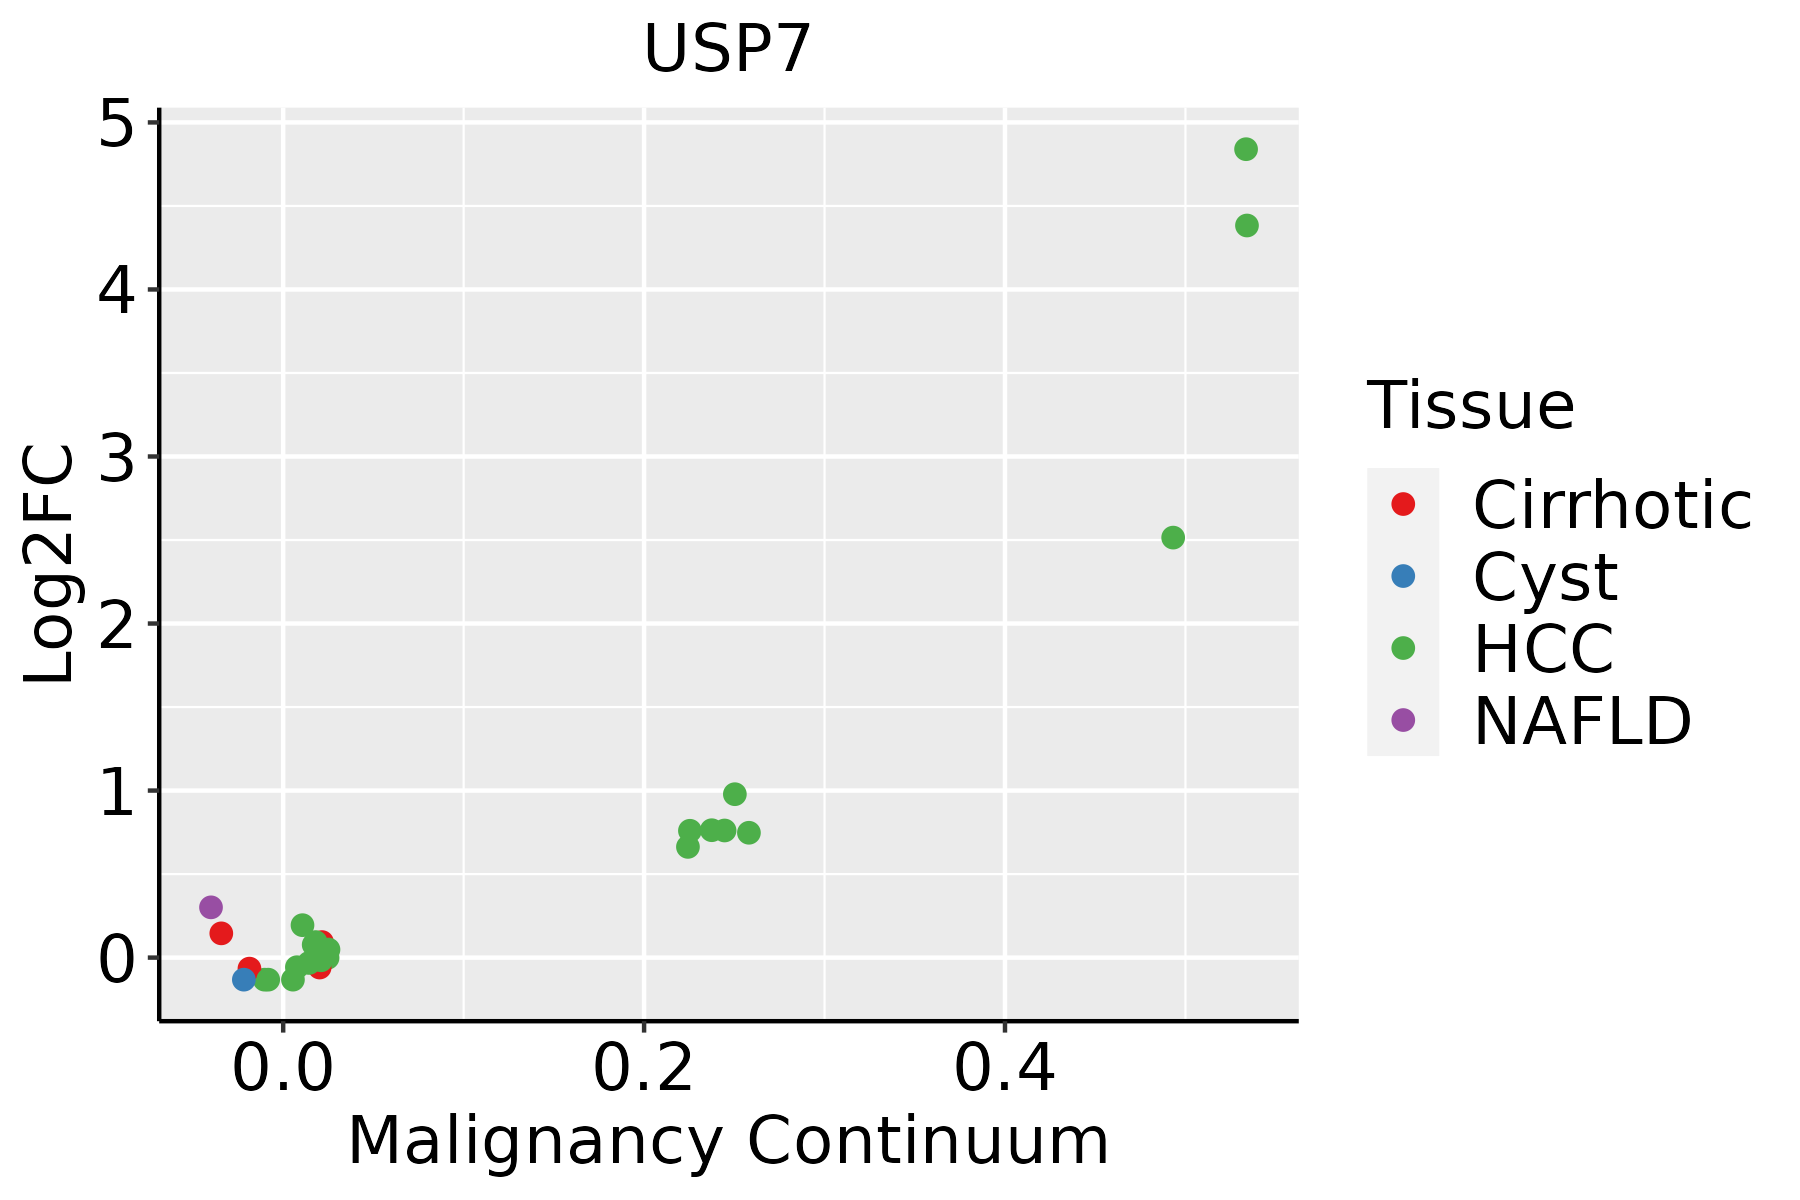 | HCC: Hepatocellular carcinoma |
| NAFLD: Non-alcoholic fatty liver disease | ||
| Oral Cavity | 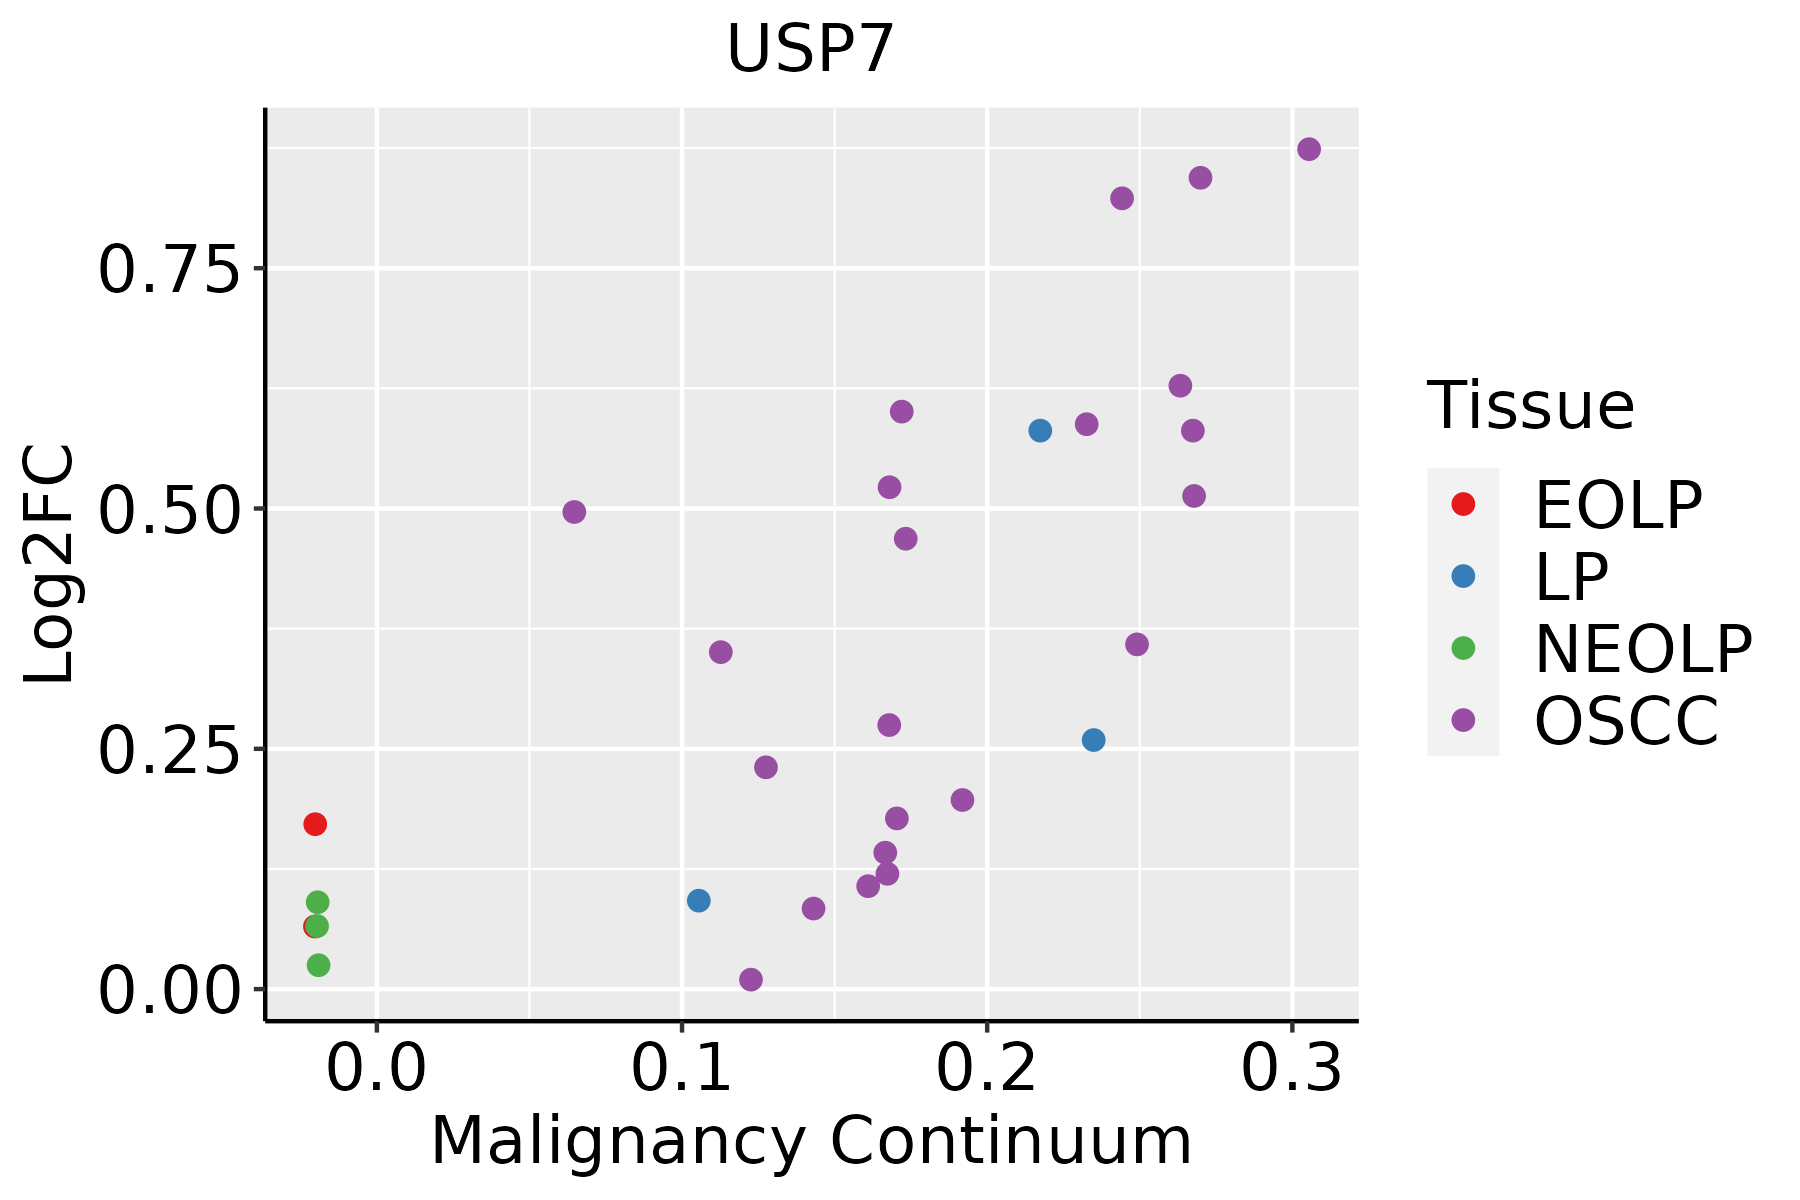 | EOLP: Erosive Oral lichen planus |
| LP: leukoplakia | ||
| NEOLP: Non-erosive oral lichen planus | ||
| OSCC: Oral squamous cell carcinoma | ||
| Prostate |  | BPH: Benign Prostatic Hyperplasia |
| Skin | 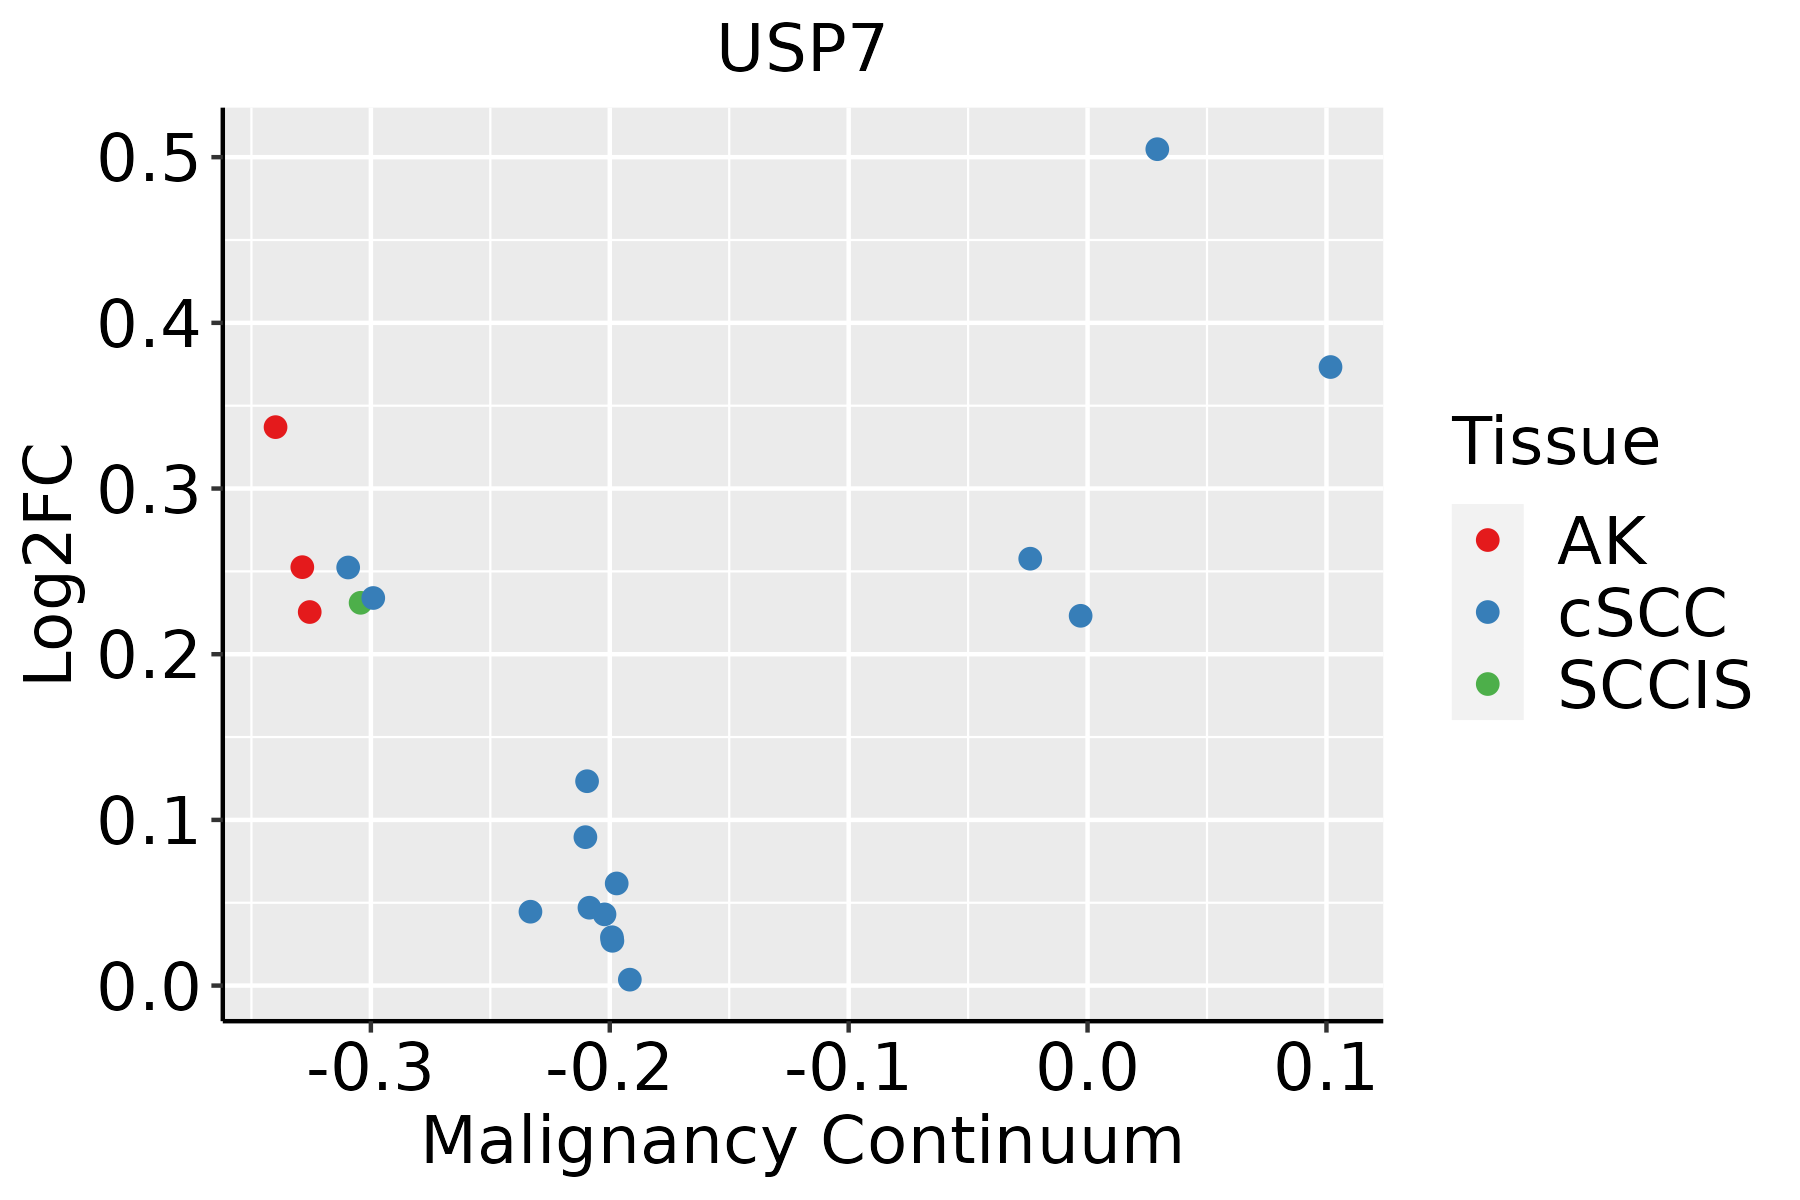 | AK: Actinic keratosis |
| cSCC: Cutaneous squamous cell carcinoma | ||
| SCCIS:squamous cell carcinoma in situ | ||
| Thyroid | 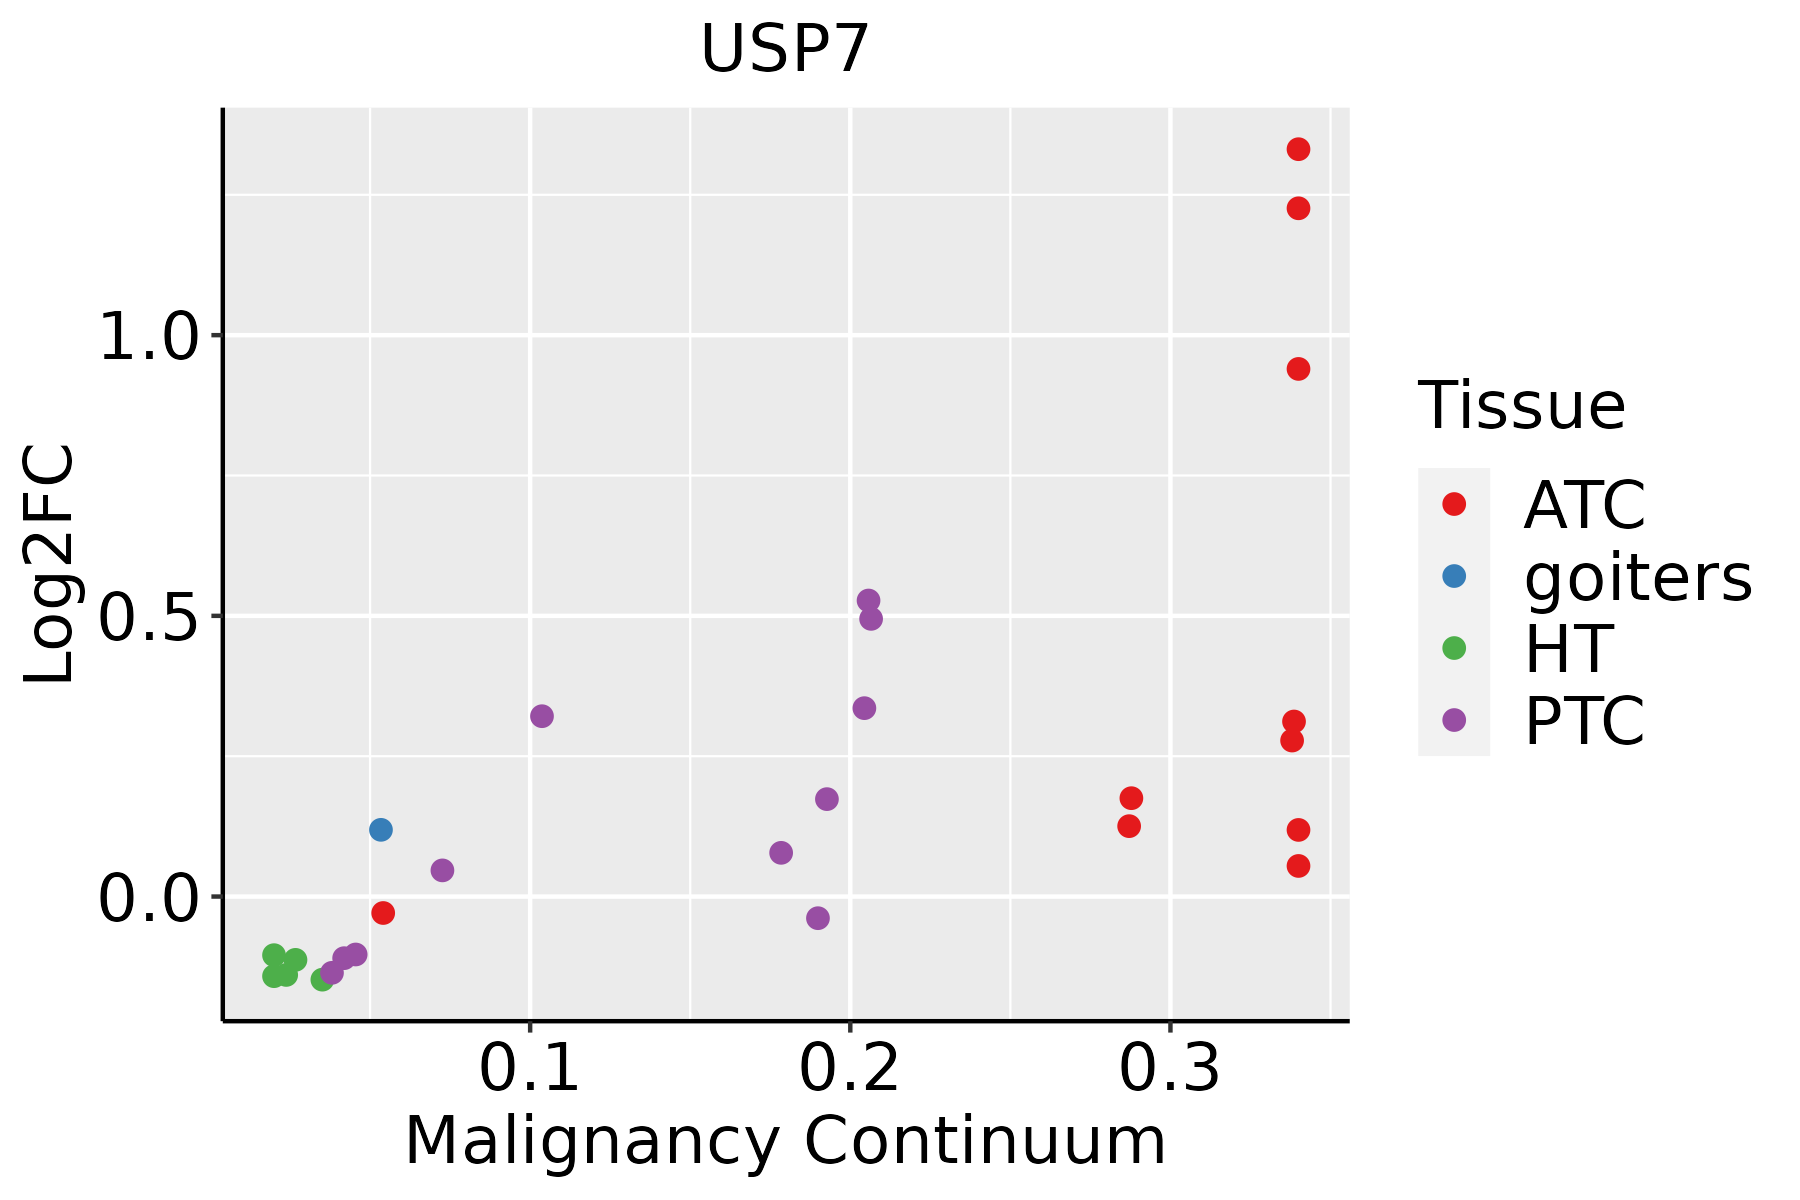 | ATC: Anaplastic thyroid cancer |
| HT: Hashimoto's thyroiditis | ||
| PTC: Papillary thyroid cancer |
| ∗log2FC in expression of this searched gene in stem-like cells from each diseased tissue sample relative to stem-like cells in normal samples in each tissue plotted against the malignancy continuum. Samples are colored based on if they are from different disease stage. |
Top |
Malignant transformation related pathway analysis |
| Find out the enriched GO biological processes and KEGG pathways involved in transition from healthy to precancer to cancer |
| Tissue | Disease Stage | Enriched GO biological Processes |
| Colorectum | AD |  |
| Colorectum | SER |  |
| Colorectum | MSS |  |
| Colorectum | MSI-H |  |
| Colorectum | FAP |  |
| ∗Top 15 enriched GO BP terms are showed in the bar plot of each disease state in each tissue. Each row represents a significant GO biological process which is colored according to the -log10(p.adjust). |
| Page: 1 2 3 4 5 6 7 8 9 |
| GO ID | Tissue | Disease Stage | Description | Gene Ratio | Bg Ratio | pvalue | p.adjust | Count |
| GO:0010498113 | Thyroid | PTC | proteasomal protein catabolic process | 297/5968 | 490/18723 | 4.58e-40 | 9.63e-37 | 297 |
| GO:0043161113 | Thyroid | PTC | proteasome-mediated ubiquitin-dependent protein catabolic process | 254/5968 | 412/18723 | 3.91e-36 | 4.54e-33 | 254 |
| GO:0042176113 | Thyroid | PTC | regulation of protein catabolic process | 231/5968 | 391/18723 | 4.76e-29 | 2.14e-26 | 231 |
| GO:0032386111 | Thyroid | PTC | regulation of intracellular transport | 202/5968 | 337/18723 | 1.12e-26 | 3.93e-24 | 202 |
| GO:1903362113 | Thyroid | PTC | regulation of cellular protein catabolic process | 162/5968 | 255/18723 | 1.62e-25 | 5.12e-23 | 162 |
| GO:1903050113 | Thyroid | PTC | regulation of proteolysis involved in cellular protein catabolic process | 140/5968 | 221/18723 | 4.63e-22 | 1.01e-19 | 140 |
| GO:0031647113 | Thyroid | PTC | regulation of protein stability | 174/5968 | 298/18723 | 2.05e-21 | 4.05e-19 | 174 |
| GO:2000058113 | Thyroid | PTC | regulation of ubiquitin-dependent protein catabolic process | 110/5968 | 164/18723 | 1.83e-20 | 2.97e-18 | 110 |
| GO:0061136113 | Thyroid | PTC | regulation of proteasomal protein catabolic process | 121/5968 | 187/18723 | 2.25e-20 | 3.37e-18 | 121 |
| GO:0032434113 | Thyroid | PTC | regulation of proteasomal ubiquitin-dependent protein catabolic process | 94/5968 | 134/18723 | 9.17e-20 | 1.23e-17 | 94 |
| GO:001657010 | Thyroid | PTC | histone modification | 235/5968 | 463/18723 | 1.17e-17 | 1.15e-15 | 235 |
| GO:0050821113 | Thyroid | PTC | protein stabilization | 115/5968 | 191/18723 | 5.67e-16 | 4.31e-14 | 115 |
| GO:001619718 | Thyroid | PTC | endosomal transport | 128/5968 | 230/18723 | 6.26e-14 | 3.52e-12 | 128 |
| GO:0072331113 | Thyroid | PTC | signal transduction by p53 class mediator | 92/5968 | 163/18723 | 7.29e-11 | 2.54e-09 | 92 |
| GO:003304419 | Thyroid | PTC | regulation of chromosome organization | 102/5968 | 187/18723 | 1.04e-10 | 3.58e-09 | 102 |
| GO:005105218 | Thyroid | PTC | regulation of DNA metabolic process | 171/5968 | 359/18723 | 2.52e-10 | 8.33e-09 | 171 |
| GO:001648217 | Thyroid | PTC | cytosolic transport | 92/5968 | 168/18723 | 6.41e-10 | 1.97e-08 | 92 |
| GO:0031330113 | Thyroid | PTC | negative regulation of cellular catabolic process | 131/5968 | 262/18723 | 6.63e-10 | 2.03e-08 | 131 |
| GO:0009895113 | Thyroid | PTC | negative regulation of catabolic process | 154/5968 | 320/18723 | 7.77e-10 | 2.31e-08 | 154 |
| GO:0032204110 | Thyroid | PTC | regulation of telomere maintenance | 52/5968 | 80/18723 | 1.15e-09 | 3.34e-08 | 52 |
| Page: 1 2 3 4 5 6 7 8 9 10 11 12 13 14 15 16 17 18 19 20 21 22 23 24 25 26 27 28 29 30 31 32 33 34 |
| Pathway ID | Tissue | Disease Stage | Description | Gene Ratio | Bg Ratio | pvalue | p.adjust | qvalue | Count |
| hsa05169 | Colorectum | MSS | Epstein-Barr virus infection | 63/1875 | 202/8465 | 1.63e-03 | 8.98e-03 | 5.50e-03 | 63 |
| hsa051691 | Colorectum | MSS | Epstein-Barr virus infection | 63/1875 | 202/8465 | 1.63e-03 | 8.98e-03 | 5.50e-03 | 63 |
| hsa05169210 | Esophagus | ESCC | Epstein-Barr virus infection | 151/4205 | 202/8465 | 1.55e-13 | 3.45e-12 | 1.77e-12 | 151 |
| hsa0520325 | Esophagus | ESCC | Viral carcinogenesis | 137/4205 | 204/8465 | 2.47e-07 | 1.88e-06 | 9.62e-07 | 137 |
| hsa040689 | Esophagus | ESCC | FoxO signaling pathway | 89/4205 | 131/8465 | 1.56e-05 | 7.98e-05 | 4.09e-05 | 89 |
| hsa0516937 | Esophagus | ESCC | Epstein-Barr virus infection | 151/4205 | 202/8465 | 1.55e-13 | 3.45e-12 | 1.77e-12 | 151 |
| hsa0520335 | Esophagus | ESCC | Viral carcinogenesis | 137/4205 | 204/8465 | 2.47e-07 | 1.88e-06 | 9.62e-07 | 137 |
| hsa0406814 | Esophagus | ESCC | FoxO signaling pathway | 89/4205 | 131/8465 | 1.56e-05 | 7.98e-05 | 4.09e-05 | 89 |
| hsa0516921 | Liver | HCC | Epstein-Barr virus infection | 128/4020 | 202/8465 | 3.17e-06 | 2.79e-05 | 1.55e-05 | 128 |
| hsa040684 | Liver | HCC | FoxO signaling pathway | 85/4020 | 131/8465 | 3.99e-05 | 2.16e-04 | 1.20e-04 | 85 |
| hsa052032 | Liver | HCC | Viral carcinogenesis | 117/4020 | 204/8465 | 2.68e-03 | 8.98e-03 | 5.00e-03 | 117 |
| hsa0516931 | Liver | HCC | Epstein-Barr virus infection | 128/4020 | 202/8465 | 3.17e-06 | 2.79e-05 | 1.55e-05 | 128 |
| hsa040685 | Liver | HCC | FoxO signaling pathway | 85/4020 | 131/8465 | 3.99e-05 | 2.16e-04 | 1.20e-04 | 85 |
| hsa052033 | Liver | HCC | Viral carcinogenesis | 117/4020 | 204/8465 | 2.68e-03 | 8.98e-03 | 5.00e-03 | 117 |
| hsa0516928 | Oral cavity | OSCC | Epstein-Barr virus infection | 144/3704 | 202/8465 | 1.08e-15 | 3.60e-14 | 1.83e-14 | 144 |
| hsa052038 | Oral cavity | OSCC | Viral carcinogenesis | 124/3704 | 204/8465 | 5.57e-07 | 3.28e-06 | 1.67e-06 | 124 |
| hsa040688 | Oral cavity | OSCC | FoxO signaling pathway | 85/3704 | 131/8465 | 7.50e-07 | 4.33e-06 | 2.21e-06 | 85 |
| hsa05169113 | Oral cavity | OSCC | Epstein-Barr virus infection | 144/3704 | 202/8465 | 1.08e-15 | 3.60e-14 | 1.83e-14 | 144 |
| hsa0520314 | Oral cavity | OSCC | Viral carcinogenesis | 124/3704 | 204/8465 | 5.57e-07 | 3.28e-06 | 1.67e-06 | 124 |
| hsa0406813 | Oral cavity | OSCC | FoxO signaling pathway | 85/3704 | 131/8465 | 7.50e-07 | 4.33e-06 | 2.21e-06 | 85 |
| Page: 1 2 |
Top |
Cell-cell communication analysis |
| Identification of potential cell-cell interactions between two cell types and their ligand-receptor pairs for different disease states |
| Ligand | Receptor | LRpair | Pathway | Tissue | Disease Stage |
| Page: 1 |
Top |
Single-cell gene regulatory network inference analysis |
| Find out the significant the regulons (TFs) and the target genes of each regulon across cell types for different disease states |
| TF | Cell Type | Tissue | Disease Stage | Target Gene | RSS | Regulon Activity |
| ∗The dot plots of a searched regulon are shown for all cell subpopulations in each disease state of each tissue based on the regulon specific score inferred using pySCENIC and by calculating the average expression. |
| Page: 1 |
Top |
Somatic mutation of malignant transformation related genes |
| Annotation of somatic variants for genes involved in malignant transformation |
| Hugo Symbol | Variant Class | Variant Classification | dbSNP RS | HGVSc | HGVSp | HGVSp Short | SWISSPROT | BIOTYPE | SIFT | PolyPhen | Tumor Sample Barcode | Tissue | Histology | Sex | Age | Stage | Therapy Types | Drugs | Outcome |
| USP7 | SNV | Missense_Mutation | novel | c.2788N>C | p.Glu930Gln | p.E930Q | Q93009 | protein_coding | tolerated(0.24) | benign(0.022) | TCGA-5L-AAT1-01 | Breast | breast invasive carcinoma | Female | <65 | III/IV | Hormone Therapy | letrozol | SD |
| USP7 | SNV | Missense_Mutation | novel | c.598N>G | p.Pro200Ala | p.P200A | Q93009 | protein_coding | deleterious(0) | probably_damaging(0.971) | TCGA-5L-AAT1-01 | Breast | breast invasive carcinoma | Female | <65 | III/IV | Hormone Therapy | letrozol | SD |
| USP7 | SNV | Missense_Mutation | c.2941N>C | p.Asp981His | p.D981H | Q93009 | protein_coding | tolerated(0.12) | benign(0.001) | TCGA-A8-A085-01 | Breast | breast invasive carcinoma | Male | <65 | I/II | Hormone Therapy | tamoxiphen | SD | |
| USP7 | SNV | Missense_Mutation | c.1223N>A | p.Arg408Lys | p.R408K | Q93009 | protein_coding | deleterious(0.01) | probably_damaging(1) | TCGA-AC-A23H-01 | Breast | breast invasive carcinoma | Female | >=65 | I/II | Unknown | Unknown | PD | |
| USP7 | SNV | Missense_Mutation | novel | c.913G>A | p.Asp305Asn | p.D305N | Q93009 | protein_coding | deleterious(0) | probably_damaging(0.916) | TCGA-AN-A046-01 | Breast | breast invasive carcinoma | Female | >=65 | I/II | Unknown | Unknown | SD |
| USP7 | SNV | Missense_Mutation | c.2317N>T | p.Pro773Ser | p.P773S | Q93009 | protein_coding | tolerated(0.72) | benign(0.036) | TCGA-AN-A04A-01 | Breast | breast invasive carcinoma | Female | <65 | III/IV | Unknown | Unknown | SD | |
| USP7 | SNV | Missense_Mutation | c.3011G>A | p.Gly1004Glu | p.G1004E | Q93009 | protein_coding | deleterious(0) | probably_damaging(1) | TCGA-D8-A1JN-01 | Breast | breast invasive carcinoma | Female | >=65 | III/IV | Hormone Therapy | anastrozolum | SD | |
| USP7 | SNV | Missense_Mutation | novel | c.556N>A | p.Asp186Asn | p.D186N | Q93009 | protein_coding | tolerated(0.41) | benign(0.1) | TCGA-D8-A1XJ-01 | Breast | breast invasive carcinoma | Female | >=65 | III/IV | Hormone Therapy | tamoxiphen | SD |
| USP7 | insertion | Nonsense_Mutation | novel | c.464_465insGTTTTCAATCTAAGT | p.Ser155delinsArgPheSerIleTerVal | p.S155delinsRFSI*V | Q93009 | protein_coding | TCGA-A8-A08H-01 | Breast | breast invasive carcinoma | Female | >=65 | I/II | Unknown | Unknown | SD | ||
| USP7 | deletion | Frame_Shift_Del | novel | c.1939delA | p.Thr647GlnfsTer2 | p.T647Qfs*2 | Q93009 | protein_coding | TCGA-D8-A27V-01 | Breast | breast invasive carcinoma | Female | <65 | I/II | Hormone Therapy | tamoxiphen | SD |
| Page: 1 2 3 4 5 6 7 8 9 10 11 12 13 |
Top |
Related drugs of malignant transformation related genes |
| Identification of chemicals and drugs interact with genes involved in malignant transfromation |
| (DGIdb 4.0) |
| Entrez ID | Symbol | Category | Interaction Types | Drug Claim Name | Drug Name | PMIDs |
| 7874 | USP7 | DRUGGABLE GENOME, TRANSCRIPTION FACTOR, ENZYME, PROTEASE | PMID26077642-Compound-Vif1 | |||
| 7874 | USP7 | DRUGGABLE GENOME, TRANSCRIPTION FACTOR, ENZYME, PROTEASE | PMID26077642-Compound-Vif2 |
| Page: 1 |

Copyright 2023-Present -The University of Texas Health Science Center at Houston |