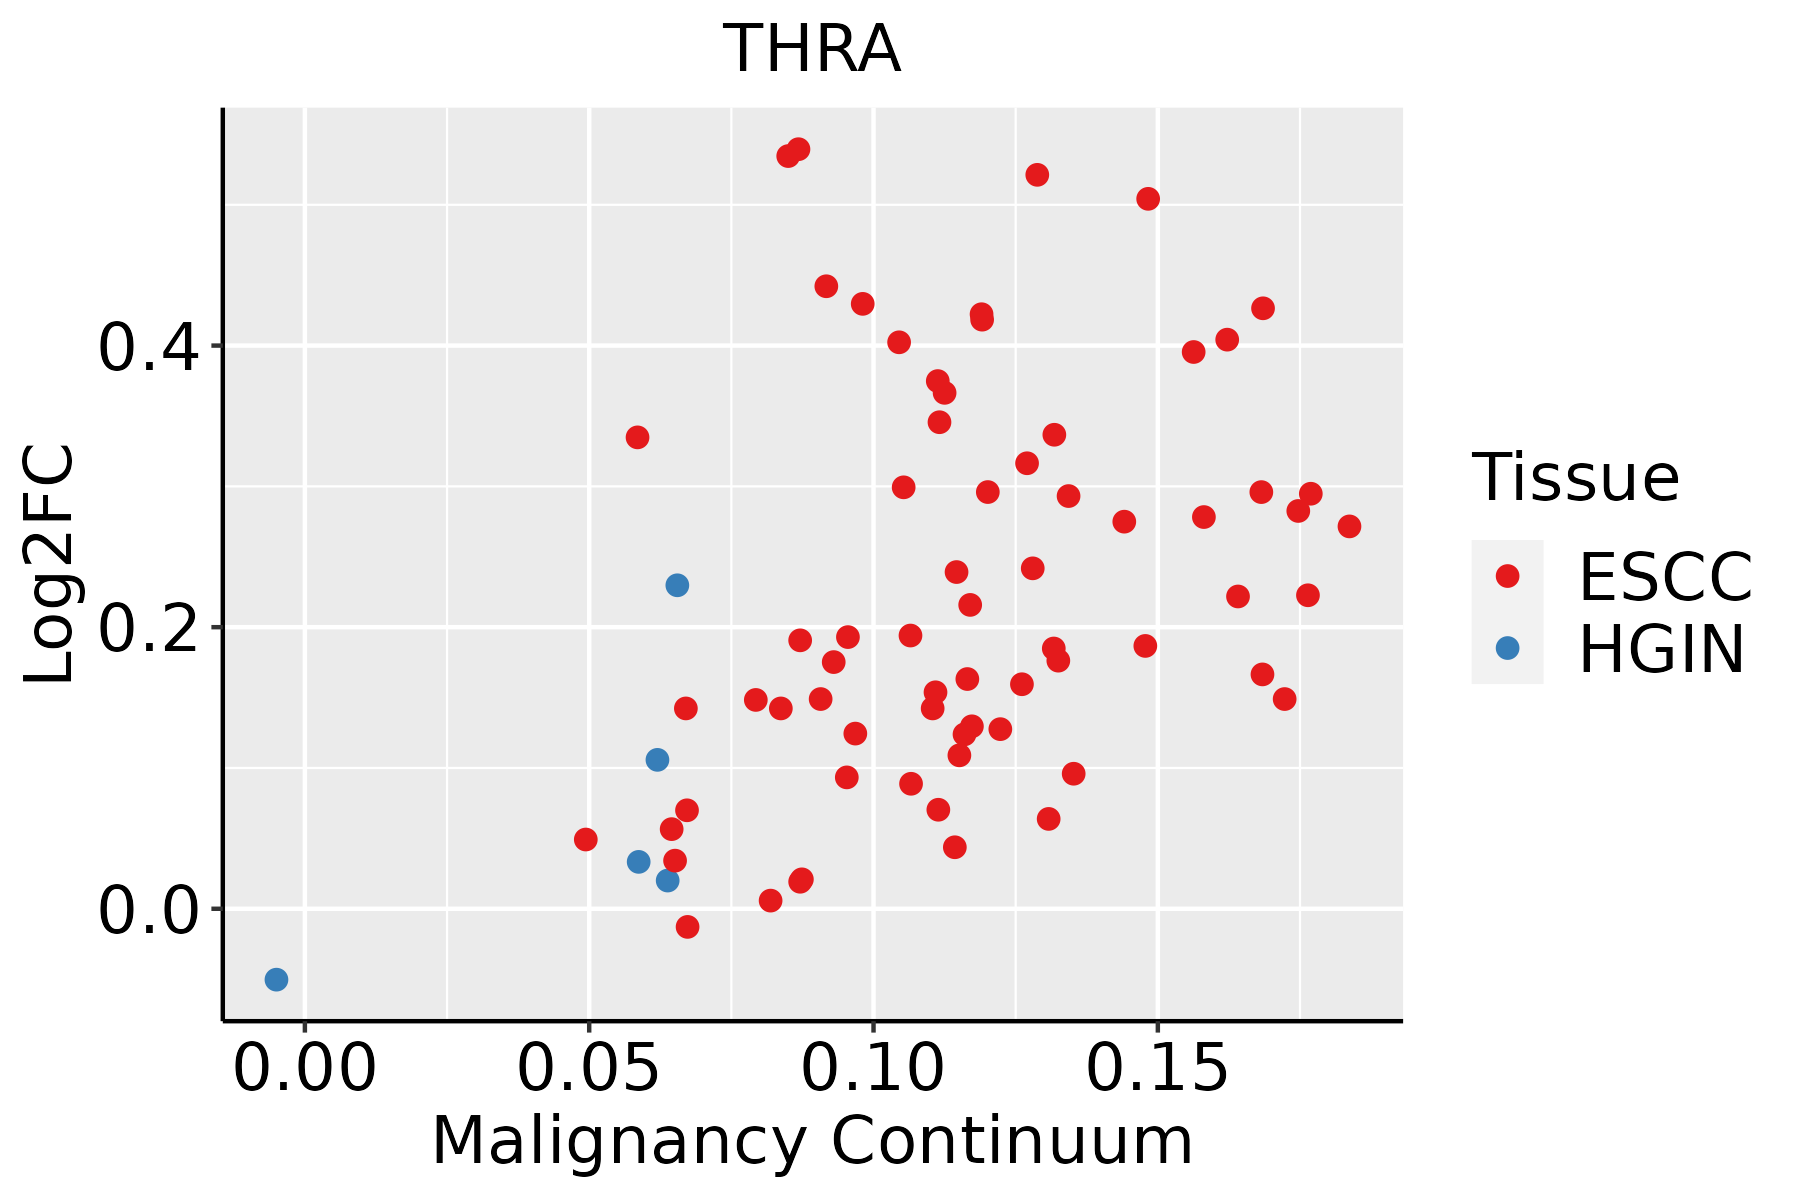
| Tissue | Expression Dynamics | Abbreviation |
| Colorectum (GSE201348) |  | FAP: Familial adenomatous polyposis |
| CRC: Colorectal cancer |
| Colorectum (HTA11) |  | AD: Adenomas |
| SER: Sessile serrated lesions |
| MSI-H: Microsatellite-high colorectal cancer |
| MSS: Microsatellite stable colorectal cancer |
| Esophagus |  | ESCC: Esophageal squamous cell carcinoma |
| HGIN: High-grade intraepithelial neoplasias |
| LGIN: Low-grade intraepithelial neoplasias |
| Liver |  | HCC: Hepatocellular carcinoma |
| NAFLD: Non-alcoholic fatty liver disease |
| GO ID | Tissue | Disease Stage | Description | Gene Ratio | Bg Ratio | pvalue | p.adjust | Count |
| GO:004802616 | Oral cavity | LP | positive regulation of mRNA splicing, via spliceosome | 14/4623 | 22/18723 | 1.23e-04 | 1.44e-03 | 14 |
| GO:006101317 | Oral cavity | LP | regulation of mRNA catabolic process | 62/4623 | 166/18723 | 1.87e-04 | 2.06e-03 | 62 |
| GO:004348717 | Oral cavity | LP | regulation of RNA stability | 62/4623 | 170/18723 | 3.94e-04 | 3.82e-03 | 62 |
| GO:000038117 | Oral cavity | LP | regulation of alternative mRNA splicing, via spliceosome | 27/4623 | 60/18723 | 4.71e-04 | 4.43e-03 | 27 |
| GO:004348817 | Oral cavity | LP | regulation of mRNA stability | 58/4623 | 158/18723 | 4.93e-04 | 4.62e-03 | 58 |
| GO:190236914 | Oral cavity | LP | negative regulation of RNA catabolic process | 29/4623 | 75/18723 | 5.06e-03 | 3.15e-02 | 29 |
| GO:190331124 | Oral cavity | EOLP | regulation of mRNA metabolic process | 102/2218 | 288/18723 | 8.13e-26 | 2.44e-22 | 102 |
| GO:004348426 | Oral cavity | EOLP | regulation of RNA splicing | 59/2218 | 148/18723 | 2.64e-18 | 5.27e-15 | 59 |
| GO:000838025 | Oral cavity | EOLP | RNA splicing | 115/2218 | 434/18723 | 2.24e-17 | 3.04e-14 | 115 |
| GO:005068424 | Oral cavity | EOLP | regulation of mRNA processing | 55/2218 | 137/18723 | 2.54e-17 | 3.04e-14 | 55 |
| GO:000640224 | Oral cavity | EOLP | mRNA catabolic process | 74/2218 | 232/18723 | 3.36e-16 | 2.51e-13 | 74 |
| GO:004802425 | Oral cavity | EOLP | regulation of mRNA splicing, via spliceosome | 42/2218 | 101/18723 | 3.41e-14 | 1.28e-11 | 42 |
| GO:006101323 | Oral cavity | EOLP | regulation of mRNA catabolic process | 55/2218 | 166/18723 | 3.70e-13 | 1.11e-10 | 55 |
| GO:000640124 | Oral cavity | EOLP | RNA catabolic process | 77/2218 | 278/18723 | 3.92e-13 | 1.12e-10 | 77 |
| GO:004348823 | Oral cavity | EOLP | regulation of mRNA stability | 50/2218 | 158/18723 | 2.91e-11 | 4.15e-09 | 50 |
| GO:000037725 | Oral cavity | EOLP | RNA splicing, via transesterification reactions with bulged adenosine as nucleophile | 80/2218 | 320/18723 | 4.20e-11 | 5.60e-09 | 80 |
| GO:000039825 | Oral cavity | EOLP | mRNA splicing, via spliceosome | 80/2218 | 320/18723 | 4.20e-11 | 5.60e-09 | 80 |
| GO:000037525 | Oral cavity | EOLP | RNA splicing, via transesterification reactions | 80/2218 | 324/18723 | 8.11e-11 | 9.53e-09 | 80 |
| GO:004348723 | Oral cavity | EOLP | regulation of RNA stability | 51/2218 | 170/18723 | 1.63e-10 | 1.68e-08 | 51 |
| GO:190331323 | Oral cavity | EOLP | positive regulation of mRNA metabolic process | 40/2218 | 118/18723 | 2.69e-10 | 2.45e-08 | 40 |
| Pathway ID | Tissue | Disease Stage | Description | Gene Ratio | Bg Ratio | pvalue | p.adjust | qvalue | Count |
| hsa04919 | Colorectum | AD | Thyroid hormone signaling pathway | 51/2092 | 121/8465 | 1.71e-05 | 1.73e-04 | 1.10e-04 | 51 |
| hsa049191 | Colorectum | AD | Thyroid hormone signaling pathway | 51/2092 | 121/8465 | 1.71e-05 | 1.73e-04 | 1.10e-04 | 51 |
| hsa049192 | Colorectum | SER | Thyroid hormone signaling pathway | 40/1580 | 121/8465 | 1.02e-04 | 1.06e-03 | 7.67e-04 | 40 |
| hsa049193 | Colorectum | SER | Thyroid hormone signaling pathway | 40/1580 | 121/8465 | 1.02e-04 | 1.06e-03 | 7.67e-04 | 40 |
| hsa049194 | Colorectum | MSS | Thyroid hormone signaling pathway | 46/1875 | 121/8465 | 5.04e-05 | 4.97e-04 | 3.05e-04 | 46 |
| hsa049195 | Colorectum | MSS | Thyroid hormone signaling pathway | 46/1875 | 121/8465 | 5.04e-05 | 4.97e-04 | 3.05e-04 | 46 |
| hsa0491928 | Esophagus | ESCC | Thyroid hormone signaling pathway | 78/4205 | 121/8465 | 6.79e-04 | 2.23e-03 | 1.14e-03 | 78 |
| hsa04919113 | Esophagus | ESCC | Thyroid hormone signaling pathway | 78/4205 | 121/8465 | 6.79e-04 | 2.23e-03 | 1.14e-03 | 78 |
| hsa0491912 | Liver | HCC | Thyroid hormone signaling pathway | 75/4020 | 121/8465 | 8.76e-04 | 3.38e-03 | 1.88e-03 | 75 |
| hsa0491913 | Liver | HCC | Thyroid hormone signaling pathway | 75/4020 | 121/8465 | 8.76e-04 | 3.38e-03 | 1.88e-03 | 75 |
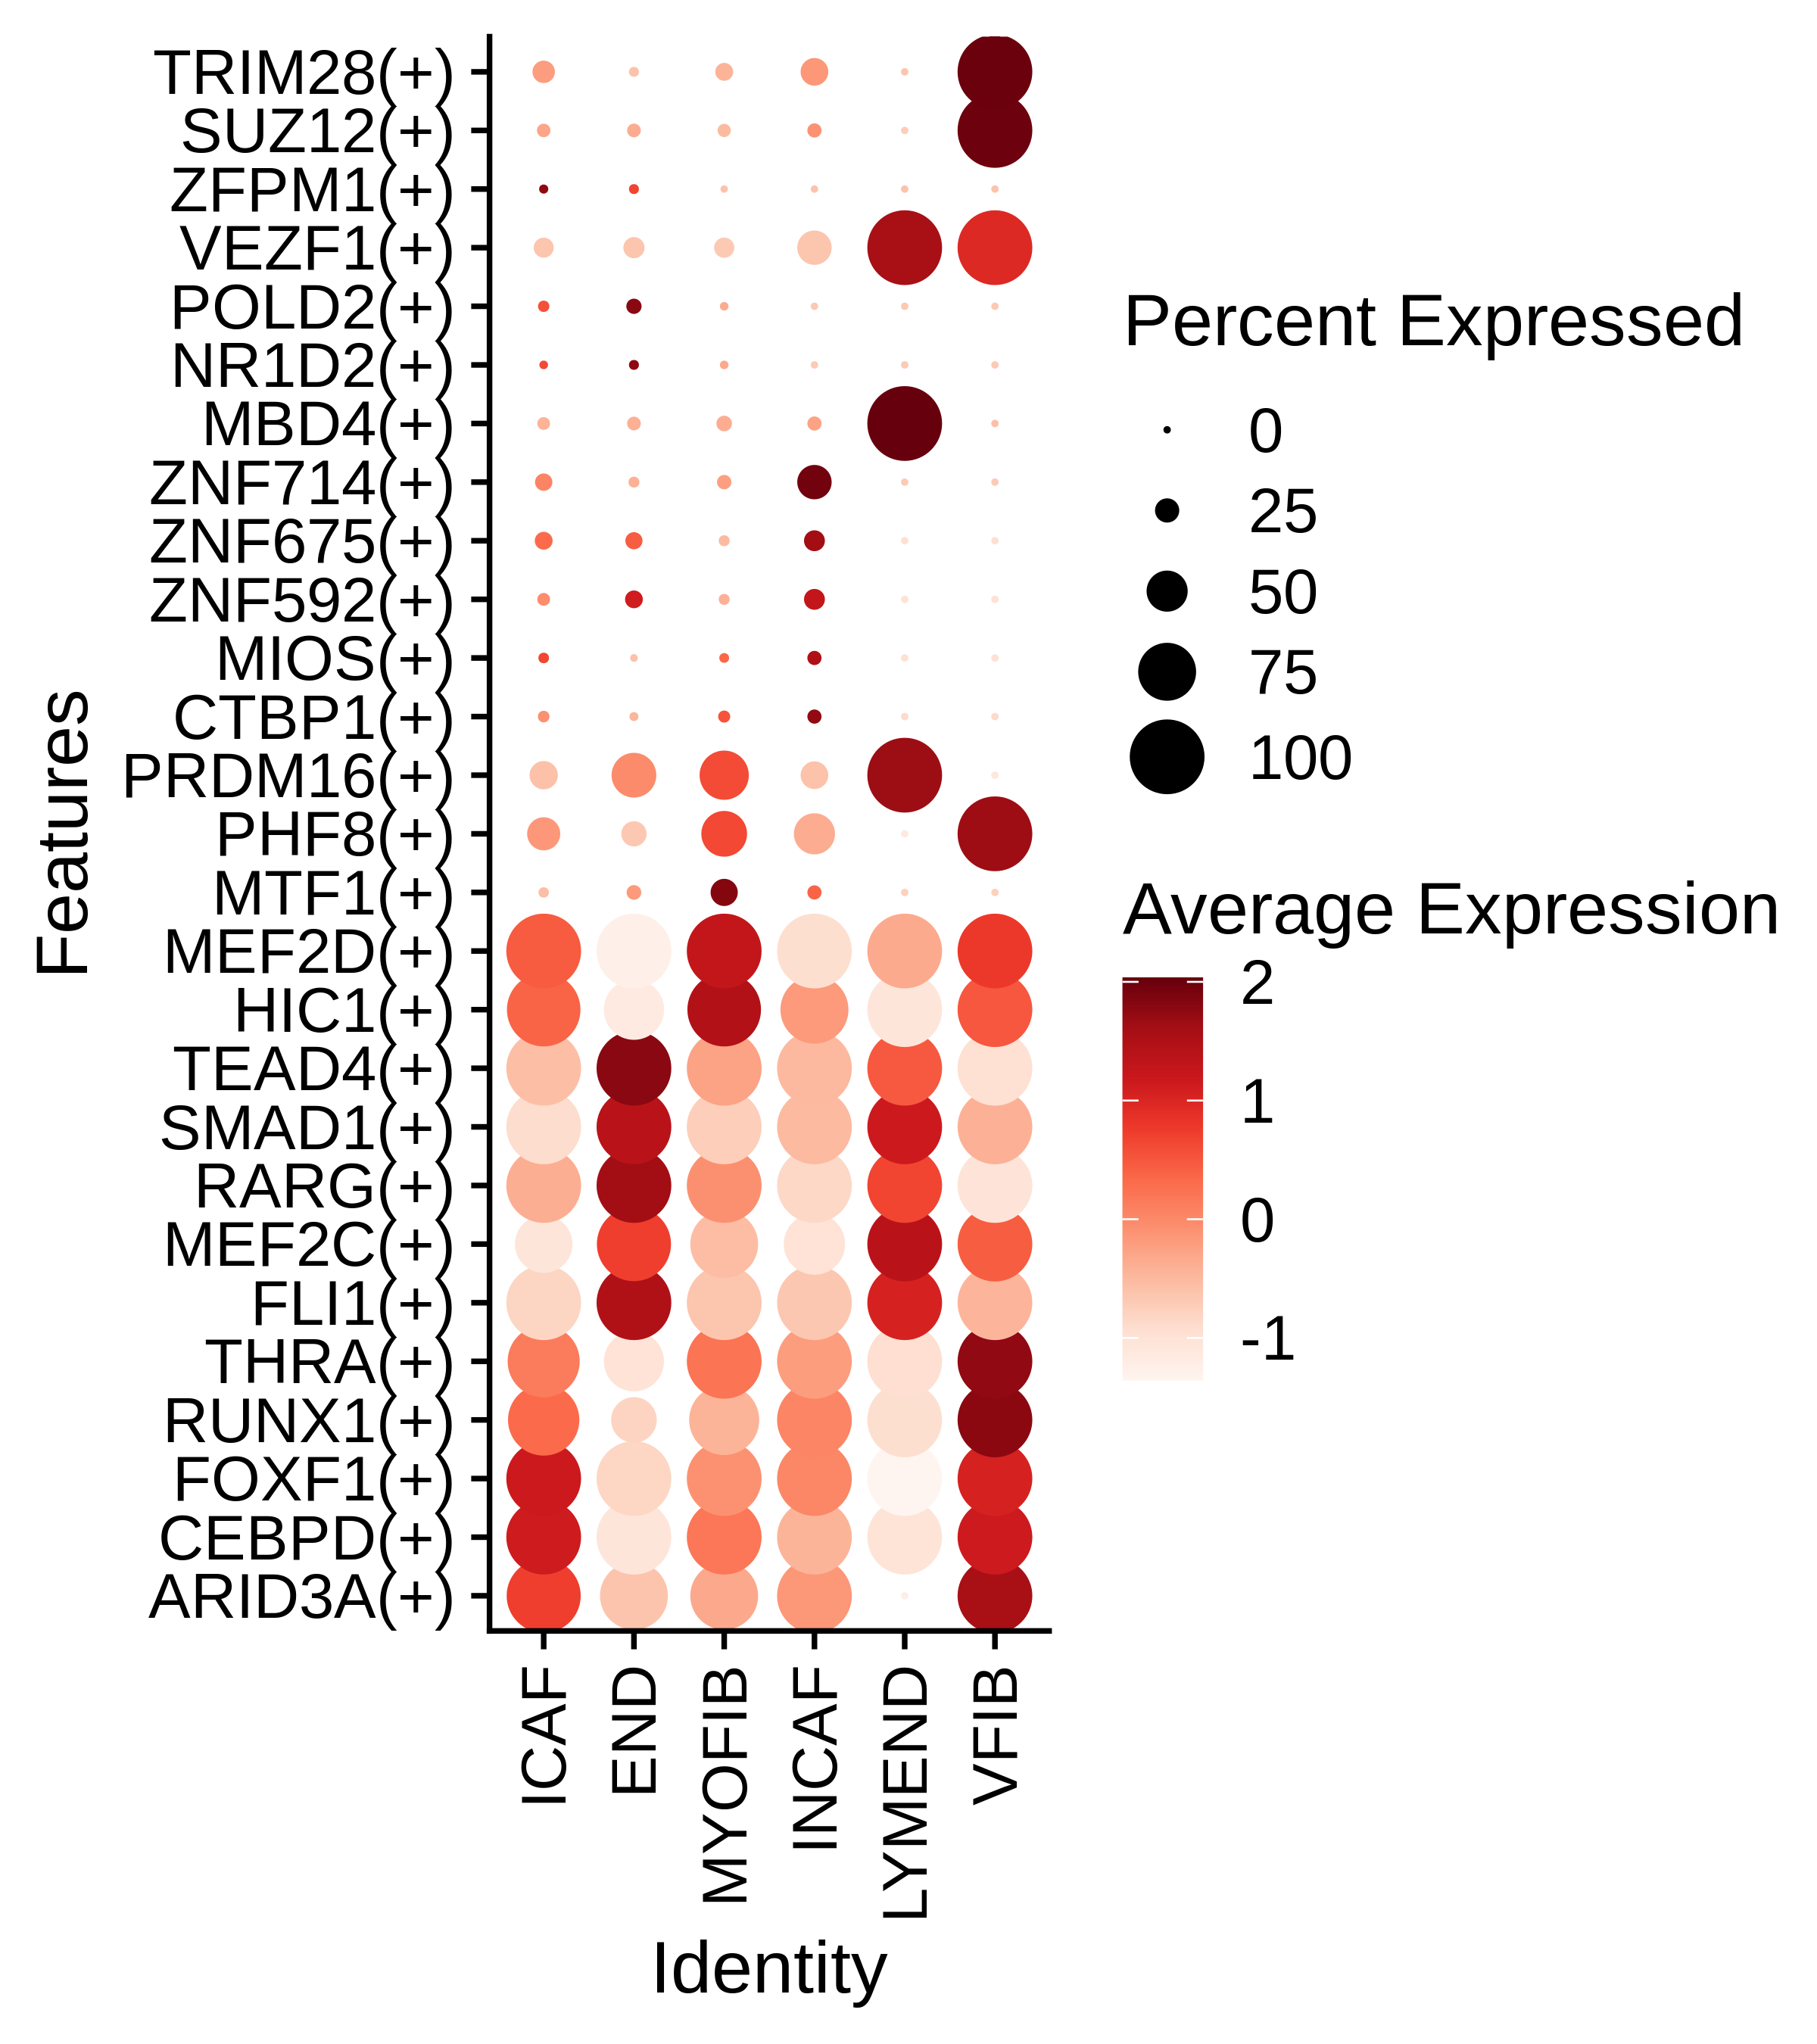
| TF | Cell Type | Tissue | Disease Stage | Target Gene | RSS | Regulon Activity |
| THRA | CD8TEXINT | Colorectum | ADJ | SEMA3C,AGPAT4,NCEH1, etc. | 1.08e-01 |  |
| THRA | INCAF | Colorectum | CRC | RABL2B,NDUFAF6,PIGN, etc. | 4.72e-01 |  |
| THRA | ICAF | Colorectum | MSS | RABL2B,NDUFAF6,PIGN, etc. | 5.18e-01 |  |
| THRA | M1MAC | Endometrium | Healthy | USF1,ZNF483,AL356234.2, etc. | 4.31e-01 |  |
| THRA | SMC | Endometrium | ADJ | GUCY1A3,BRSK2,AC097724.3, etc. | 2.73e-01 |  |
| THRA | SMC | Endometrium | AEH | GUCY1A3,BRSK2,AC097724.3, etc. | 1.94e-01 |  |
| THRA | PERI | Liver | Cirrhotic | BAMBI,C2orf40,C15orf39, etc. | 1.40e-01 |  |
| THRA | SMC | Liver | Cirrhotic | BAMBI,C2orf40,C15orf39, etc. | 1.58e-01 |  |
| THRA | SMC | Liver | HCC | BAMBI,C2orf40,C15orf39, etc. | 3.49e-01 |  |
| THRA | CD8TEREX | Lung | MIAC | PLPP3,ZNF683,TRAF3IP2-AS1, etc. | 4.57e-02 |  |
| Hugo Symbol | Variant Class | Variant Classification | dbSNP RS | HGVSc | HGVSp | HGVSp Short | SWISSPROT | BIOTYPE | SIFT | PolyPhen | Tumor Sample Barcode | Tissue | Histology | Sex | Age | Stage | Therapy Types | Drugs | Outcome |
| THRA | SNV | Missense_Mutation | novel | c.1007N>G | p.Asp336Gly | p.D336G | P10827 | protein_coding | tolerated(0.13) | benign(0.133) | TCGA-A8-A07U-01 | Breast | breast invasive carcinoma | Female | >=65 | III/IV | Chemotherapy | 5-fluorouracil | SD |
| THRA | SNV | Missense_Mutation | novel | c.612N>T | p.Met204Ile | p.M204I | P10827 | protein_coding | tolerated(0.23) | benign(0.155) | TCGA-AC-A6IW-01 | Breast | breast invasive carcinoma | Female | >=65 | I/II | Unknown | Unknown | SD |
| THRA | SNV | Missense_Mutation | | c.32N>T | p.Gly11Val | p.G11V | P10827 | protein_coding | deleterious_low_confidence(0.01) | benign(0.08) | TCGA-E2-A14V-01 | Breast | breast invasive carcinoma | Female | <65 | I/II | Chemotherapy | cyclophosphamide | SD |
| THRA | insertion | In_Frame_Ins | novel | c.878_879insAAGGTCTGGCTGCTCTAAGAAATCAGC | p.Gly293_Val294insArgSerGlyCysSerLysLysSerAla | p.G293_V294insRSGCSKKSA | P10827 | protein_coding | | | TCGA-AN-A04A-01 | Breast | breast invasive carcinoma | Female | <65 | III/IV | Unknown | Unknown | SD |
| THRA | SNV | Missense_Mutation | | c.1175N>T | p.Ser392Leu | p.S392L | P10827 | protein_coding | deleterious_low_confidence(0) | benign(0.039) | TCGA-EK-A2H0-01 | Cervix | cervical & endocervical cancer | Female | <65 | I/II | Chemotherapy | cisplatin | CR |
| THRA | SNV | Missense_Mutation | | c.1175N>T | p.Ser392Leu | p.S392L | P10827 | protein_coding | deleterious_low_confidence(0) | benign(0.039) | TCGA-ZJ-A8QQ-01 | Cervix | cervical & endocervical cancer | Female | <65 | I/II | Chemotherapy | cisplatin | SD |
| THRA | SNV | Missense_Mutation | | c.871G>A | p.Gly291Ser | p.G291S | P10827 | protein_coding | deleterious(0.04) | probably_damaging(0.964) | TCGA-AA-3821-01 | Colorectum | colon adenocarcinoma | Female | >=65 | I/II | Unknown | Unknown | SD |
| THRA | SNV | Missense_Mutation | | c.854A>G | p.Glu285Gly | p.E285G | P10827 | protein_coding | tolerated(0.23) | benign(0.012) | TCGA-AA-A010-01 | Colorectum | colon adenocarcinoma | Female | <65 | I/II | Chemotherapy | folinic | CR |
| THRA | SNV | Missense_Mutation | | c.473N>A | p.Pro158Gln | p.P158Q | P10827 | protein_coding | deleterious(0.02) | benign(0.077) | TCGA-DM-A1DA-01 | Colorectum | colon adenocarcinoma | Female | >=65 | III/IV | Unknown | Unknown | SD |
| THRA | SNV | Missense_Mutation | | c.709N>T | p.Pro237Ser | p.P237S | P10827 | protein_coding | deleterious(0.01) | possibly_damaging(0.85) | TCGA-WS-AB45-01 | Colorectum | colon adenocarcinoma | Female | <65 | I/II | Unknown | Unknown | SD |
| Entrez ID | Symbol | Category | Interaction Types | Drug Claim Name | Drug Name | PMIDs |
| 7067 | THRA | DRUGGABLE GENOME, NUCLEAR HORMONE RECEPTOR | | LEVOTHYROXINE | LEVOTHYROXINE | |
| 7067 | THRA | DRUGGABLE GENOME, NUCLEAR HORMONE RECEPTOR | agonist | 135651405 | TIRATRICOL | |
| 7067 | THRA | DRUGGABLE GENOME, NUCLEAR HORMONE RECEPTOR | agonist | 135651574 | LEVOTHYROXINE SODIUM | |
| 7067 | THRA | DRUGGABLE GENOME, NUCLEAR HORMONE RECEPTOR | | Dextrothyroxine Sodium | | |
| 7067 | THRA | DRUGGABLE GENOME, NUCLEAR HORMONE RECEPTOR | agonist | 178103533 | DEXTROTHYROXINE | |
| 7067 | THRA | DRUGGABLE GENOME, NUCLEAR HORMONE RECEPTOR | agonist | 135651573 | LIOTHYRONINE SODIUM | |
| 7067 | THRA | DRUGGABLE GENOME, NUCLEAR HORMONE RECEPTOR | agonist | CHEMBL1544 | LIOTHYRONINE | |
| 7067 | THRA | DRUGGABLE GENOME, NUCLEAR HORMONE RECEPTOR | | tiratricol | TIRATRICOL | |
| 7067 | THRA | DRUGGABLE GENOME, NUCLEAR HORMONE RECEPTOR | | TRIIODOTHYRONINE (T3) | | |
| 7067 | THRA | DRUGGABLE GENOME, NUCLEAR HORMONE RECEPTOR | antagonist | 135650713 | | |


 Identification of the aberrant gene expression in precancerous and cancerous lesions by comparing the gene expression of stem-like cells in diseased tissues with normal stem cells
 Find out the enriched GO biological processes and KEGG pathways involved in transition from healthy to precancer to cancer


 Identification of potential cell-cell interactions between two cell types and their ligand-receptor pairs for different disease states
 Find out the significant the regulons (TFs) and the target genes of each regulon across cell types for different disease states
 Annotation of somatic variants for genes involved in malignant transformation
 Identification of chemicals and drugs interact with genes involved in malignant transfromation


