| Tissue | Expression Dynamics | Abbreviation |
| Cervix | 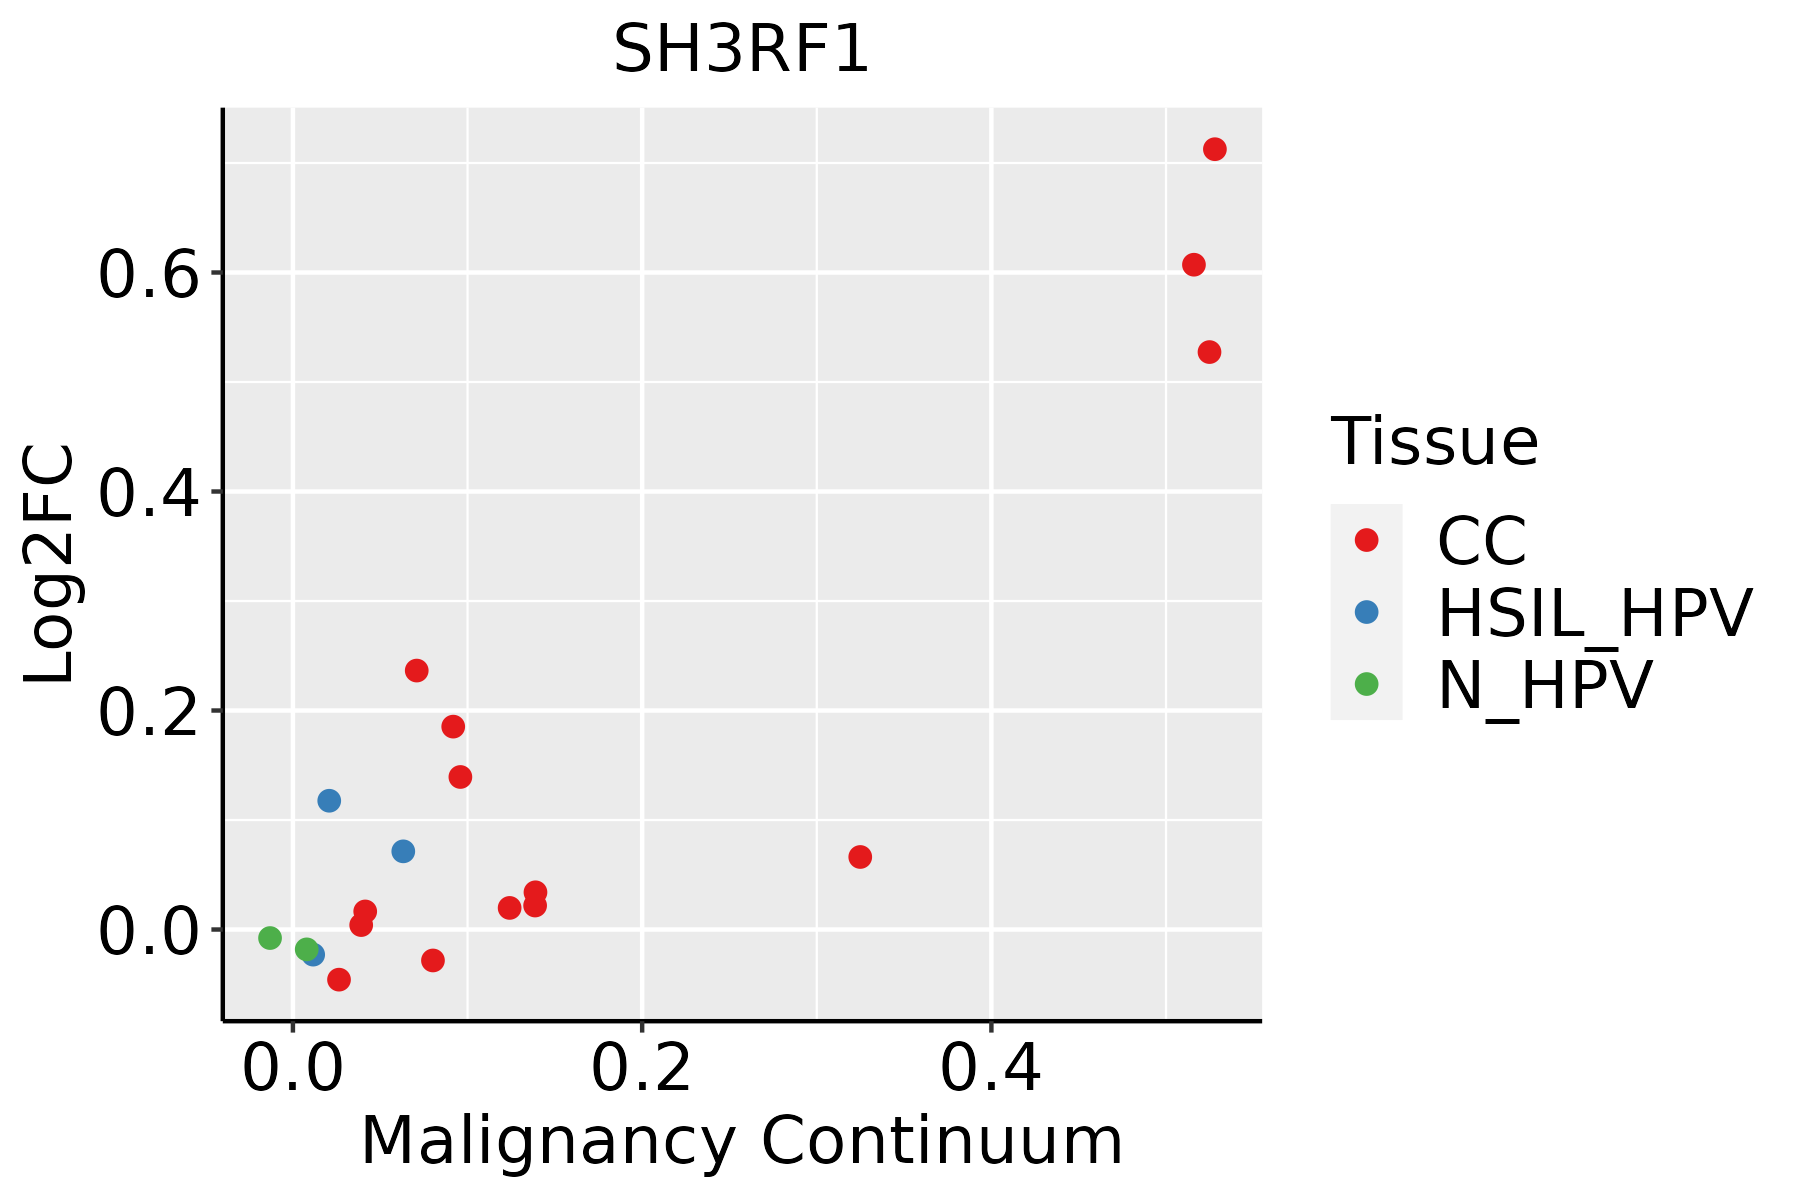 | CC: Cervix cancer |
| HSIL_HPV: HPV-infected high-grade squamous intraepithelial lesions |
| N_HPV: HPV-infected normal cervix |
| Colorectum (GSE201348) |  | FAP: Familial adenomatous polyposis |
| CRC: Colorectal cancer |
| Colorectum (HTA11) |  | AD: Adenomas |
| SER: Sessile serrated lesions |
| MSI-H: Microsatellite-high colorectal cancer |
| MSS: Microsatellite stable colorectal cancer |
| Endometrium | 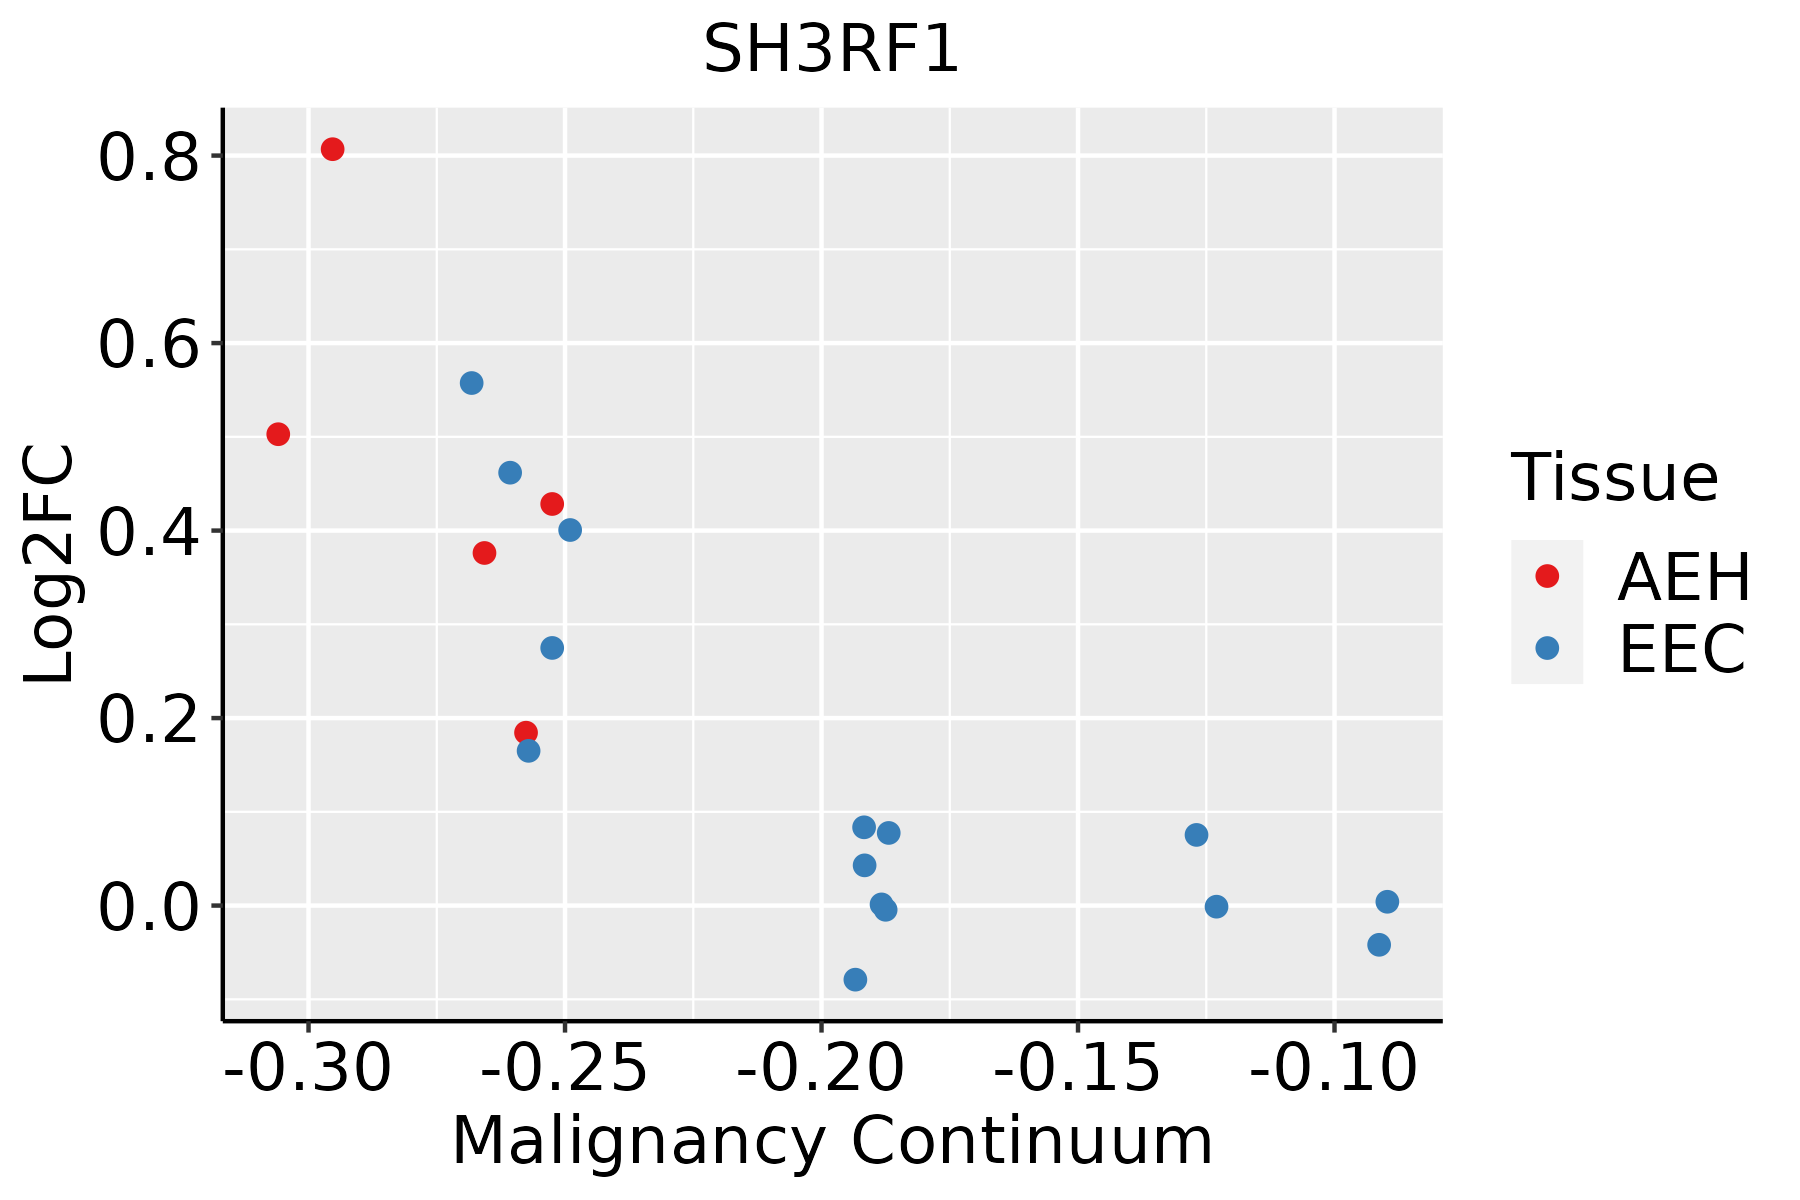 | AEH: Atypical endometrial hyperplasia |
| EEC: Endometrioid Cancer |
| Esophagus |  | ESCC: Esophageal squamous cell carcinoma |
| HGIN: High-grade intraepithelial neoplasias |
| LGIN: Low-grade intraepithelial neoplasias |
| Liver |  | HCC: Hepatocellular carcinoma |
| NAFLD: Non-alcoholic fatty liver disease |
| Lung |  | AAH: Atypical adenomatous hyperplasia |
| AIS: Adenocarcinoma in situ |
| IAC: Invasive lung adenocarcinoma |
| MIA: Minimally invasive adenocarcinoma |
| Prostate | 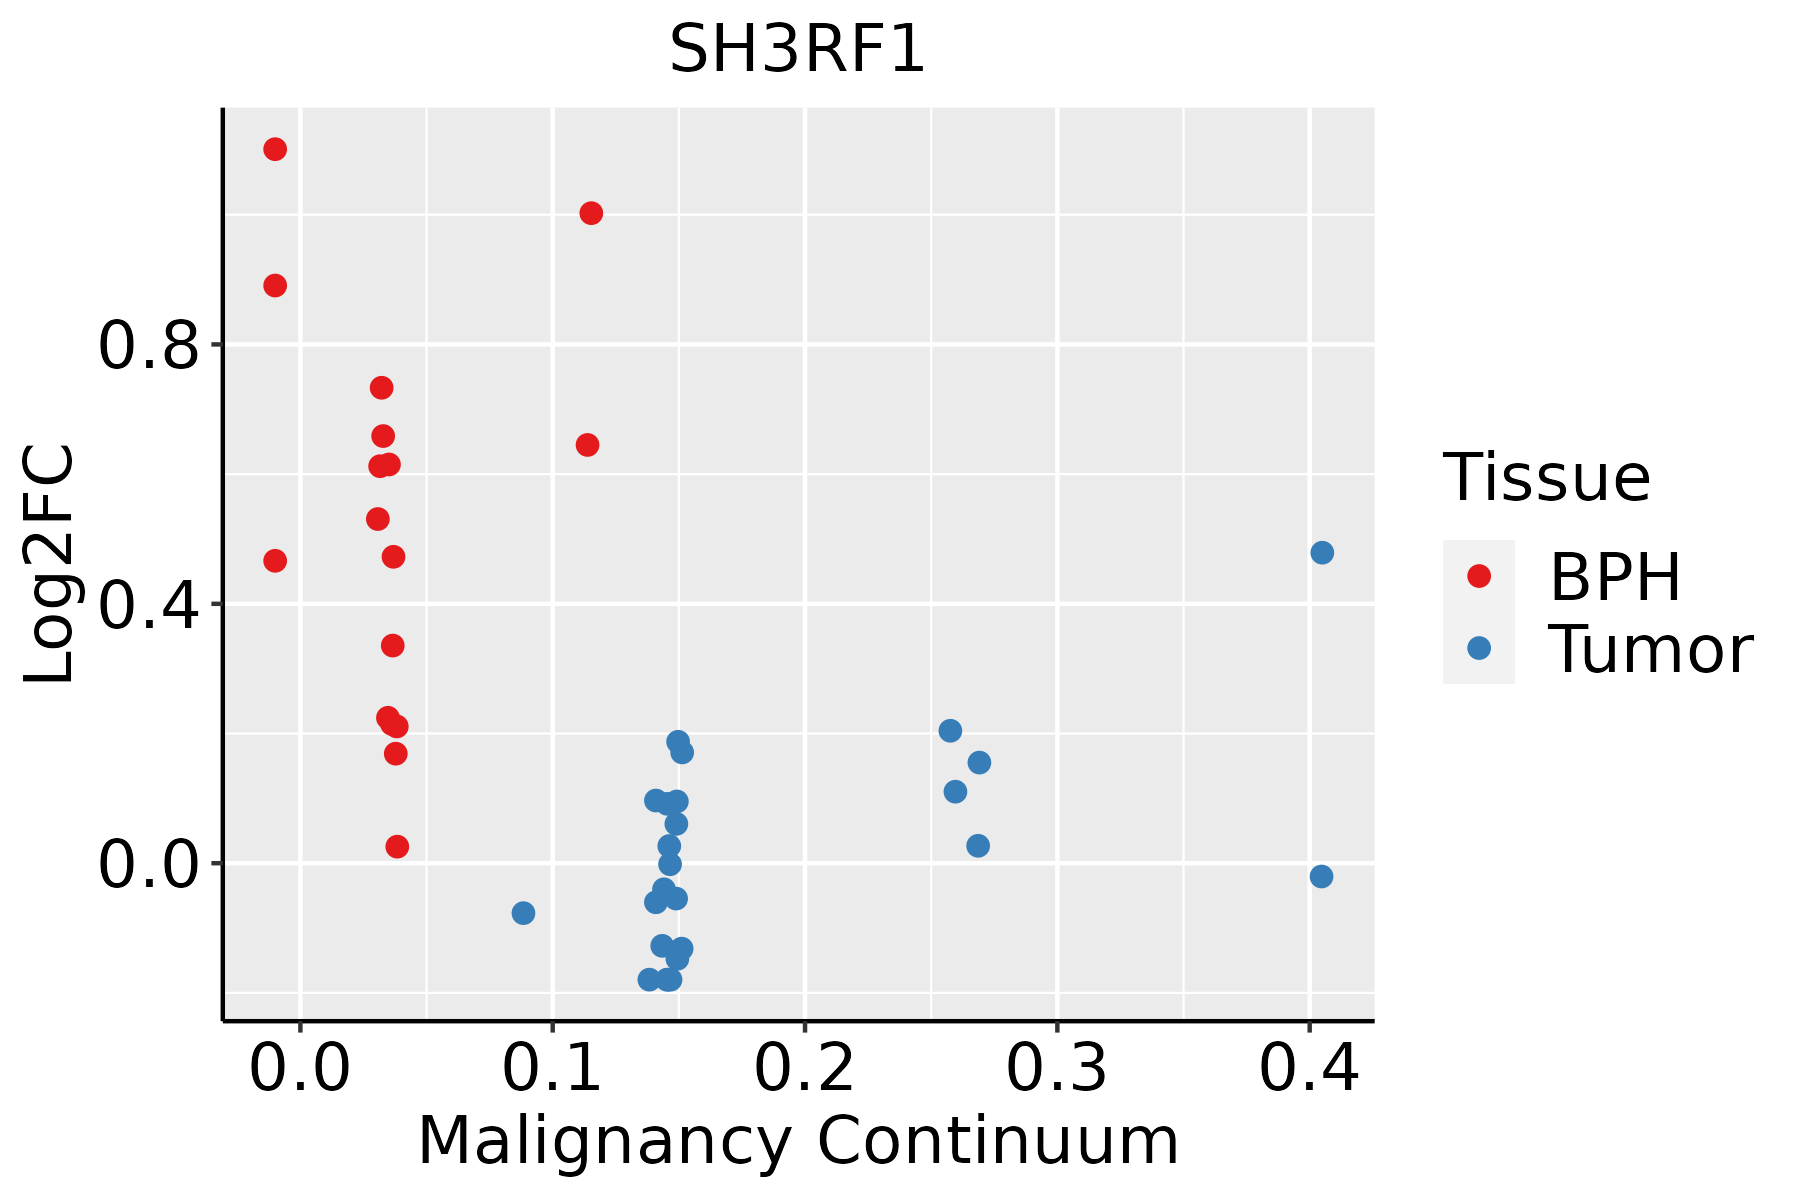 | BPH: Benign Prostatic Hyperplasia |
| Skin | 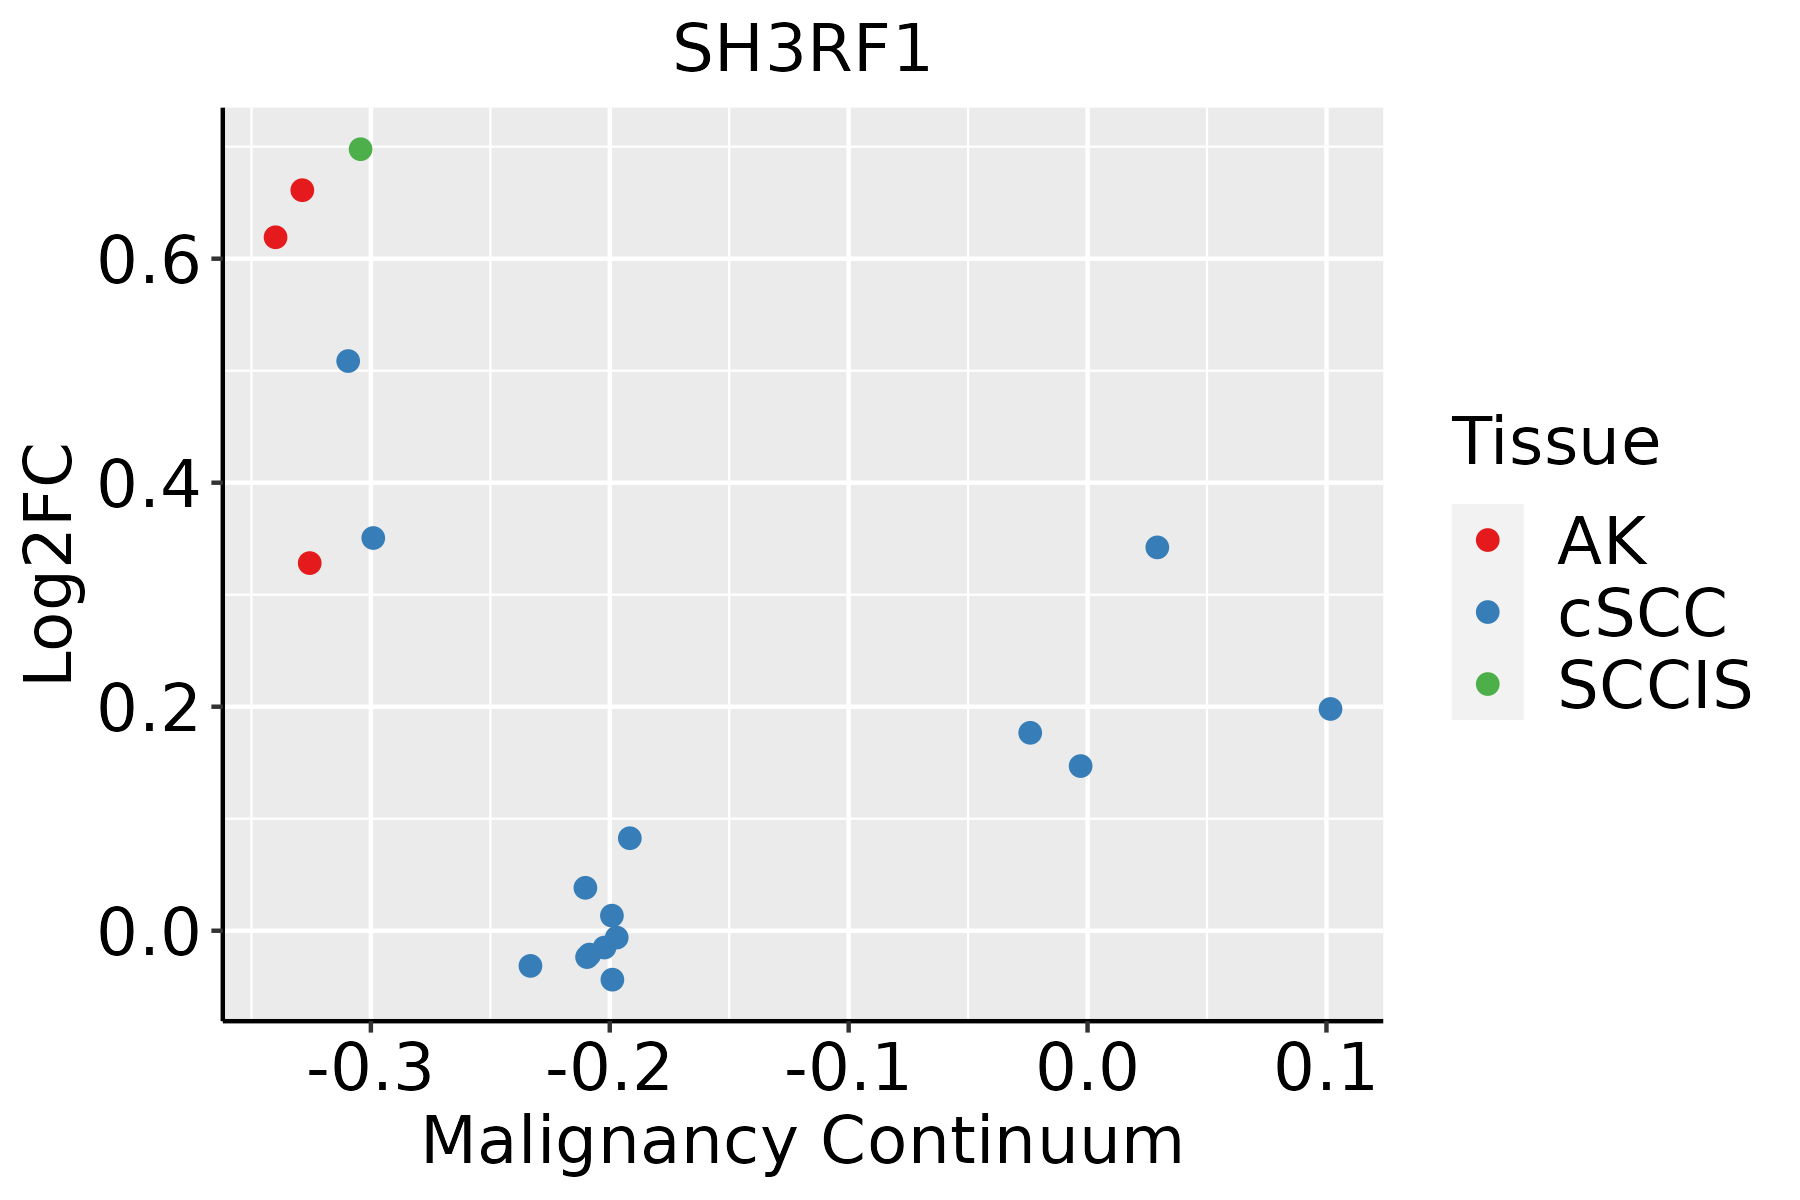 | AK: Actinic keratosis |
| cSCC: Cutaneous squamous cell carcinoma |
| SCCIS:squamous cell carcinoma in situ |
| Thyroid | 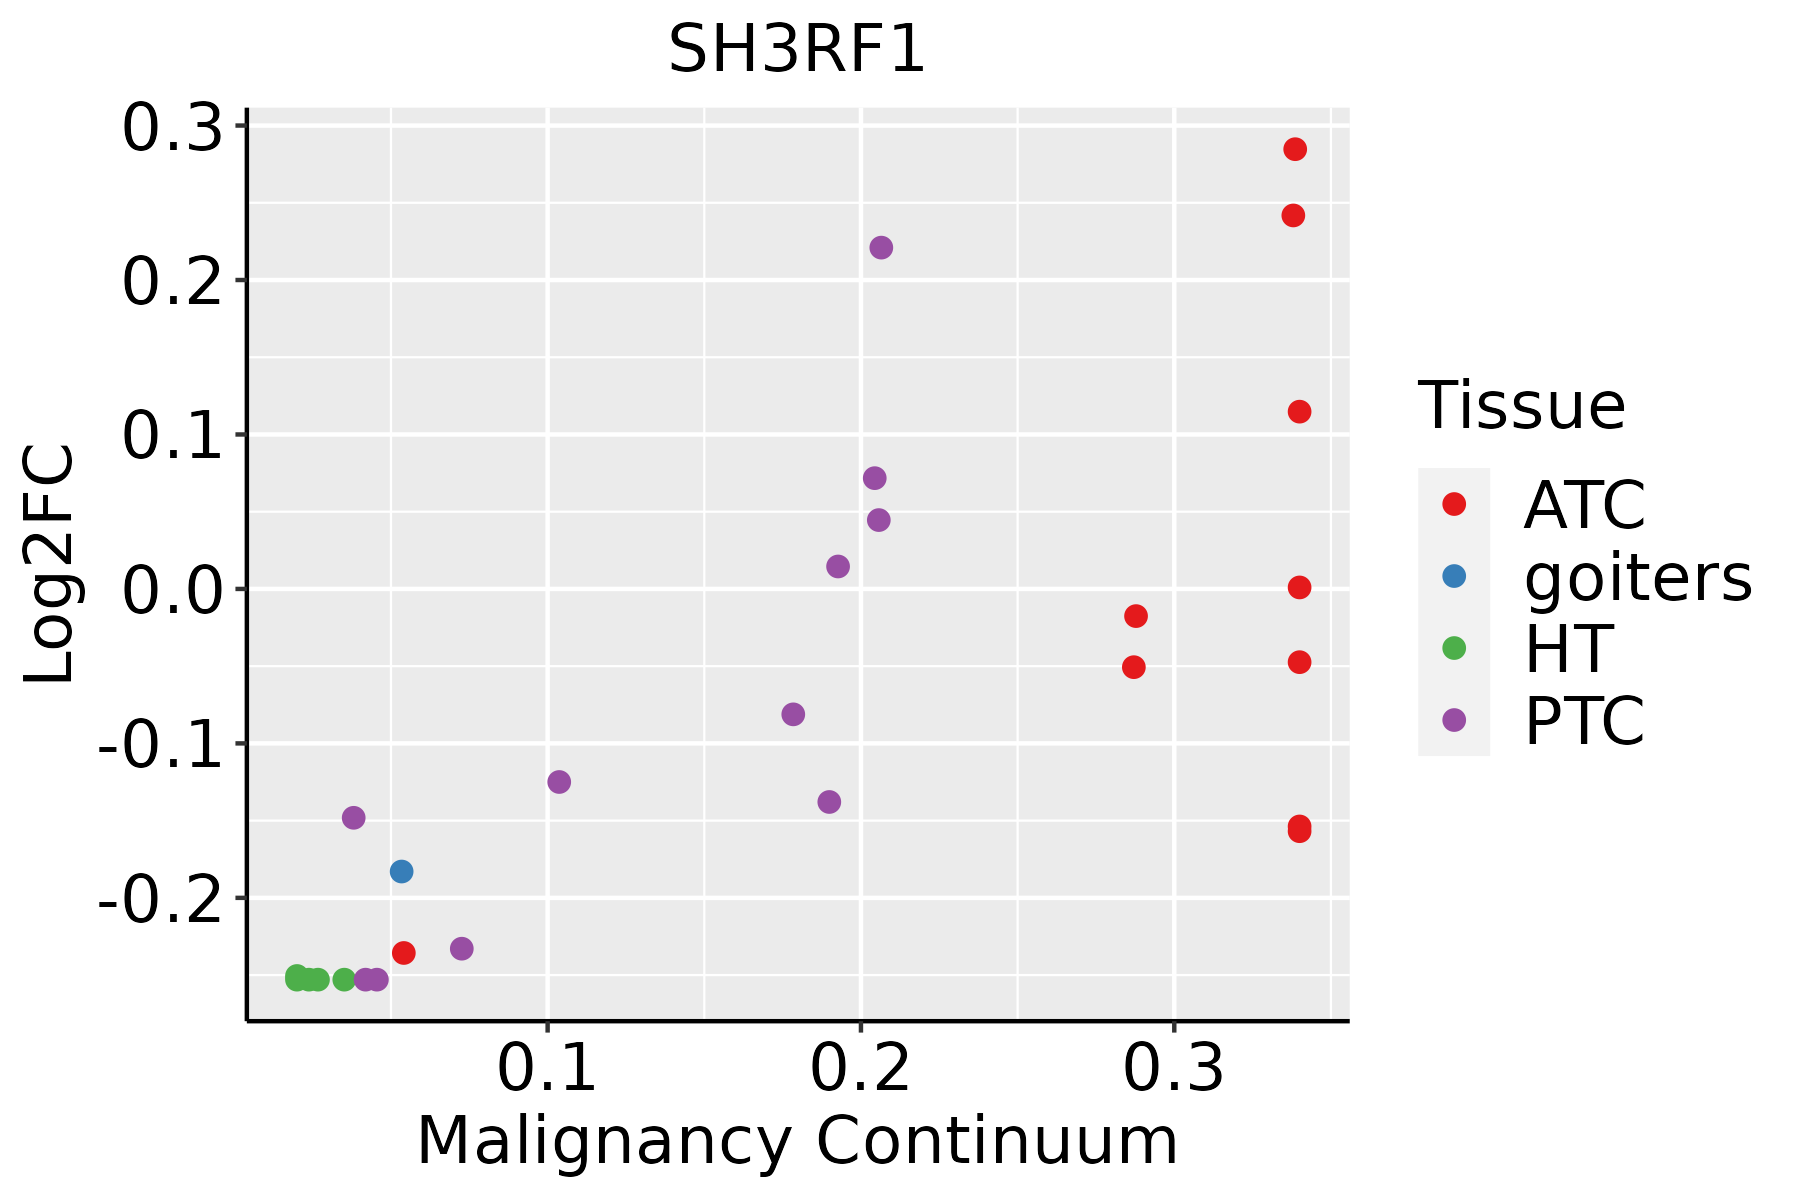 | ATC: Anaplastic thyroid cancer |
| HT: Hashimoto's thyroiditis |
| PTC: Papillary thyroid cancer |
| GO ID | Tissue | Disease Stage | Description | Gene Ratio | Bg Ratio | pvalue | p.adjust | Count |
| GO:2001236113 | Thyroid | PTC | regulation of extrinsic apoptotic signaling pathway | 82/5968 | 151/18723 | 9.01e-09 | 2.18e-07 | 82 |
| GO:0043281113 | Thyroid | PTC | regulation of cysteine-type endopeptidase activity involved in apoptotic process | 99/5968 | 209/18723 | 1.93e-06 | 2.64e-05 | 99 |
| GO:0031098111 | Thyroid | PTC | stress-activated protein kinase signaling cascade | 113/5968 | 247/18723 | 3.16e-06 | 4.10e-05 | 113 |
| GO:2000116113 | Thyroid | PTC | regulation of cysteine-type endopeptidase activity | 108/5968 | 235/18723 | 3.99e-06 | 4.99e-05 | 108 |
| GO:0052547113 | Thyroid | PTC | regulation of peptidase activity | 191/5968 | 461/18723 | 7.82e-06 | 9.02e-05 | 191 |
| GO:0051403111 | Thyroid | PTC | stress-activated MAPK cascade | 108/5968 | 239/18723 | 1.02e-05 | 1.13e-04 | 108 |
| GO:2001237113 | Thyroid | PTC | negative regulation of extrinsic apoptotic signaling pathway | 51/5968 | 97/18723 | 1.83e-05 | 1.88e-04 | 51 |
| GO:00518659 | Thyroid | PTC | protein autoubiquitination | 40/5968 | 73/18723 | 4.17e-05 | 3.80e-04 | 40 |
| GO:0052548113 | Thyroid | PTC | regulation of endopeptidase activity | 174/5968 | 432/18723 | 1.20e-04 | 9.55e-04 | 174 |
| GO:0043154112 | Thyroid | PTC | negative regulation of cysteine-type endopeptidase activity involved in apoptotic process | 40/5968 | 78/18723 | 2.83e-04 | 2.01e-03 | 40 |
| GO:2000117112 | Thyroid | PTC | negative regulation of cysteine-type endopeptidase activity | 43/5968 | 86/18723 | 3.49e-04 | 2.40e-03 | 43 |
| GO:000725419 | Thyroid | PTC | JNK cascade | 73/5968 | 167/18723 | 8.41e-04 | 5.17e-03 | 73 |
| GO:0070302110 | Thyroid | PTC | regulation of stress-activated protein kinase signaling cascade | 83/5968 | 195/18723 | 1.04e-03 | 6.21e-03 | 83 |
| GO:0032872110 | Thyroid | PTC | regulation of stress-activated MAPK cascade | 81/5968 | 192/18723 | 1.62e-03 | 8.95e-03 | 81 |
| GO:0051346112 | Thyroid | PTC | negative regulation of hydrolase activity | 146/5968 | 379/18723 | 3.33e-03 | 1.62e-02 | 146 |
| GO:0045861113 | Thyroid | PTC | negative regulation of proteolysis | 136/5968 | 351/18723 | 3.54e-03 | 1.71e-02 | 136 |
| GO:200123335 | Thyroid | ATC | regulation of apoptotic signaling pathway | 206/6293 | 356/18723 | 2.81e-21 | 5.92e-19 | 206 |
| GO:2001234210 | Thyroid | ATC | negative regulation of apoptotic signaling pathway | 129/6293 | 224/18723 | 1.26e-13 | 6.46e-12 | 129 |
| GO:0097191210 | Thyroid | ATC | extrinsic apoptotic signaling pathway | 125/6293 | 219/18723 | 7.19e-13 | 3.16e-11 | 125 |
| GO:2001236210 | Thyroid | ATC | regulation of extrinsic apoptotic signaling pathway | 89/6293 | 151/18723 | 1.43e-10 | 4.40e-09 | 89 |
| Hugo Symbol | Variant Class | Variant Classification | dbSNP RS | HGVSc | HGVSp | HGVSp Short | SWISSPROT | BIOTYPE | SIFT | PolyPhen | Tumor Sample Barcode | Tissue | Histology | Sex | Age | Stage | Therapy Types | Drugs | Outcome |
| SH3RF1 | SNV | Missense_Mutation | novel | c.2350N>T | p.Ala784Ser | p.A784S | Q7Z6J0 | protein_coding | tolerated(1) | benign(0) | TCGA-A8-A07W-01 | Breast | breast invasive carcinoma | Female | >=65 | III/IV | Hormone Therapy | exemestane | SD |
| SH3RF1 | SNV | Missense_Mutation | novel | c.2125N>C | p.Asp709His | p.D709H | Q7Z6J0 | protein_coding | deleterious(0.01) | probably_damaging(0.997) | TCGA-AC-A5EH-01 | Breast | breast invasive carcinoma | Female | >=65 | I/II | Unknown | Unknown | SD |
| SH3RF1 | SNV | Missense_Mutation | novel | c.1762N>G | p.Asn588Asp | p.N588D | Q7Z6J0 | protein_coding | tolerated(0.06) | benign(0.112) | TCGA-AO-A128-01 | Breast | breast invasive carcinoma | Female | <65 | I/II | Chemotherapy | doxorubicin | SD |
| SH3RF1 | SNV | Missense_Mutation | | c.1033G>A | p.Glu345Lys | p.E345K | Q7Z6J0 | protein_coding | deleterious(0.01) | probably_damaging(0.94) | TCGA-AR-A250-01 | Breast | breast invasive carcinoma | Female | <65 | I/II | Chemotherapy | doxorubicin | SD |
| SH3RF1 | SNV | Missense_Mutation | novel | c.1129N>A | p.Gly377Ser | p.G377S | Q7Z6J0 | protein_coding | tolerated(0.11) | possibly_damaging(0.661) | TCGA-D8-A73U-01 | Breast | breast invasive carcinoma | Female | >=65 | I/II | Hormone Therapy | tamoxiphen | SD |
| SH3RF1 | insertion | Frame_Shift_Ins | novel | c.411_412insGCCCACCTGGTGTCCTTTCCAAC | p.Cys138AlafsTer80 | p.C138Afs*80 | Q7Z6J0 | protein_coding | | | TCGA-AO-A128-01 | Breast | breast invasive carcinoma | Female | <65 | I/II | Chemotherapy | doxorubicin | SD |
| SH3RF1 | insertion | Nonsense_Mutation | novel | c.2194_2195insGTTCCAGGAAAAAACTAAAAAATGAACAATAG | p.Pro732ArgfsTer11 | p.P732Rfs*11 | Q7Z6J0 | protein_coding | | | TCGA-BH-A0B1-01 | Breast | breast invasive carcinoma | Female | >=65 | I/II | Chemotherapy | adriamycin | SD |
| SH3RF1 | SNV | Missense_Mutation | novel | c.1726N>T | p.His576Tyr | p.H576Y | Q7Z6J0 | protein_coding | deleterious(0.01) | benign(0.172) | TCGA-EA-A3HS-01 | Cervix | cervical & endocervical cancer | Female | <65 | I/II | Unknown | Unknown | SD |
| SH3RF1 | SNV | Missense_Mutation | novel | c.578C>T | p.Pro193Leu | p.P193L | Q7Z6J0 | protein_coding | deleterious(0) | benign(0.158) | TCGA-EA-A3HU-01 | Cervix | cervical & endocervical cancer | Female | <65 | I/II | Unknown | Unknown | SD |
| SH3RF1 | SNV | Missense_Mutation | rs755524119 | c.1569N>C | p.Gln523His | p.Q523H | Q7Z6J0 | protein_coding | tolerated(0.15) | possibly_damaging(0.556) | TCGA-EK-A3GJ-01 | Cervix | cervical & endocervical cancer | Female | <65 | I/II | Unknown | Unknown | SD |


