
|
|||||
|
 | |
| |
| |
| |
| |
| |
|
Gene: OGT |
Gene summary for OGT |
| Gene information | Species | Human | Gene symbol | OGT | Gene ID | 8473 |
| Gene name | O-linked N-acetylglucosamine (GlcNAc) transferase | |
| Gene Alias | HINCUT-1 | |
| Cytomap | Xq13.1 | |
| Gene Type | protein-coding | GO ID | GO:0001659 | UniProtAcc | O15294 |
Top |
Malignant transformation analysis |
| Identification of the aberrant gene expression in precancerous and cancerous lesions by comparing the gene expression of stem-like cells in diseased tissues with normal stem cells |
| Entrez ID | Symbol | Replicates | Species | Organ | Tissue | Adj P-value | Log2FC | Malignancy |
| 8473 | OGT | LZE4T | Human | Esophagus | ESCC | 3.13e-08 | 4.64e-01 | 0.0811 |
| 8473 | OGT | LZE7T | Human | Esophagus | ESCC | 4.42e-18 | 8.47e-01 | 0.0667 |
| 8473 | OGT | LZE8T | Human | Esophagus | ESCC | 5.15e-13 | 2.98e-01 | 0.067 |
| 8473 | OGT | LZE20T | Human | Esophagus | ESCC | 4.39e-08 | 2.26e-01 | 0.0662 |
| 8473 | OGT | LZE22D1 | Human | Esophagus | HGIN | 3.33e-04 | 8.25e-02 | 0.0595 |
| 8473 | OGT | LZE22T | Human | Esophagus | ESCC | 1.83e-02 | 3.89e-01 | 0.068 |
| 8473 | OGT | LZE24T | Human | Esophagus | ESCC | 1.77e-39 | 1.34e+00 | 0.0596 |
| 8473 | OGT | LZE22D3 | Human | Esophagus | HGIN | 2.89e-02 | 2.67e-01 | 0.0653 |
| 8473 | OGT | LZE21T | Human | Esophagus | ESCC | 3.91e-05 | 4.84e-01 | 0.0655 |
| 8473 | OGT | LZE6T | Human | Esophagus | ESCC | 8.79e-09 | 1.67e-01 | 0.0845 |
| 8473 | OGT | P1T-E | Human | Esophagus | ESCC | 1.52e-13 | 6.89e-01 | 0.0875 |
| 8473 | OGT | P2T-E | Human | Esophagus | ESCC | 2.21e-19 | 3.27e-01 | 0.1177 |
| 8473 | OGT | P4T-E | Human | Esophagus | ESCC | 1.77e-15 | 2.25e-01 | 0.1323 |
| 8473 | OGT | P5T-E | Human | Esophagus | ESCC | 3.91e-19 | 1.75e-01 | 0.1327 |
| 8473 | OGT | P8T-E | Human | Esophagus | ESCC | 1.31e-32 | 7.17e-01 | 0.0889 |
| 8473 | OGT | P9T-E | Human | Esophagus | ESCC | 1.33e-12 | 3.89e-01 | 0.1131 |
| 8473 | OGT | P10T-E | Human | Esophagus | ESCC | 9.15e-33 | 4.55e-01 | 0.116 |
| 8473 | OGT | P11T-E | Human | Esophagus | ESCC | 8.05e-15 | 2.92e-01 | 0.1426 |
| 8473 | OGT | P12T-E | Human | Esophagus | ESCC | 7.59e-27 | 6.18e-01 | 0.1122 |
| 8473 | OGT | P15T-E | Human | Esophagus | ESCC | 1.15e-17 | 4.05e-01 | 0.1149 |
| Page: 1 2 3 4 5 6 7 |
| Tissue | Expression Dynamics | Abbreviation |
| Esophagus | 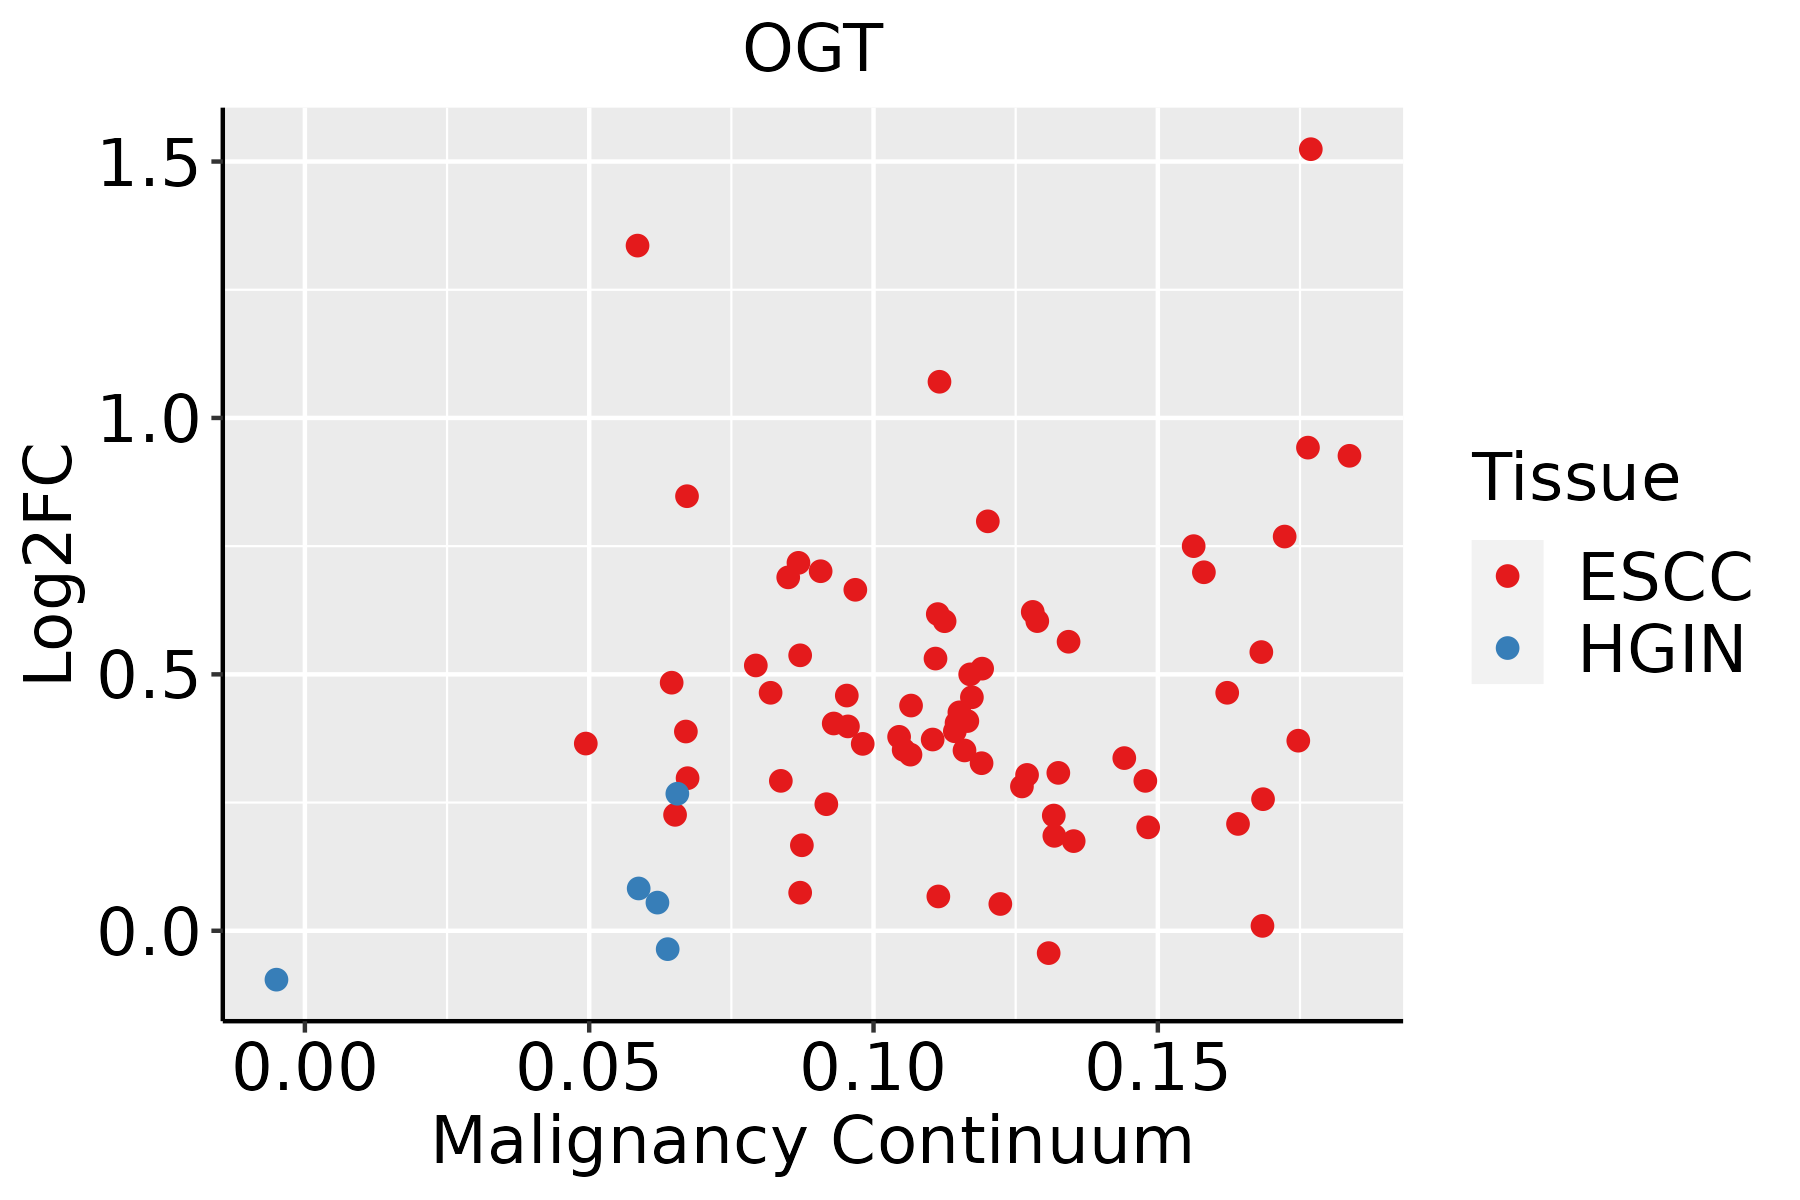 | ESCC: Esophageal squamous cell carcinoma |
| HGIN: High-grade intraepithelial neoplasias | ||
| LGIN: Low-grade intraepithelial neoplasias | ||
| Liver |  | HCC: Hepatocellular carcinoma |
| NAFLD: Non-alcoholic fatty liver disease | ||
| Oral Cavity | 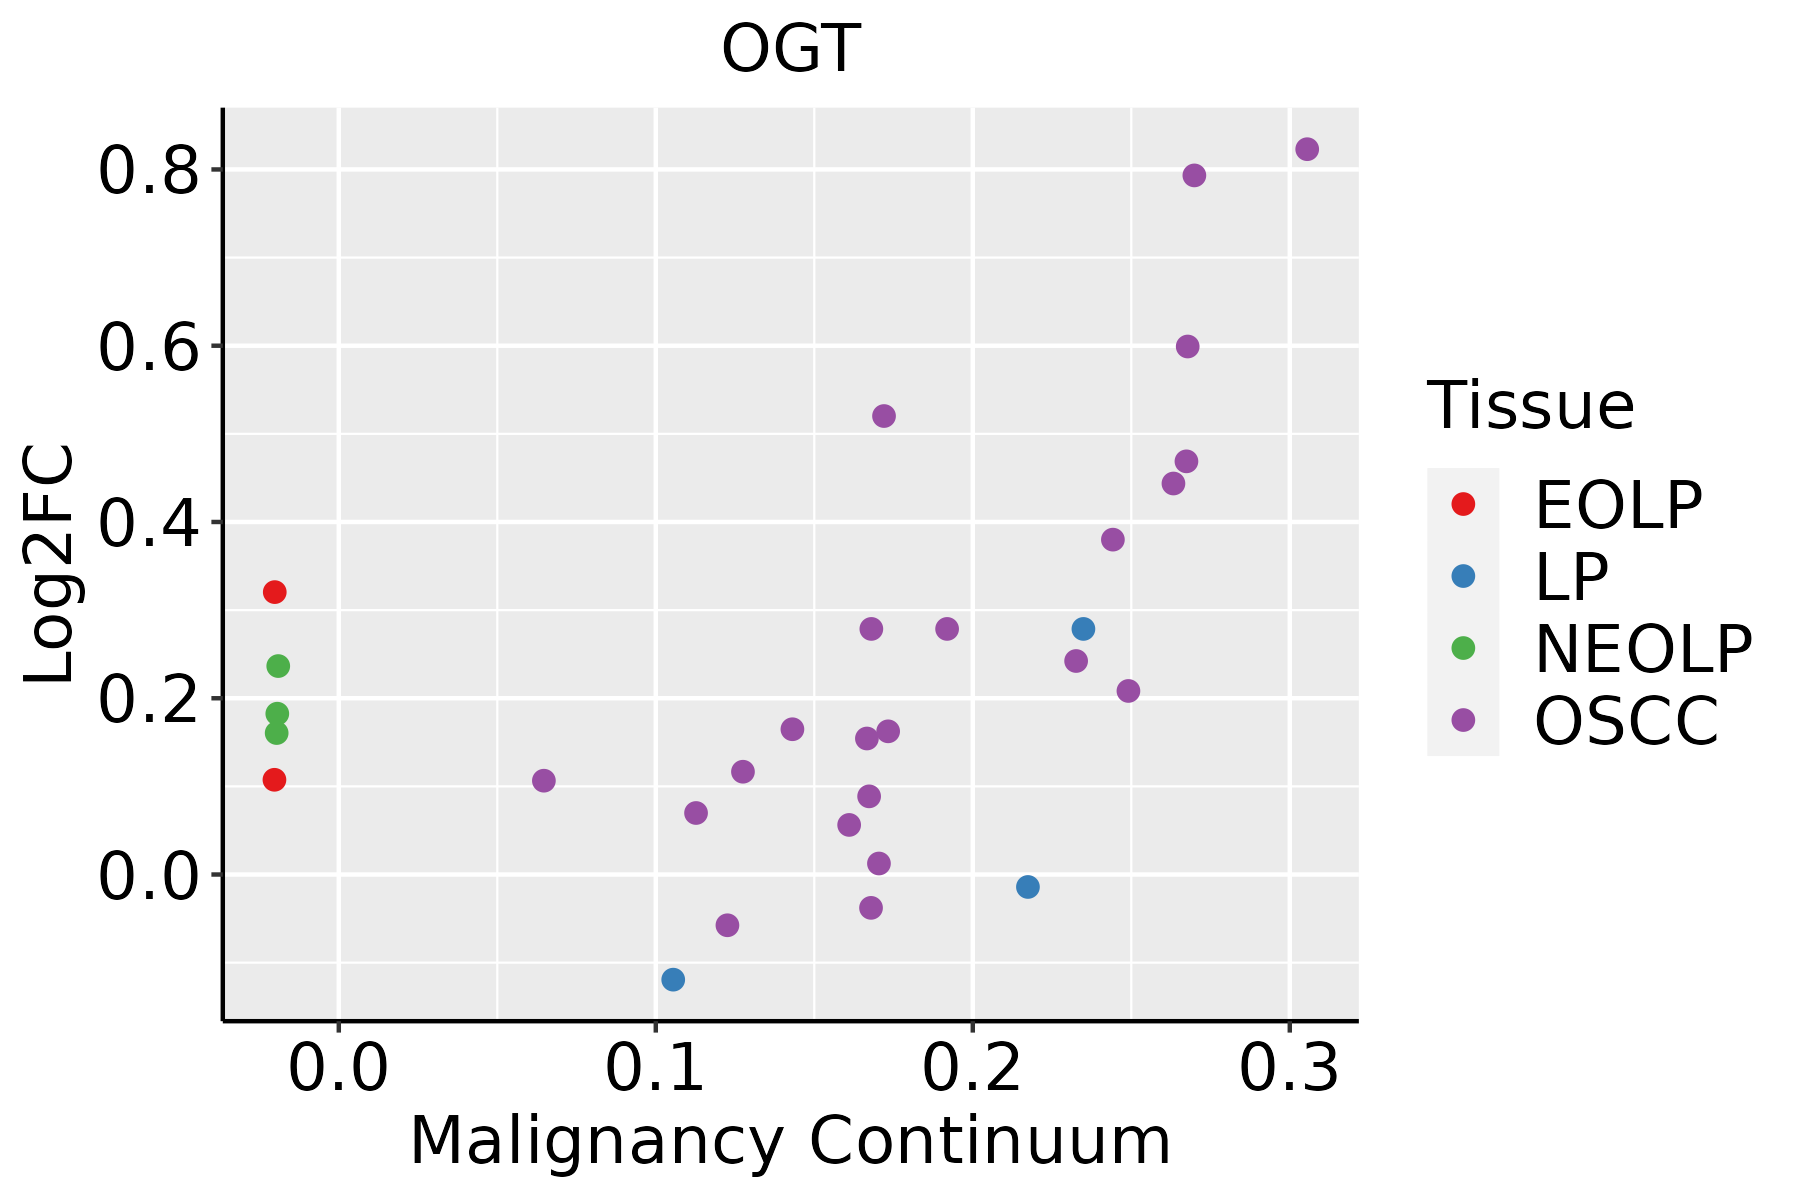 | EOLP: Erosive Oral lichen planus |
| LP: leukoplakia | ||
| NEOLP: Non-erosive oral lichen planus | ||
| OSCC: Oral squamous cell carcinoma | ||
| Prostate |  | BPH: Benign Prostatic Hyperplasia |
| Thyroid | 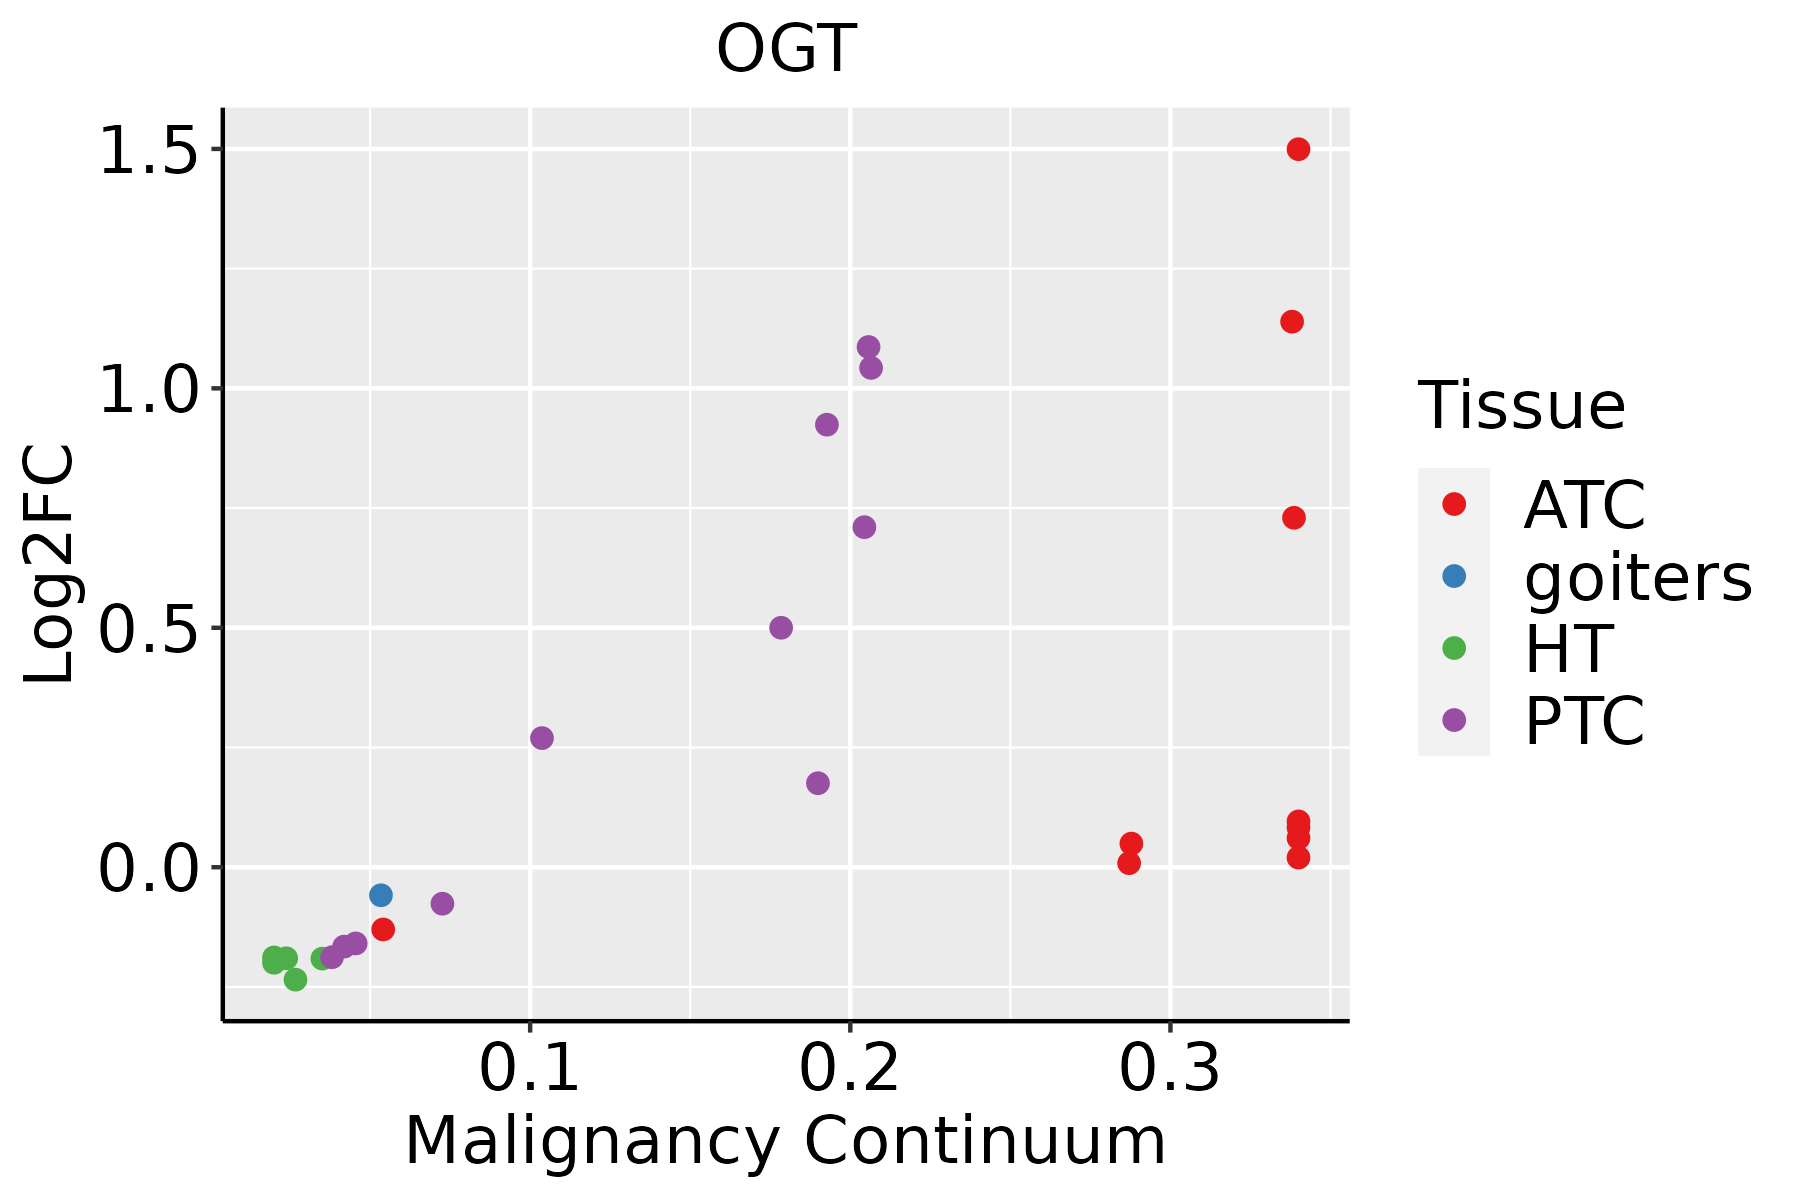 | ATC: Anaplastic thyroid cancer |
| HT: Hashimoto's thyroiditis | ||
| PTC: Papillary thyroid cancer |
| ∗log2FC in expression of this searched gene in stem-like cells from each diseased tissue sample relative to stem-like cells in normal samples in each tissue plotted against the malignancy continuum. Samples are colored based on if they are from different disease stage. |
Top |
Malignant transformation related pathway analysis |
| Find out the enriched GO biological processes and KEGG pathways involved in transition from healthy to precancer to cancer |
| Tissue | Disease Stage | Enriched GO biological Processes |
| Colorectum | AD |  |
| Colorectum | SER |  |
| Colorectum | MSS |  |
| Colorectum | MSI-H |  |
| Colorectum | FAP |  |
| ∗Top 15 enriched GO BP terms are showed in the bar plot of each disease state in each tissue. Each row represents a significant GO biological process which is colored according to the -log10(p.adjust). |
| Page: 1 2 3 4 5 6 7 8 9 |
| GO ID | Tissue | Disease Stage | Description | Gene Ratio | Bg Ratio | pvalue | p.adjust | Count |
| GO:000675724 | Oral cavity | NEOLP | ATP generation from ADP | 20/2005 | 82/18723 | 3.21e-04 | 3.11e-03 | 20 |
| GO:004693932 | Oral cavity | NEOLP | nucleotide phosphorylation | 23/2005 | 101/18723 | 3.50e-04 | 3.37e-03 | 23 |
| GO:200005933 | Oral cavity | NEOLP | negative regulation of ubiquitin-dependent protein catabolic process | 14/2005 | 48/18723 | 3.56e-04 | 3.41e-03 | 14 |
| GO:003496822 | Oral cavity | NEOLP | histone lysine methylation | 25/2005 | 115/18723 | 4.21e-04 | 3.89e-03 | 25 |
| GO:004657815 | Oral cavity | NEOLP | regulation of Ras protein signal transduction | 36/2005 | 189/18723 | 4.30e-04 | 3.92e-03 | 36 |
| GO:004603132 | Oral cavity | NEOLP | ADP metabolic process | 21/2005 | 90/18723 | 4.39e-04 | 3.97e-03 | 21 |
| GO:005160432 | Oral cavity | NEOLP | protein maturation | 50/2005 | 294/18723 | 6.46e-04 | 5.47e-03 | 50 |
| GO:000616532 | Oral cavity | NEOLP | nucleoside diphosphate phosphorylation | 22/2005 | 99/18723 | 6.64e-04 | 5.54e-03 | 22 |
| GO:190357824 | Oral cavity | NEOLP | regulation of ATP metabolic process | 20/2005 | 87/18723 | 7.28e-04 | 5.97e-03 | 20 |
| GO:003106021 | Oral cavity | NEOLP | regulation of histone methylation | 17/2005 | 69/18723 | 7.76e-04 | 6.23e-03 | 17 |
| GO:000758423 | Oral cavity | NEOLP | response to nutrient | 33/2005 | 174/18723 | 7.89e-04 | 6.27e-03 | 33 |
| GO:00310622 | Oral cavity | NEOLP | positive regulation of histone methylation | 12/2005 | 41/18723 | 8.94e-04 | 7.02e-03 | 12 |
| GO:004217732 | Oral cavity | NEOLP | negative regulation of protein catabolic process | 25/2005 | 121/18723 | 9.29e-04 | 7.20e-03 | 25 |
| GO:001648521 | Oral cavity | NEOLP | protein processing | 39/2005 | 225/18723 | 1.68e-03 | 1.17e-02 | 39 |
| GO:005105614 | Oral cavity | NEOLP | regulation of small GTPase mediated signal transduction | 49/2005 | 302/18723 | 2.04e-03 | 1.36e-02 | 49 |
| GO:000828622 | Oral cavity | NEOLP | insulin receptor signaling pathway | 23/2005 | 116/18723 | 2.56e-03 | 1.61e-02 | 23 |
| GO:190305132 | Oral cavity | NEOLP | negative regulation of proteolysis involved in cellular protein catabolic process | 15/2005 | 64/18723 | 2.63e-03 | 1.65e-02 | 15 |
| GO:004346733 | Oral cavity | NEOLP | regulation of generation of precursor metabolites and energy | 25/2005 | 130/18723 | 2.65e-03 | 1.66e-02 | 25 |
| GO:001802213 | Oral cavity | NEOLP | peptidyl-lysine methylation | 25/2005 | 131/18723 | 2.95e-03 | 1.81e-02 | 25 |
| GO:00439842 | Oral cavity | NEOLP | histone H4-K16 acetylation | 7/2005 | 20/18723 | 3.51e-03 | 2.06e-02 | 7 |
| Page: 1 2 3 4 5 6 7 8 9 10 11 12 13 14 15 16 17 18 19 20 21 22 23 24 25 26 27 28 29 30 31 32 33 34 35 36 37 38 39 40 41 42 43 44 45 46 47 48 49 50 51 |
| Pathway ID | Tissue | Disease Stage | Description | Gene Ratio | Bg Ratio | pvalue | p.adjust | qvalue | Count |
| hsa049318 | Esophagus | ESCC | Insulin resistance | 69/4205 | 108/8465 | 1.92e-03 | 5.54e-03 | 2.84e-03 | 69 |
| hsa0493113 | Esophagus | ESCC | Insulin resistance | 69/4205 | 108/8465 | 1.92e-03 | 5.54e-03 | 2.84e-03 | 69 |
| hsa049316 | Liver | NAFLD | Insulin resistance | 29/1043 | 108/8465 | 3.01e-05 | 7.59e-04 | 6.11e-04 | 29 |
| hsa0493111 | Liver | NAFLD | Insulin resistance | 29/1043 | 108/8465 | 3.01e-05 | 7.59e-04 | 6.11e-04 | 29 |
| hsa0493121 | Liver | HCC | Insulin resistance | 77/4020 | 108/8465 | 3.89e-07 | 4.46e-06 | 2.48e-06 | 77 |
| hsa0493131 | Liver | HCC | Insulin resistance | 77/4020 | 108/8465 | 3.89e-07 | 4.46e-06 | 2.48e-06 | 77 |
| hsa049317 | Oral cavity | OSCC | Insulin resistance | 60/3704 | 108/8465 | 8.66e-03 | 1.97e-02 | 1.00e-02 | 60 |
| hsa0493112 | Oral cavity | OSCC | Insulin resistance | 60/3704 | 108/8465 | 8.66e-03 | 1.97e-02 | 1.00e-02 | 60 |
| hsa0493122 | Oral cavity | EOLP | Insulin resistance | 25/1218 | 108/8465 | 9.53e-03 | 2.63e-02 | 1.55e-02 | 25 |
| hsa0493132 | Oral cavity | EOLP | Insulin resistance | 25/1218 | 108/8465 | 9.53e-03 | 2.63e-02 | 1.55e-02 | 25 |
| Page: 1 |
Top |
Cell-cell communication analysis |
| Identification of potential cell-cell interactions between two cell types and their ligand-receptor pairs for different disease states |
| Ligand | Receptor | LRpair | Pathway | Tissue | Disease Stage |
| Page: 1 |
Top |
Single-cell gene regulatory network inference analysis |
| Find out the significant the regulons (TFs) and the target genes of each regulon across cell types for different disease states |
| TF | Cell Type | Tissue | Disease Stage | Target Gene | RSS | Regulon Activity |
| ∗The dot plots of a searched regulon are shown for all cell subpopulations in each disease state of each tissue based on the regulon specific score inferred using pySCENIC and by calculating the average expression. |
| Page: 1 |
Top |
Somatic mutation of malignant transformation related genes |
| Annotation of somatic variants for genes involved in malignant transformation |
| Hugo Symbol | Variant Class | Variant Classification | dbSNP RS | HGVSc | HGVSp | HGVSp Short | SWISSPROT | BIOTYPE | SIFT | PolyPhen | Tumor Sample Barcode | Tissue | Histology | Sex | Age | Stage | Therapy Types | Drugs | Outcome |
| OGT | SNV | Missense_Mutation | novel | c.1945N>C | p.Glu649Gln | p.E649Q | O15294 | protein_coding | deleterious(0) | probably_damaging(0.994) | TCGA-5L-AAT1-01 | Breast | breast invasive carcinoma | Female | <65 | III/IV | Hormone Therapy | letrozol | SD |
| OGT | SNV | Missense_Mutation | novel | c.278C>T | p.Ser93Leu | p.S93L | O15294 | protein_coding | deleterious(0.01) | probably_damaging(1) | TCGA-AN-A046-01 | Breast | breast invasive carcinoma | Female | >=65 | I/II | Unknown | Unknown | SD |
| OGT | SNV | Missense_Mutation | rs267606503 | c.1042C>T | p.Arg348Cys | p.R348C | O15294 | protein_coding | deleterious(0.01) | benign(0.158) | TCGA-AN-A046-01 | Breast | breast invasive carcinoma | Female | >=65 | I/II | Unknown | Unknown | SD |
| OGT | SNV | Missense_Mutation | novel | c.1612C>A | p.Leu538Ile | p.L538I | O15294 | protein_coding | deleterious(0.03) | benign(0.08) | TCGA-AN-A046-01 | Breast | breast invasive carcinoma | Female | >=65 | I/II | Unknown | Unknown | SD |
| OGT | SNV | Missense_Mutation | rs778629433 | c.557N>T | p.Thr186Met | p.T186M | O15294 | protein_coding | tolerated(0.11) | probably_damaging(0.995) | TCGA-BH-A0AY-01 | Breast | breast invasive carcinoma | Female | <65 | I/II | Chemotherapy | SD | |
| OGT | SNV | Missense_Mutation | rs200109331 | c.588N>G | p.Asn196Lys | p.N196K | O15294 | protein_coding | deleterious(0) | probably_damaging(1) | TCGA-BH-A0RX-01 | Breast | breast invasive carcinoma | Female | <65 | I/II | Chemotherapy | fluorouracil | SD |
| OGT | SNV | Missense_Mutation | c.1288N>A | p.Asp430Asn | p.D430N | O15294 | protein_coding | deleterious(0) | probably_damaging(0.99) | TCGA-EW-A1OV-01 | Breast | breast invasive carcinoma | Female | <65 | I/II | Chemotherapy | epirubicin | SD | |
| OGT | SNV | Missense_Mutation | c.1390N>A | p.Asp464Asn | p.D464N | O15294 | protein_coding | deleterious(0) | probably_damaging(0.973) | TCGA-LD-A74U-01 | Breast | breast invasive carcinoma | Female | >=65 | III/IV | Chemotherapy | taxotere | SD | |
| OGT | SNV | Missense_Mutation | c.2861N>T | p.Arg954Leu | p.R954L | O15294 | protein_coding | deleterious(0) | possibly_damaging(0.825) | TCGA-LL-A6FP-01 | Breast | breast invasive carcinoma | Female | >=65 | I/II | Hormone Therapy | arimidex | SD | |
| OGT | SNV | Missense_Mutation | novel | c.687C>G | p.Ile229Met | p.I229M | O15294 | protein_coding | tolerated(0.06) | probably_damaging(1) | TCGA-XX-A89A-01 | Breast | breast invasive carcinoma | Female | >=65 | I/II | Unknown | Unknown | SD |
| Page: 1 2 3 4 5 6 7 8 9 10 11 12 13 14 |
Top |
Related drugs of malignant transformation related genes |
| Identification of chemicals and drugs interact with genes involved in malignant transfromation |
| (DGIdb 4.0) |
| Entrez ID | Symbol | Category | Interaction Types | Drug Claim Name | Drug Name | PMIDs |
| Page: 1 |

Copyright 2023-Present -The University of Texas Health Science Center at Houston |