
|
|||||
|
 | |
| |
| |
| |
| |
| |
|
Gene: INE1 |
Gene summary for INE1 |
| Gene information | Species | Human | Gene symbol | INE1 | Gene ID | 8552 |
| Gene name | inactivation escape 1 | |
| Gene Alias | NCRNA00010 | |
| Cytomap | Xp11.3 | |
| Gene Type | ncRNA | GO ID | NA | UniProtAcc | NA |
Top |
Malignant transformation analysis |
| Identification of the aberrant gene expression in precancerous and cancerous lesions by comparing the gene expression of stem-like cells in diseased tissues with normal stem cells |
| Entrez ID | Symbol | Replicates | Species | Organ | Tissue | Adj P-value | Log2FC | Malignancy |
| 8552 | INE1 | HCC1 | Human | Liver | HCC | 2.10e-06 | 1.87e+00 | 0.5336 |
| 8552 | INE1 | HCC2 | Human | Liver | HCC | 2.78e-04 | 7.61e-01 | 0.5341 |
| 8552 | INE1 | HCC5 | Human | Liver | HCC | 2.57e-02 | 4.34e-01 | 0.4932 |
| Page: 1 |
| Tissue | Expression Dynamics | Abbreviation |
| Liver | 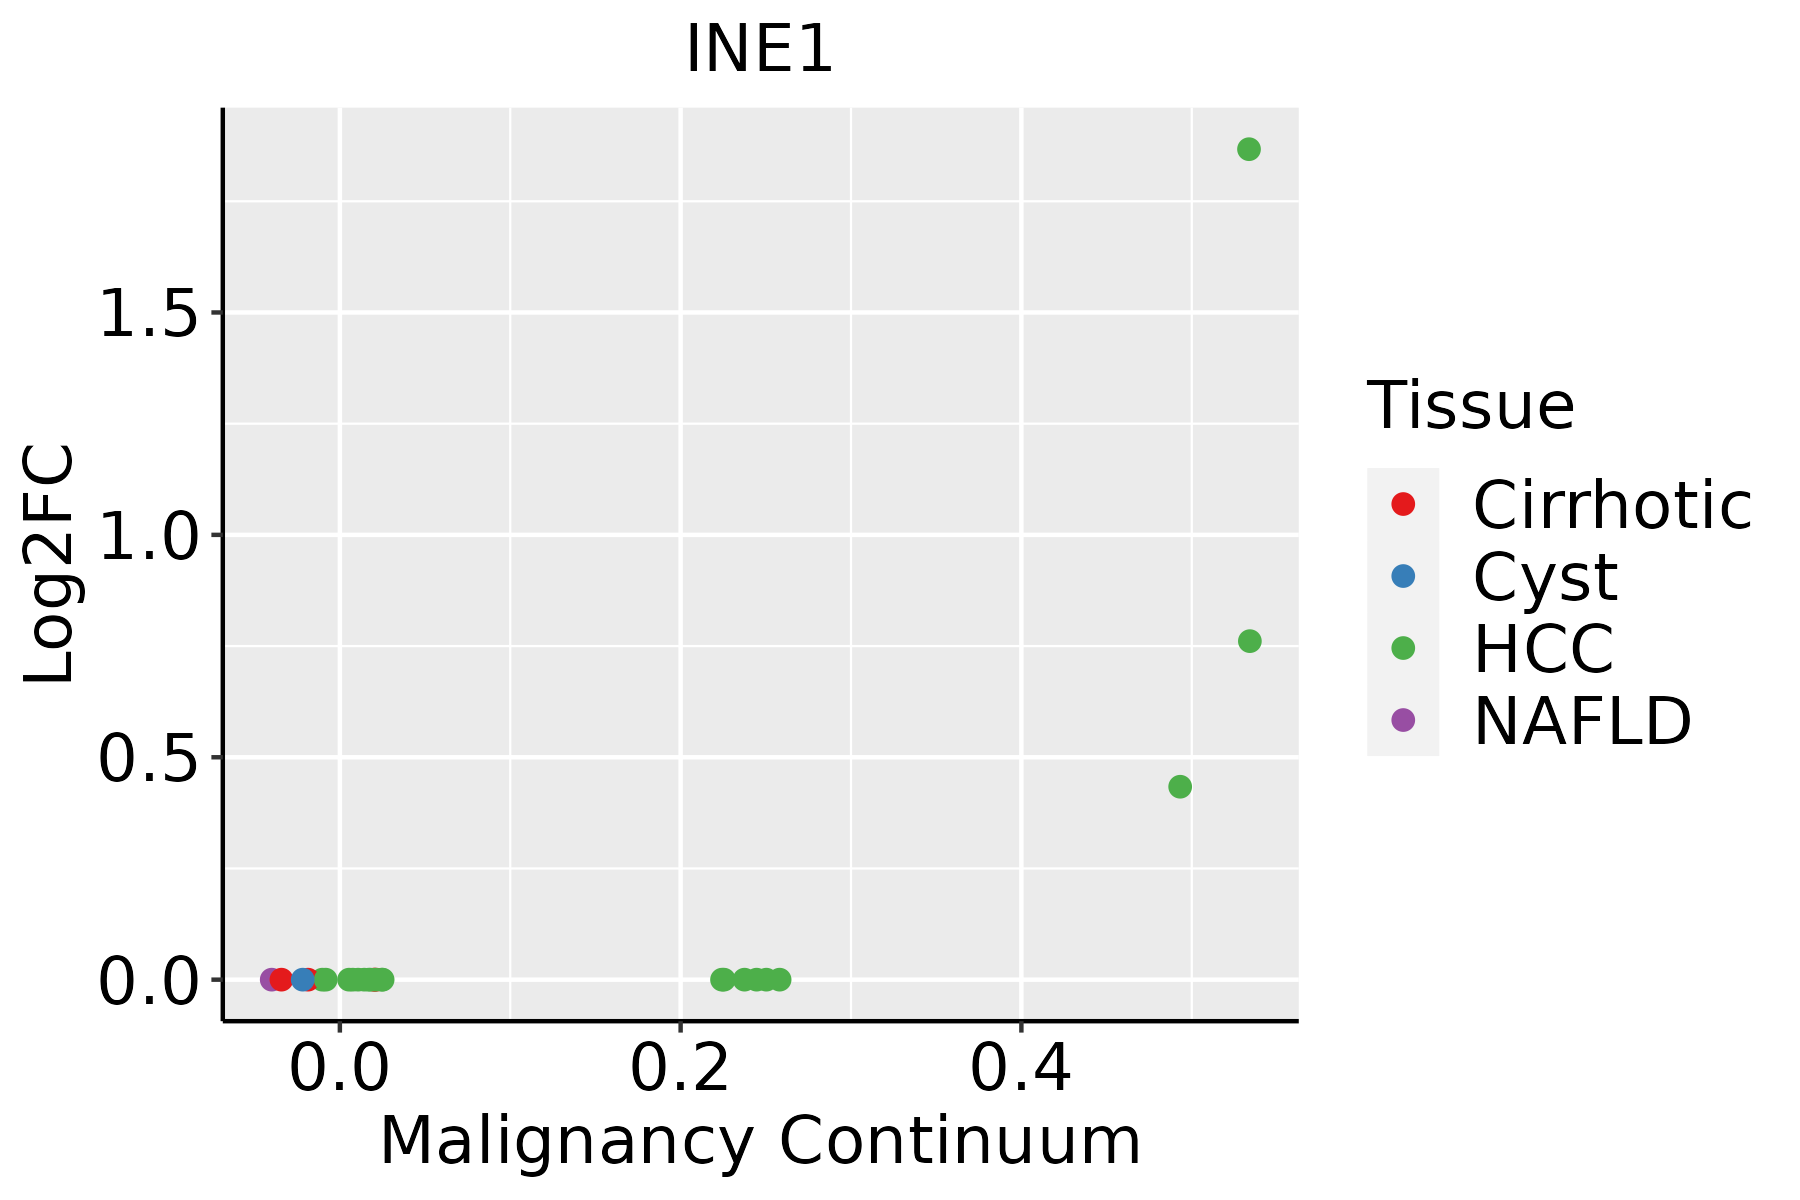 | HCC: Hepatocellular carcinoma |
| NAFLD: Non-alcoholic fatty liver disease |
| ∗log2FC in expression of this searched gene in stem-like cells from each diseased tissue sample relative to stem-like cells in normal samples in each tissue plotted against the malignancy continuum. Samples are colored based on if they are from different disease stage. |
Top |
Malignant transformation related pathway analysis |
| Find out the enriched GO biological processes and KEGG pathways involved in transition from healthy to precancer to cancer |
| Tissue | Disease Stage | Enriched GO biological Processes |
| Colorectum | AD |  |
| Colorectum | SER |  |
| Colorectum | MSS |  |
| Colorectum | MSI-H |  |
| Colorectum | FAP |  |
| ∗Top 15 enriched GO BP terms are showed in the bar plot of each disease state in each tissue. Each row represents a significant GO biological process which is colored according to the -log10(p.adjust). |
| Page: 1 2 3 4 5 6 7 8 9 |
| GO ID | Tissue | Disease Stage | Description | Gene Ratio | Bg Ratio | pvalue | p.adjust | Count |
| GO:19020426 | Thyroid | PTC | negative regulation of extrinsic apoptotic signaling pathway via death domain receptors | 17/5968 | 31/18723 | 6.74e-03 | 2.90e-02 | 17 |
| GO:000268718 | Thyroid | PTC | positive regulation of leukocyte migration | 57/5968 | 135/18723 | 7.15e-03 | 3.07e-02 | 57 |
| GO:000716219 | Thyroid | PTC | negative regulation of cell adhesion | 117/5968 | 303/18723 | 7.28e-03 | 3.12e-02 | 117 |
| GO:009030318 | Thyroid | PTC | positive regulation of wound healing | 28/5968 | 59/18723 | 8.85e-03 | 3.68e-02 | 28 |
| GO:200123335 | Thyroid | ATC | regulation of apoptotic signaling pathway | 206/6293 | 356/18723 | 2.81e-21 | 5.92e-19 | 206 |
| GO:003158928 | Thyroid | ATC | cell-substrate adhesion | 195/6293 | 363/18723 | 1.58e-15 | 1.17e-13 | 195 |
| GO:001081029 | Thyroid | ATC | regulation of cell-substrate adhesion | 128/6293 | 221/18723 | 8.74e-14 | 4.57e-12 | 128 |
| GO:2001234210 | Thyroid | ATC | negative regulation of apoptotic signaling pathway | 129/6293 | 224/18723 | 1.26e-13 | 6.46e-12 | 129 |
| GO:0097191210 | Thyroid | ATC | extrinsic apoptotic signaling pathway | 125/6293 | 219/18723 | 7.19e-13 | 3.16e-11 | 125 |
| GO:004206034 | Thyroid | ATC | wound healing | 210/6293 | 422/18723 | 3.33e-12 | 1.37e-10 | 210 |
| GO:0007160111 | Thyroid | ATC | cell-matrix adhesion | 128/6293 | 233/18723 | 1.49e-11 | 5.41e-10 | 128 |
| GO:2001236210 | Thyroid | ATC | regulation of extrinsic apoptotic signaling pathway | 89/6293 | 151/18723 | 1.43e-10 | 4.40e-09 | 89 |
| GO:0001952110 | Thyroid | ATC | regulation of cell-matrix adhesion | 78/6293 | 128/18723 | 2.09e-10 | 6.15e-09 | 78 |
| GO:0030100111 | Thyroid | ATC | regulation of endocytosis | 113/6293 | 211/18723 | 1.71e-09 | 4.22e-08 | 113 |
| GO:000756829 | Thyroid | ATC | aging | 166/6293 | 339/18723 | 2.79e-09 | 6.60e-08 | 166 |
| GO:0045807111 | Thyroid | ATC | positive regulation of endocytosis | 61/6293 | 100/18723 | 1.80e-08 | 3.59e-07 | 61 |
| GO:0008625111 | Thyroid | ATC | extrinsic apoptotic signaling pathway via death domain receptors | 50/6293 | 82/18723 | 3.47e-07 | 5.13e-06 | 50 |
| GO:000756924 | Thyroid | ATC | cell aging | 72/6293 | 132/18723 | 5.77e-07 | 8.15e-06 | 72 |
| GO:000689826 | Thyroid | ATC | receptor-mediated endocytosis | 118/6293 | 244/18723 | 1.17e-06 | 1.50e-05 | 118 |
| GO:0051604110 | Thyroid | ATC | protein maturation | 136/6293 | 294/18723 | 4.00e-06 | 4.42e-05 | 136 |
| Page: 1 2 3 4 5 6 7 8 9 10 11 12 13 14 15 16 17 18 19 20 21 22 23 24 25 26 27 28 29 30 31 32 33 |
| Pathway ID | Tissue | Disease Stage | Description | Gene Ratio | Bg Ratio | pvalue | p.adjust | qvalue | Count |
| Page: 1 |
Top |
Cell-cell communication analysis |
| Identification of potential cell-cell interactions between two cell types and their ligand-receptor pairs for different disease states |
| Ligand | Receptor | LRpair | Pathway | Tissue | Disease Stage |
| Page: 1 |
Top |
Single-cell gene regulatory network inference analysis |
| Find out the significant the regulons (TFs) and the target genes of each regulon across cell types for different disease states |
| TF | Cell Type | Tissue | Disease Stage | Target Gene | RSS | Regulon Activity |
| ∗The dot plots of a searched regulon are shown for all cell subpopulations in each disease state of each tissue based on the regulon specific score inferred using pySCENIC and by calculating the average expression. |
| Page: 1 |
Top |
Somatic mutation of malignant transformation related genes |
| Annotation of somatic variants for genes involved in malignant transformation |
| Hugo Symbol | Variant Class | Variant Classification | dbSNP RS | HGVSc | HGVSp | HGVSp Short | SWISSPROT | BIOTYPE | SIFT | PolyPhen | Tumor Sample Barcode | Tissue | Histology | Sex | Age | Stage | Therapy Types | Drugs | Outcome |
| Page: 1 |
Top |
Related drugs of malignant transformation related genes |
| Identification of chemicals and drugs interact with genes involved in malignant transfromation |
| (DGIdb 4.0) |
| Entrez ID | Symbol | Category | Interaction Types | Drug Claim Name | Drug Name | PMIDs |
| Page: 1 |

Copyright 2023-Present -The University of Texas Health Science Center at Houston |