| Tissue | Expression Dynamics | Abbreviation |
| Colorectum (GSE201348) | 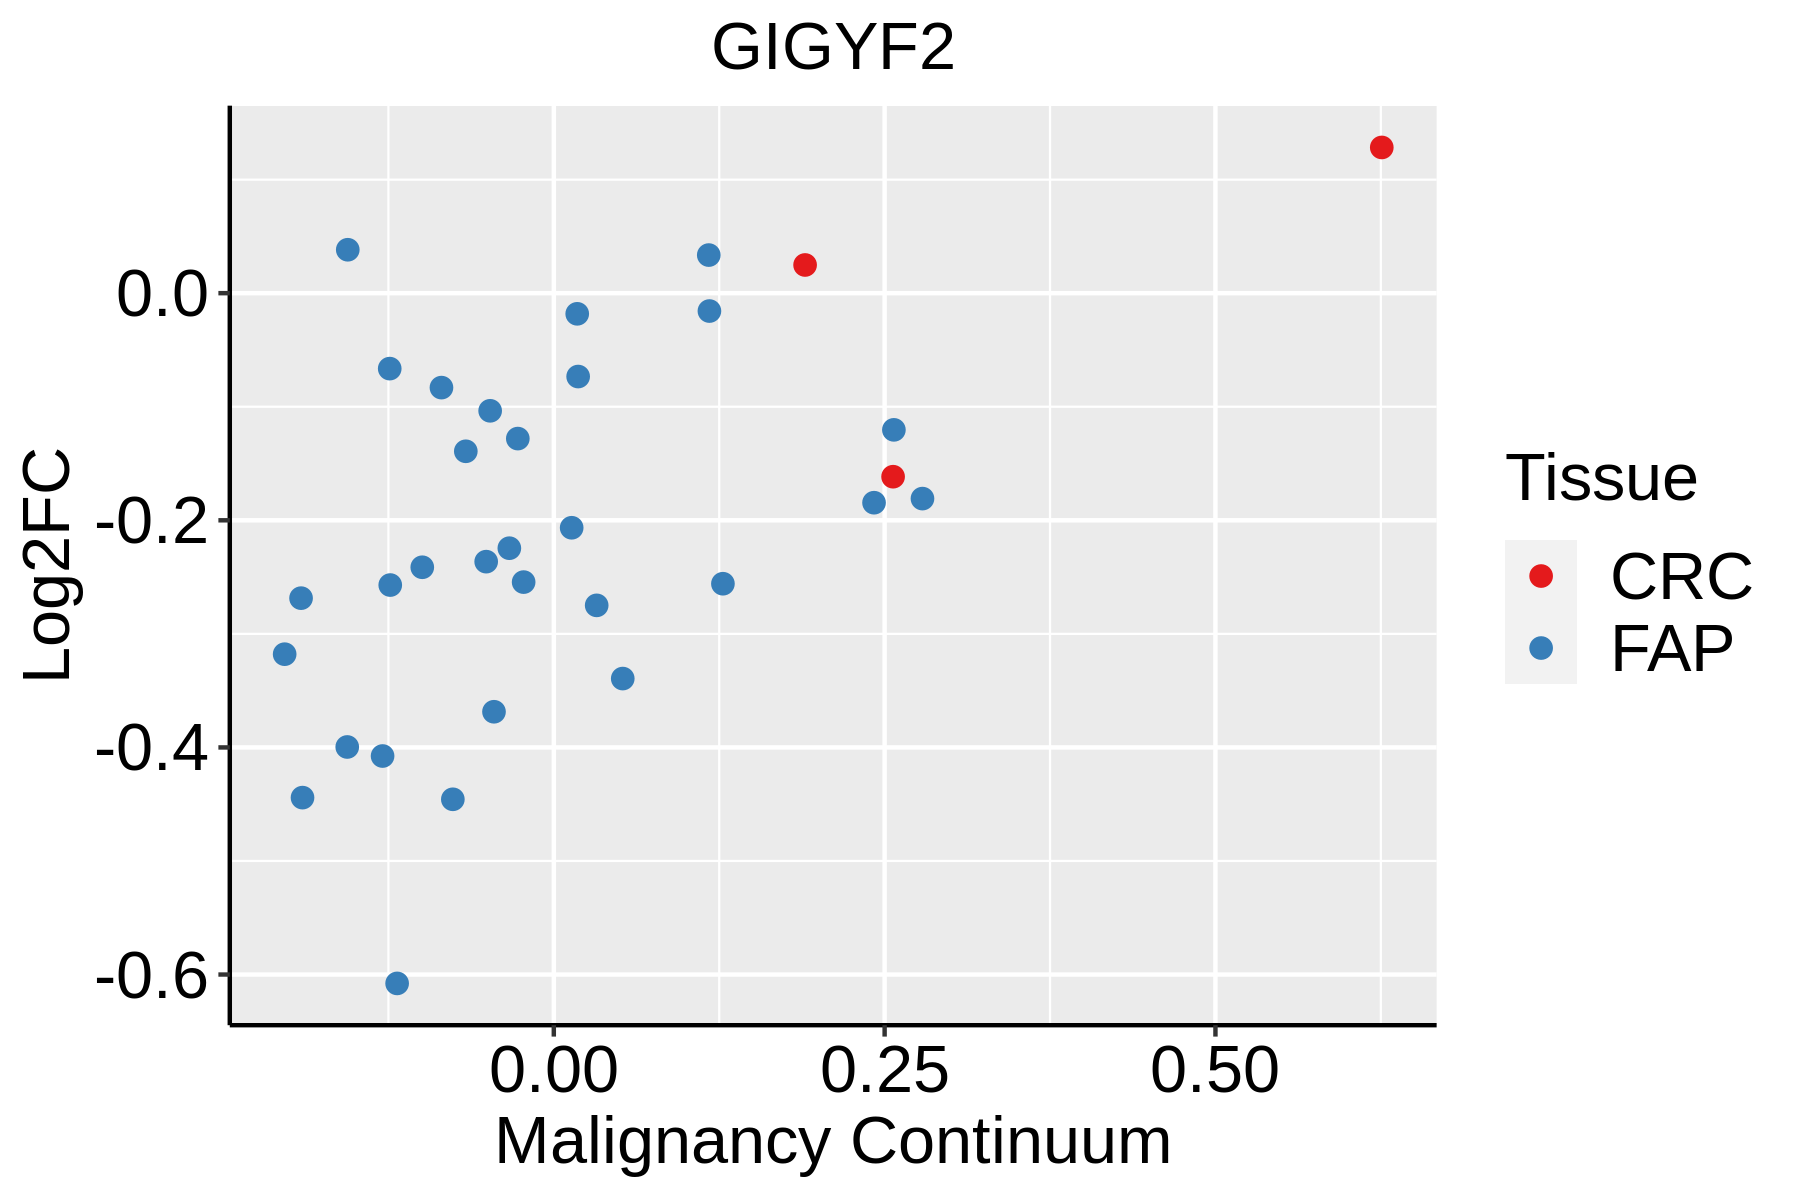 | FAP: Familial adenomatous polyposis |
| CRC: Colorectal cancer |
| Colorectum (HTA11) | 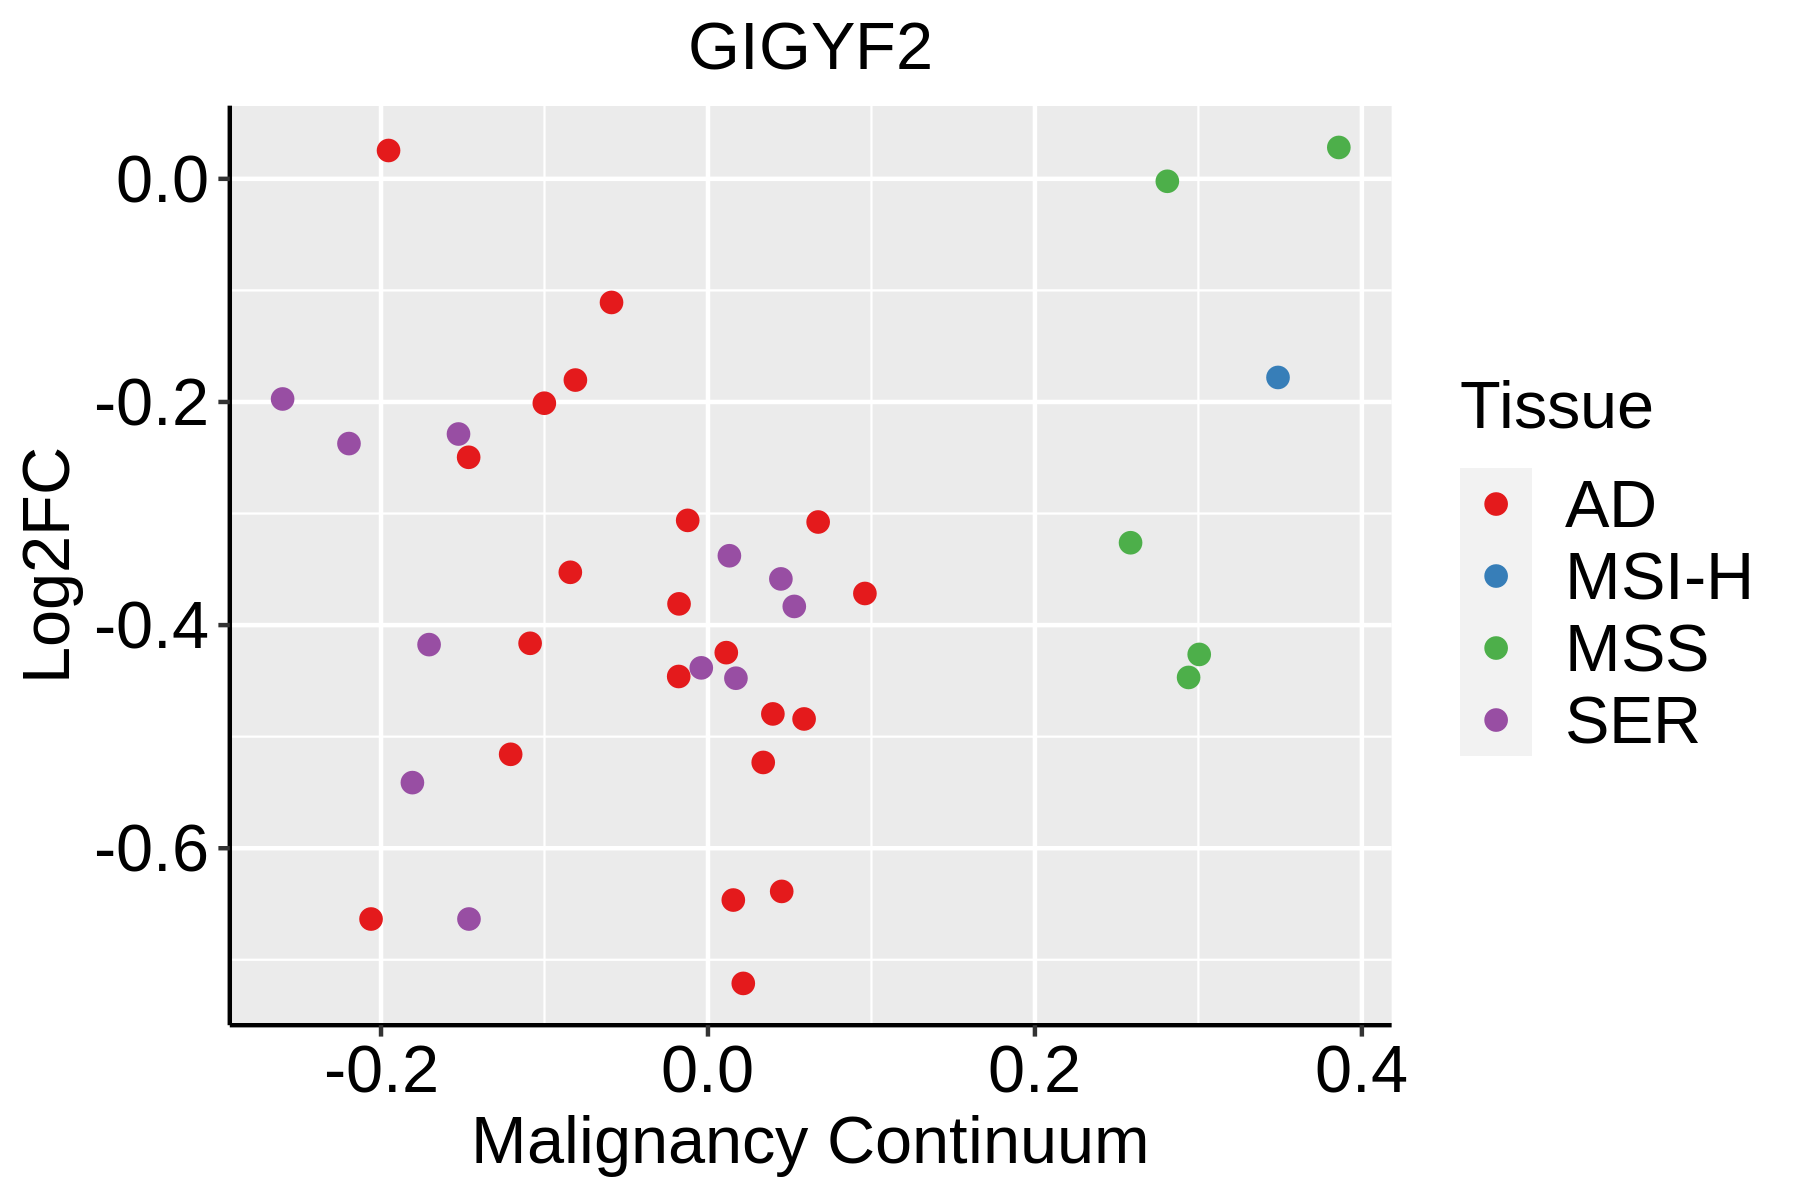 | AD: Adenomas |
| SER: Sessile serrated lesions |
| MSI-H: Microsatellite-high colorectal cancer |
| MSS: Microsatellite stable colorectal cancer |
| Esophagus |  | ESCC: Esophageal squamous cell carcinoma |
| HGIN: High-grade intraepithelial neoplasias |
| LGIN: Low-grade intraepithelial neoplasias |
| Liver | 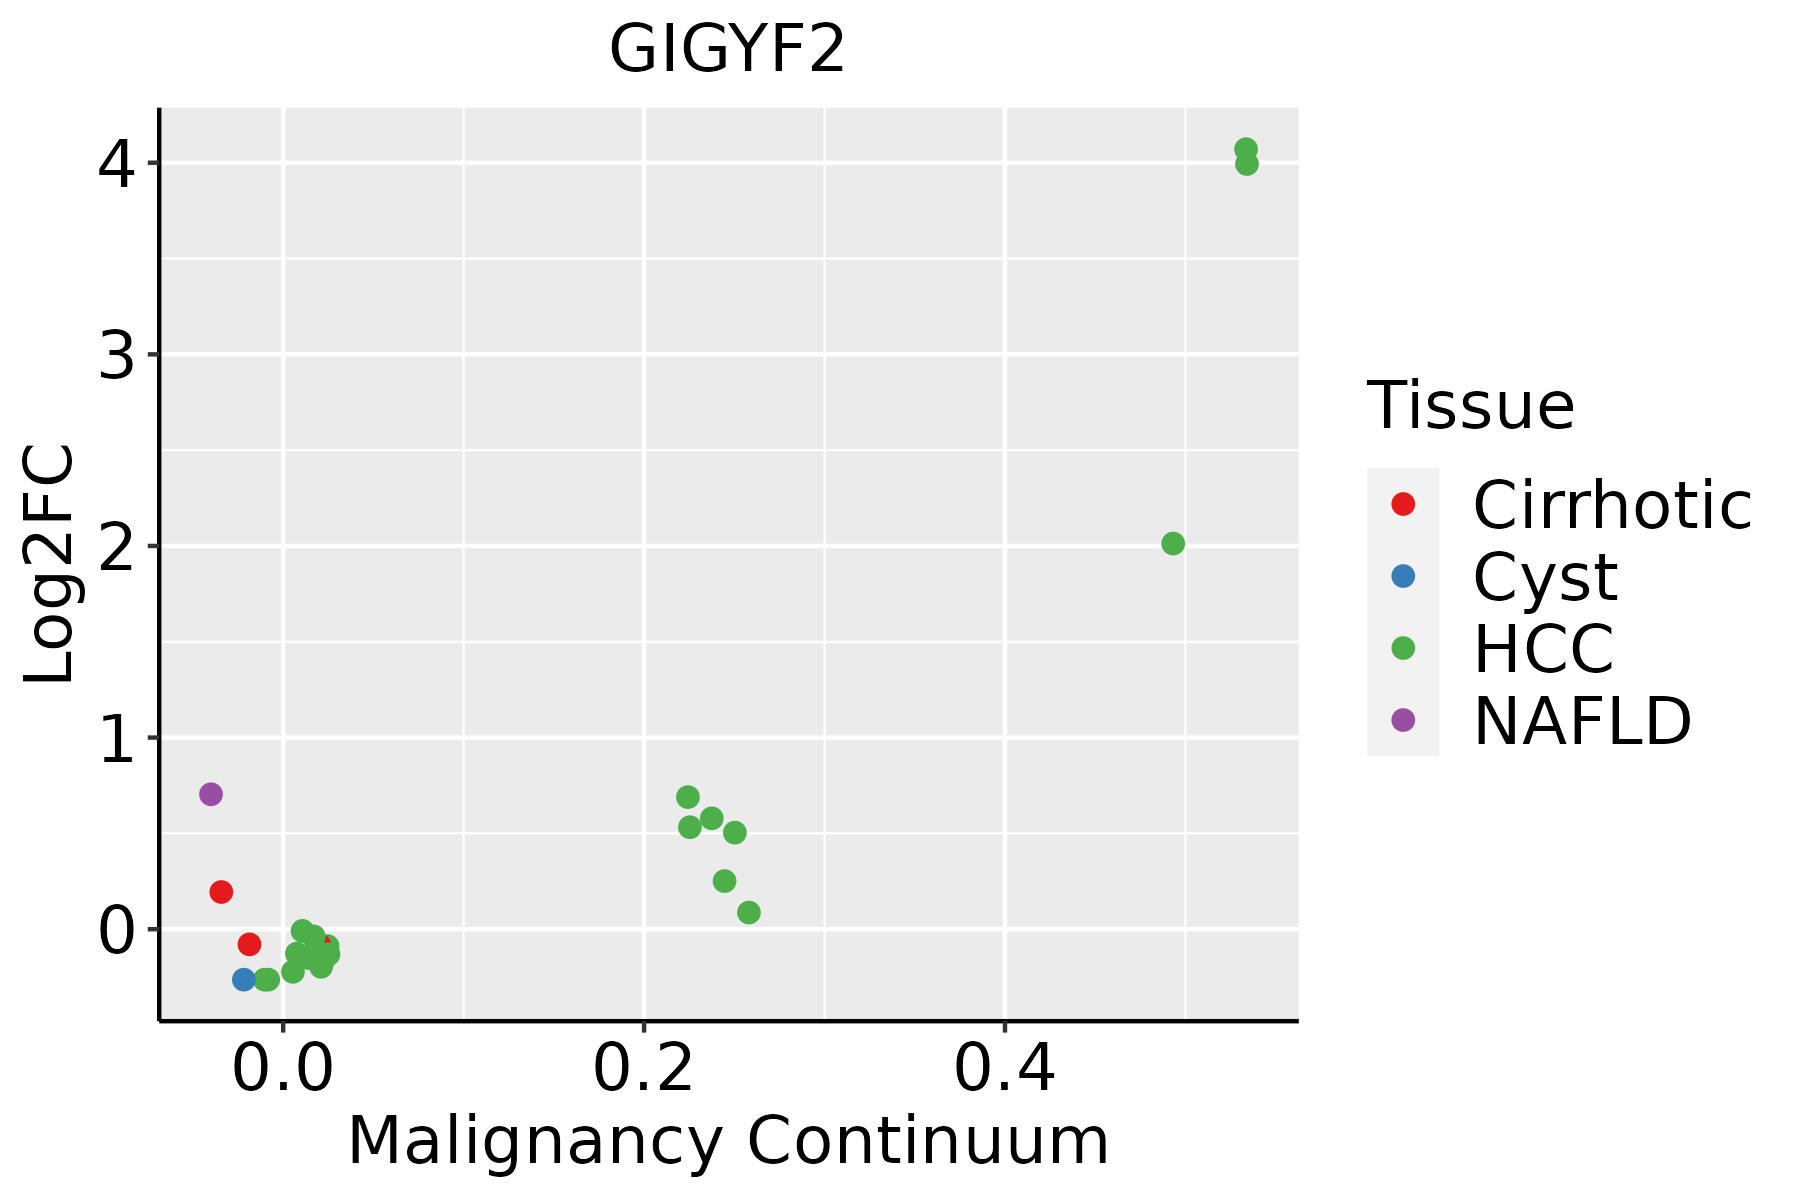 | HCC: Hepatocellular carcinoma |
| NAFLD: Non-alcoholic fatty liver disease |
| Lung | 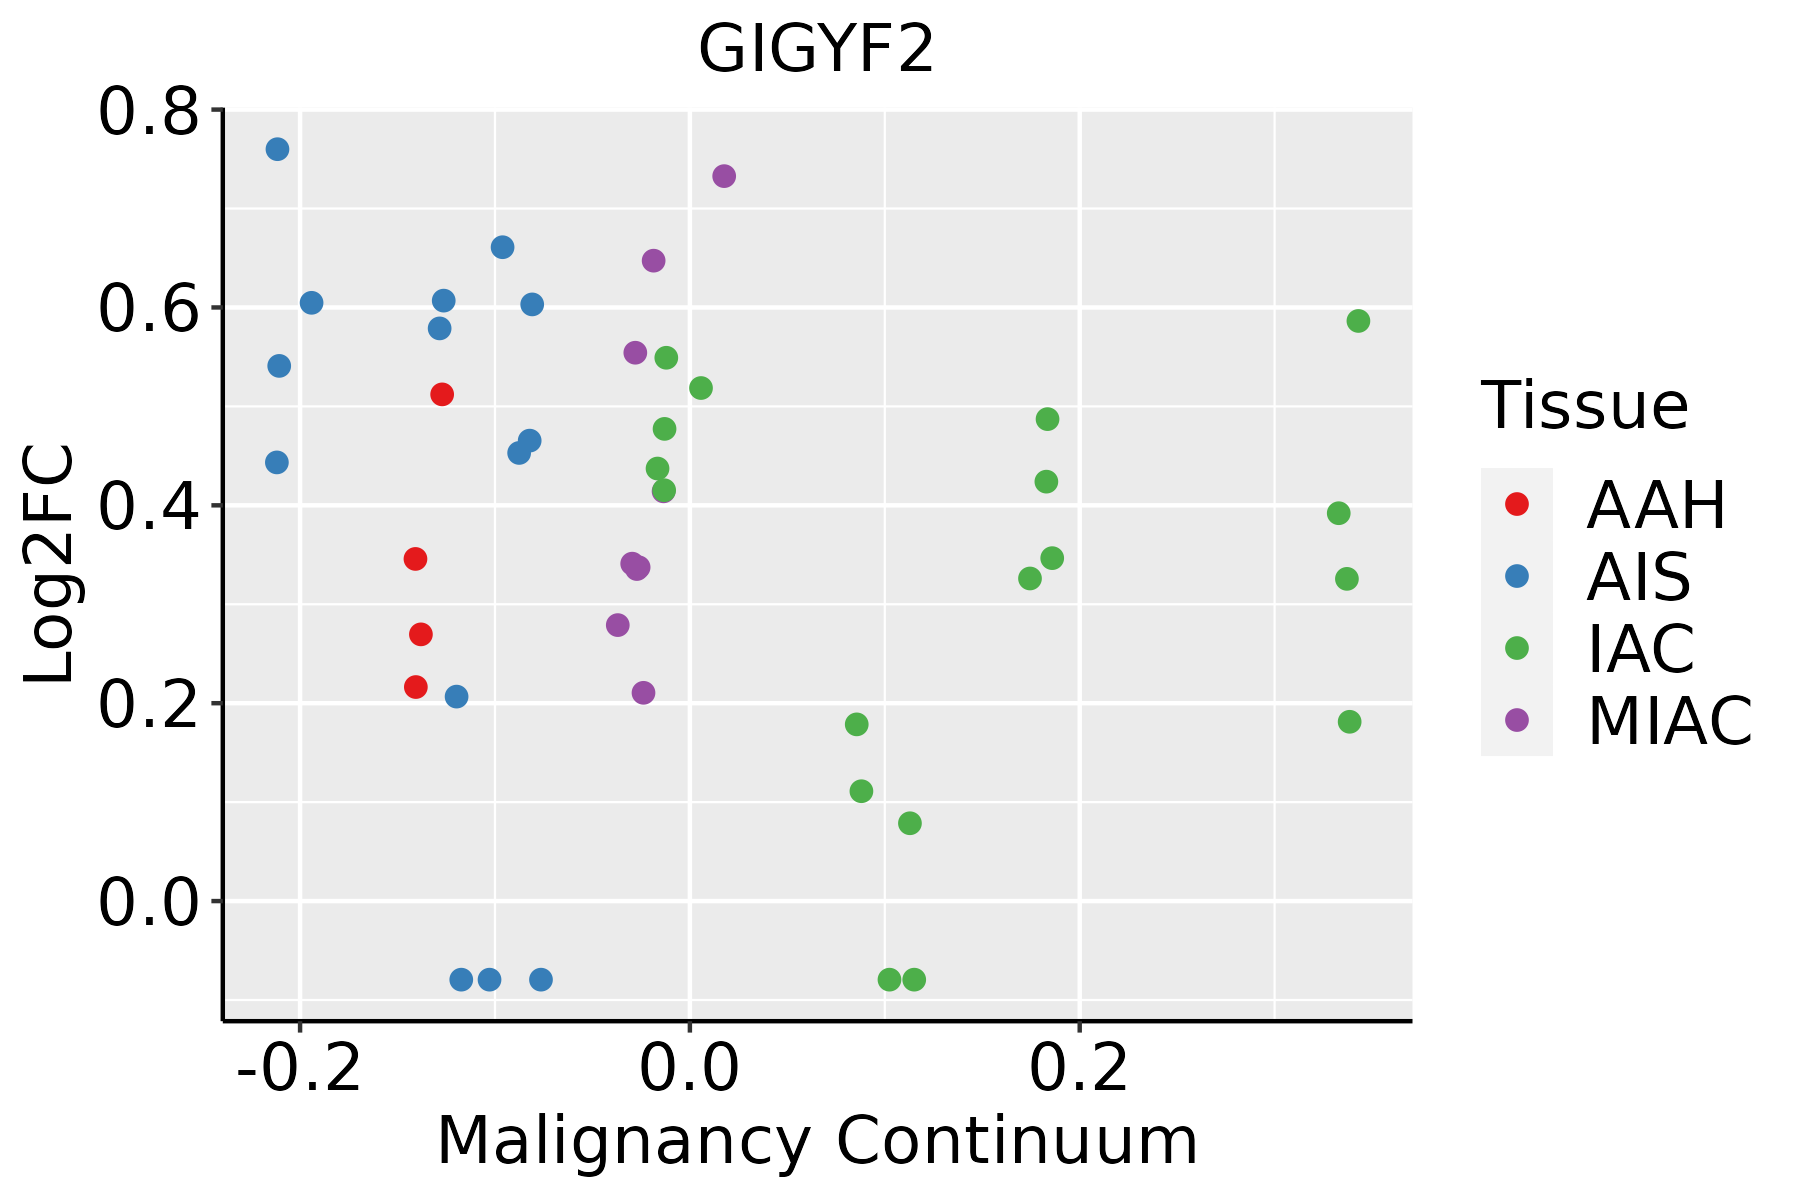 | AAH: Atypical adenomatous hyperplasia |
| AIS: Adenocarcinoma in situ |
| IAC: Invasive lung adenocarcinoma |
| MIA: Minimally invasive adenocarcinoma |
| Oral Cavity |  | EOLP: Erosive Oral lichen planus |
| LP: leukoplakia |
| NEOLP: Non-erosive oral lichen planus |
| OSCC: Oral squamous cell carcinoma |
| Prostate | 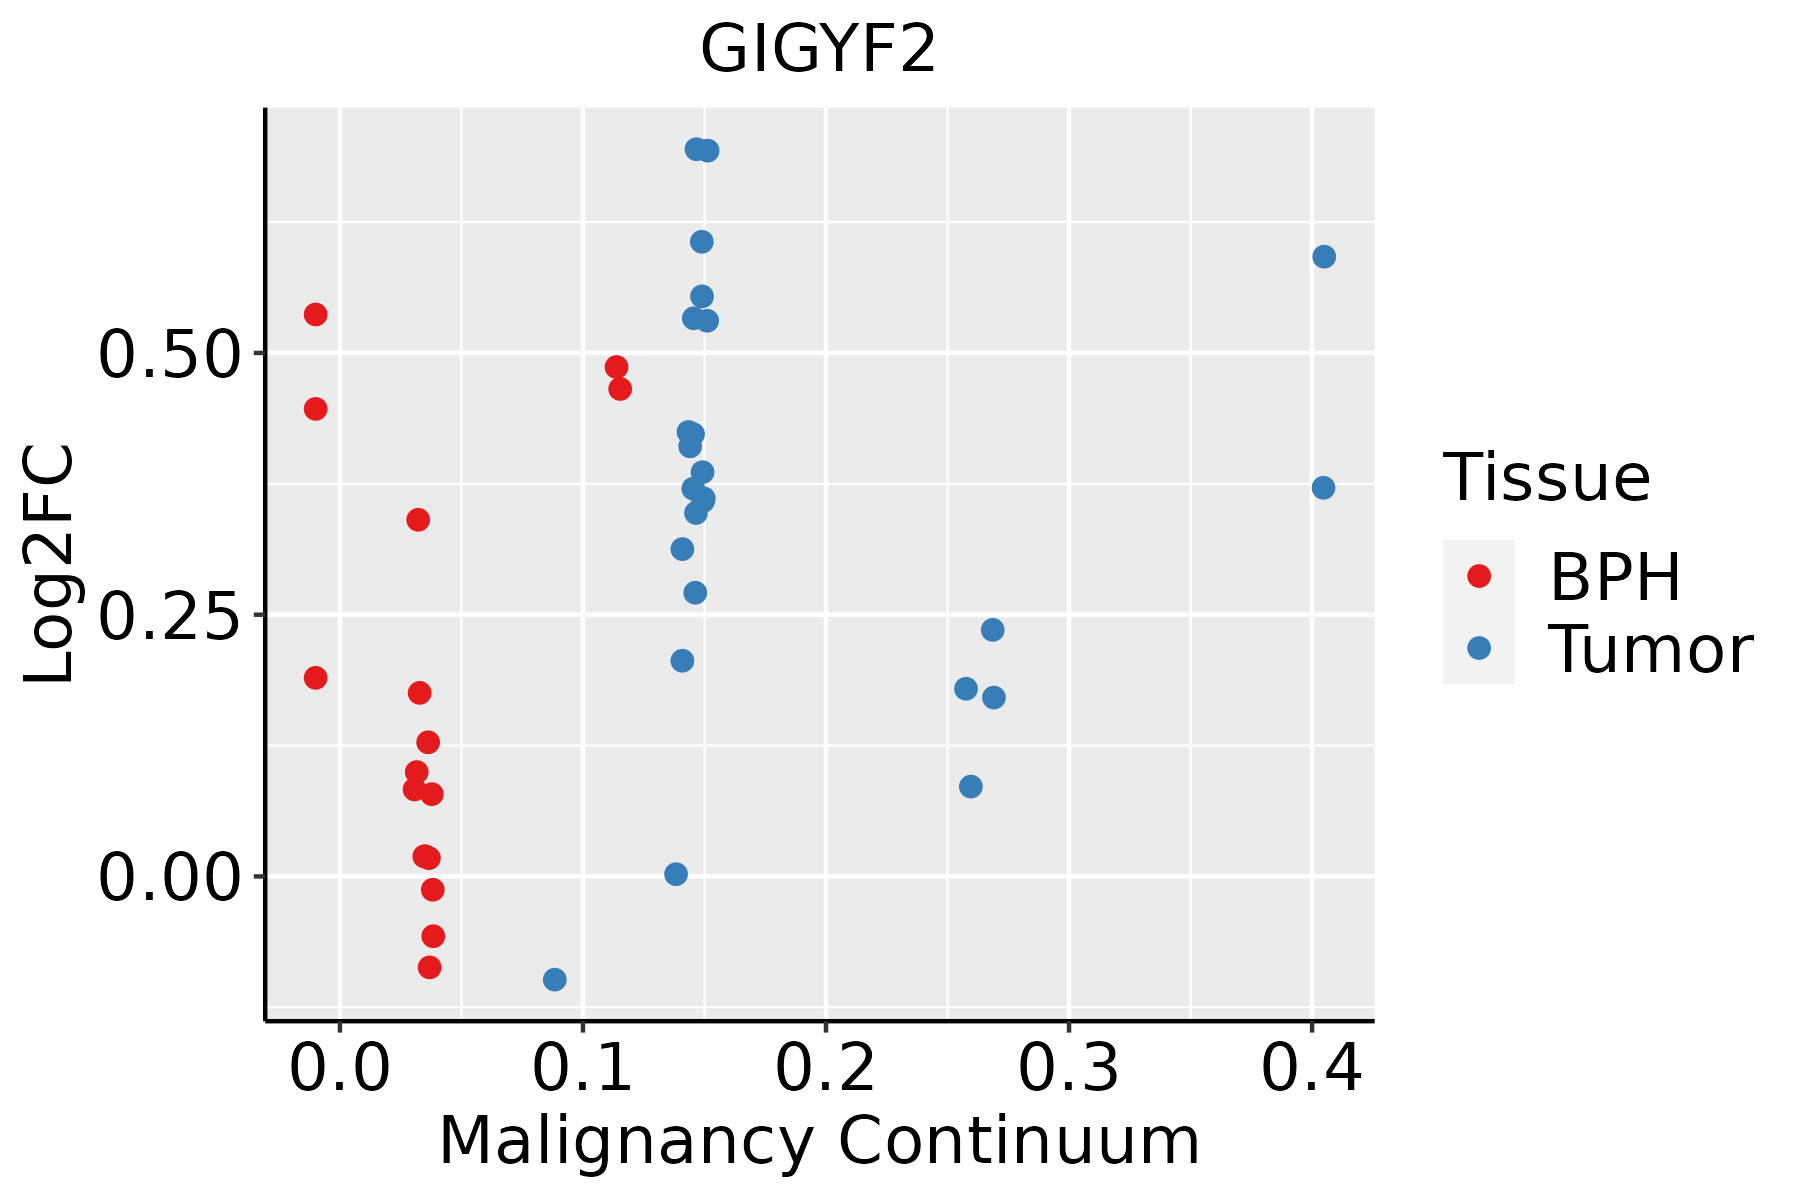 | BPH: Benign Prostatic Hyperplasia |
| Skin | 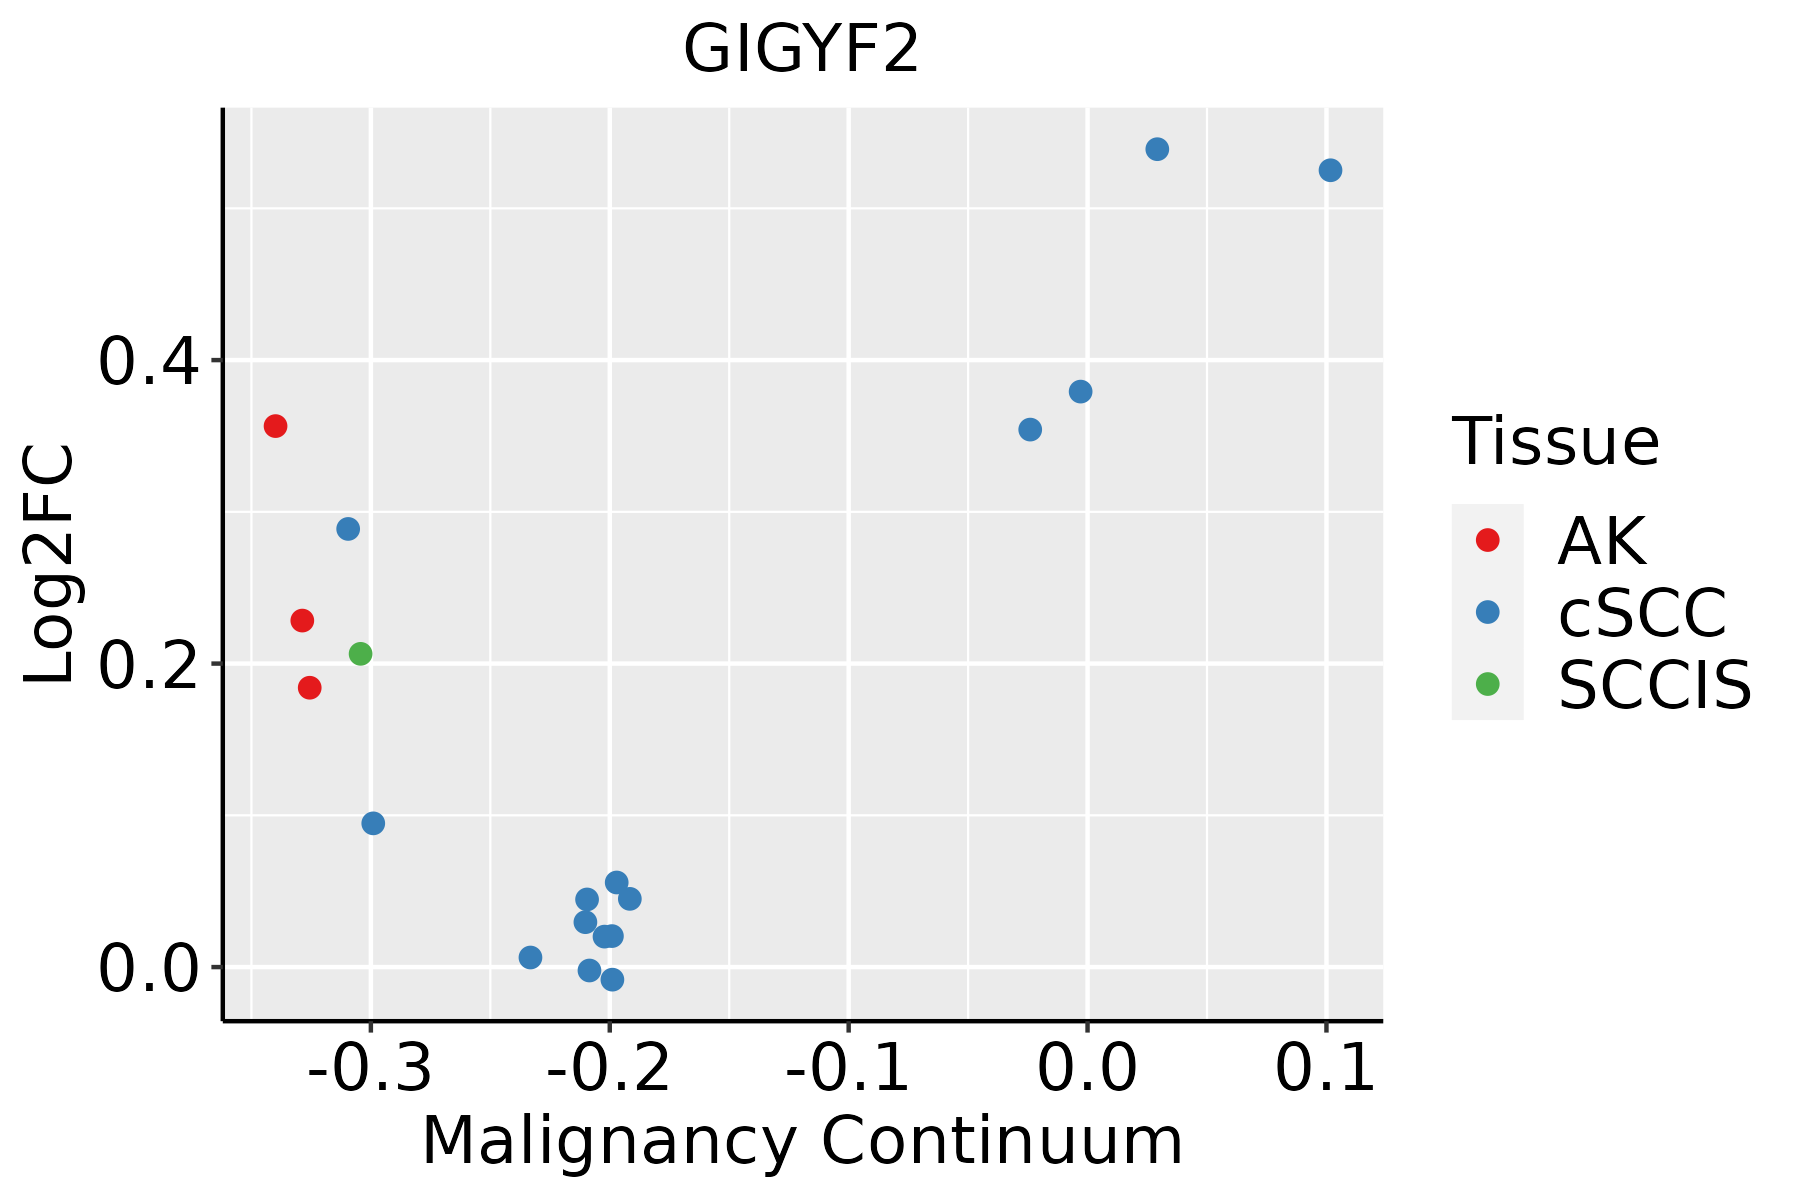 | AK: Actinic keratosis |
| cSCC: Cutaneous squamous cell carcinoma |
| SCCIS:squamous cell carcinoma in situ |
| Thyroid | 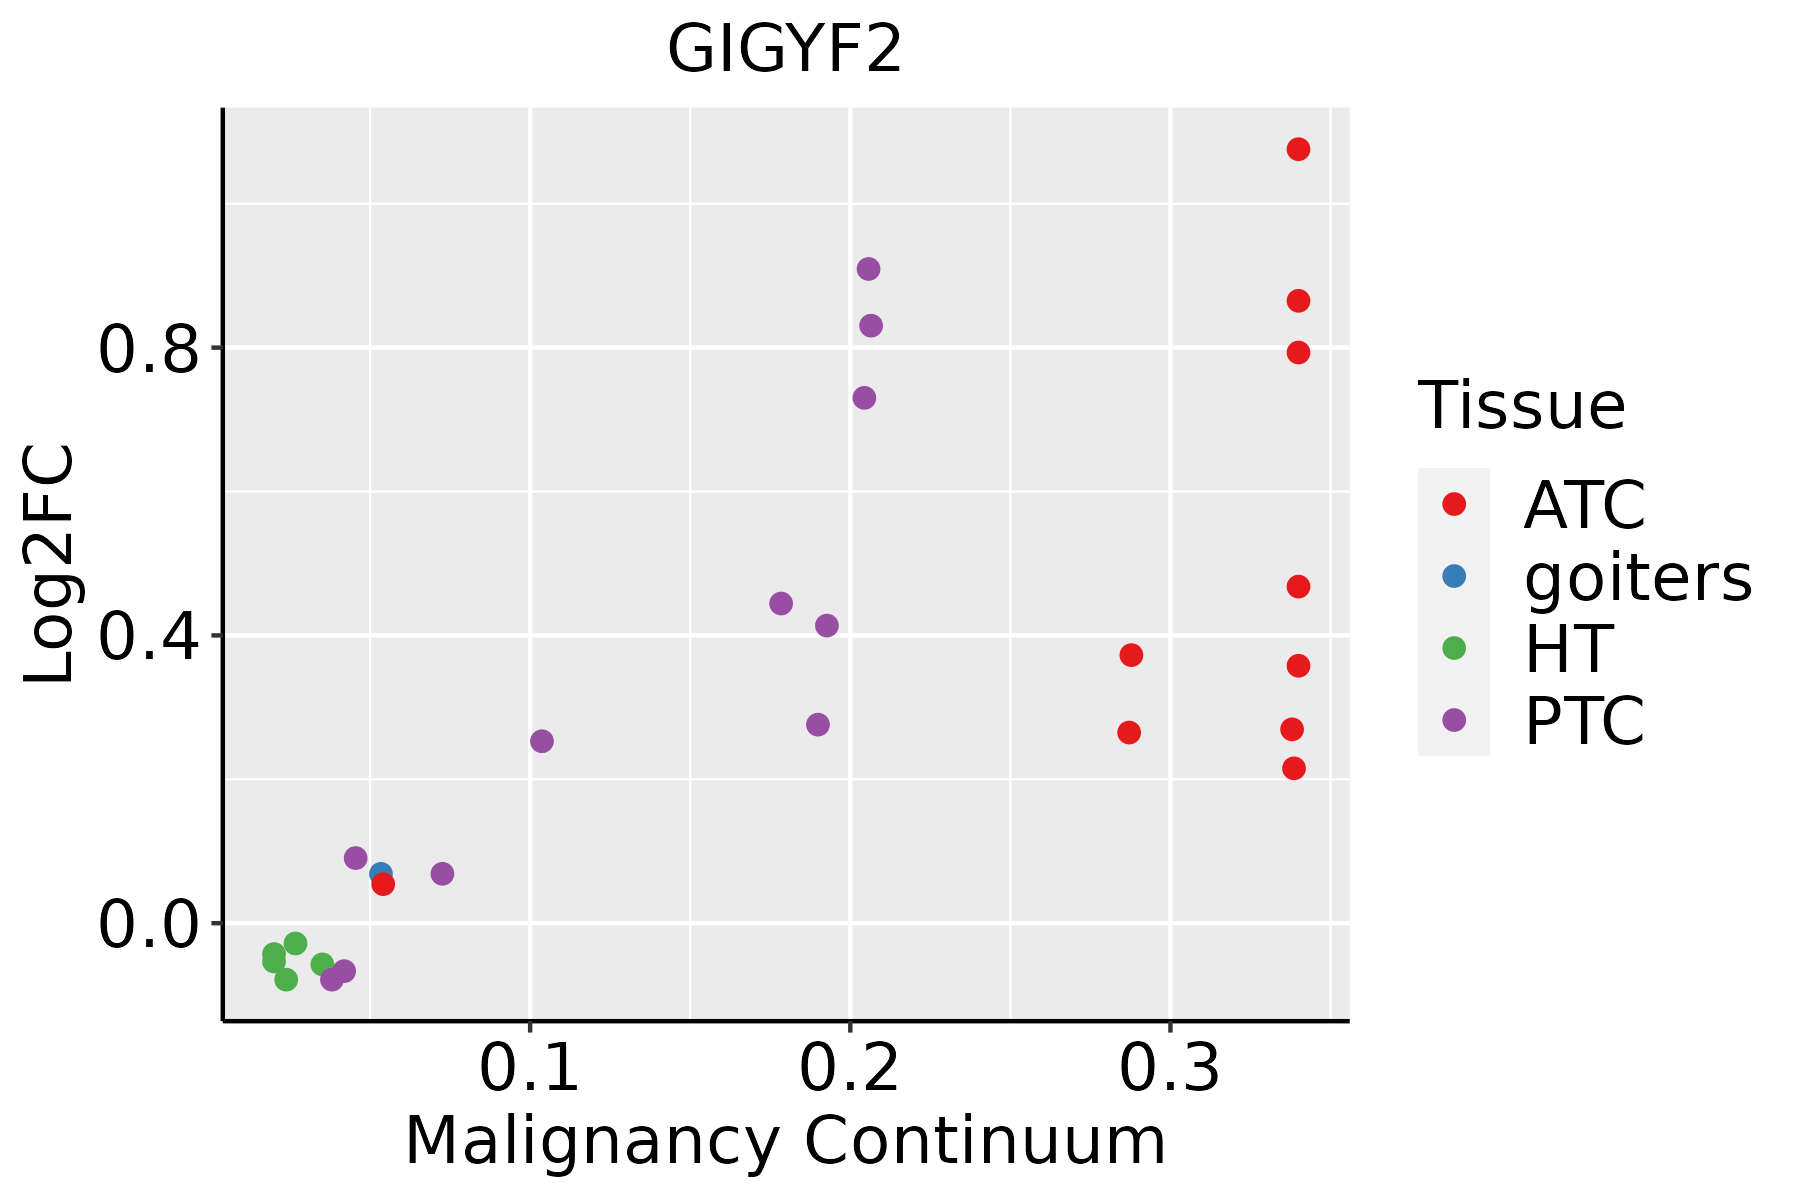 | ATC: Anaplastic thyroid cancer |
| HT: Hashimoto's thyroiditis |
| PTC: Papillary thyroid cancer |
| GO ID | Tissue | Disease Stage | Description | Gene Ratio | Bg Ratio | pvalue | p.adjust | Count |
| GO:0031331113 | Thyroid | PTC | positive regulation of cellular catabolic process | 249/5968 | 427/18723 | 5.28e-30 | 3.58e-27 | 249 |
| GO:1903311112 | Thyroid | PTC | regulation of mRNA metabolic process | 181/5968 | 288/18723 | 1.60e-27 | 5.94e-25 | 181 |
| GO:0006401112 | Thyroid | PTC | RNA catabolic process | 163/5968 | 278/18723 | 2.13e-20 | 3.27e-18 | 163 |
| GO:0006402112 | Thyroid | PTC | mRNA catabolic process | 139/5968 | 232/18723 | 9.59e-19 | 1.12e-16 | 139 |
| GO:0006417113 | Thyroid | PTC | regulation of translation | 236/5968 | 468/18723 | 2.70e-17 | 2.52e-15 | 236 |
| GO:0034655112 | Thyroid | PTC | nucleobase-containing compound catabolic process | 211/5968 | 407/18723 | 2.72e-17 | 2.52e-15 | 211 |
| GO:0046700111 | Thyroid | PTC | heterocycle catabolic process | 221/5968 | 445/18723 | 2.43e-15 | 1.72e-13 | 221 |
| GO:0044270111 | Thyroid | PTC | cellular nitrogen compound catabolic process | 223/5968 | 451/18723 | 3.34e-15 | 2.31e-13 | 223 |
| GO:0019439111 | Thyroid | PTC | aromatic compound catabolic process | 225/5968 | 467/18723 | 8.51e-14 | 4.71e-12 | 225 |
| GO:1903313110 | Thyroid | PTC | positive regulation of mRNA metabolic process | 76/5968 | 118/18723 | 3.60e-13 | 1.80e-11 | 76 |
| GO:1901361111 | Thyroid | PTC | organic cyclic compound catabolic process | 231/5968 | 495/18723 | 2.55e-12 | 1.12e-10 | 231 |
| GO:0043487111 | Thyroid | PTC | regulation of RNA stability | 97/5968 | 170/18723 | 9.51e-12 | 3.97e-10 | 97 |
| GO:0061013111 | Thyroid | PTC | regulation of mRNA catabolic process | 94/5968 | 166/18723 | 3.55e-11 | 1.29e-09 | 94 |
| GO:000734619 | Thyroid | PTC | regulation of mitotic cell cycle | 212/5968 | 457/18723 | 4.03e-11 | 1.44e-09 | 212 |
| GO:0043488111 | Thyroid | PTC | regulation of mRNA stability | 90/5968 | 158/18723 | 5.98e-11 | 2.11e-09 | 90 |
| GO:004477218 | Thyroid | PTC | mitotic cell cycle phase transition | 196/5968 | 424/18723 | 3.17e-10 | 1.02e-08 | 196 |
| GO:006115719 | Thyroid | PTC | mRNA destabilization | 52/5968 | 84/18723 | 1.40e-08 | 3.30e-07 | 52 |
| GO:006101419 | Thyroid | PTC | positive regulation of mRNA catabolic process | 53/5968 | 87/18723 | 2.25e-08 | 5.16e-07 | 53 |
| GO:005077919 | Thyroid | PTC | RNA destabilization | 53/5968 | 88/18723 | 3.91e-08 | 8.51e-07 | 53 |
| GO:19019908 | Thyroid | PTC | regulation of mitotic cell cycle phase transition | 138/5968 | 299/18723 | 1.44e-07 | 2.78e-06 | 138 |
| Hugo Symbol | Variant Class | Variant Classification | dbSNP RS | HGVSc | HGVSp | HGVSp Short | SWISSPROT | BIOTYPE | SIFT | PolyPhen | Tumor Sample Barcode | Tissue | Histology | Sex | Age | Stage | Therapy Types | Drugs | Outcome |
| GIGYF2 | SNV | Missense_Mutation | novel | c.2206N>T | p.Asp736Tyr | p.D736Y | Q6Y7W6 | protein_coding | deleterious(0.01) | probably_damaging(0.999) | TCGA-A7-A4SF-01 | Breast | breast invasive carcinoma | Female | <65 | I/II | Chemotherapy | carboplatin | CR |
| GIGYF2 | SNV | Missense_Mutation | | c.1021N>A | p.Glu341Lys | p.E341K | Q6Y7W6 | protein_coding | deleterious(0) | probably_damaging(0.998) | TCGA-D8-A1J8-01 | Breast | breast invasive carcinoma | Female | >=65 | I/II | Hormone Therapy | nolvadex | SD |
| GIGYF2 | SNV | Missense_Mutation | rs372418931 | c.3059N>T | p.Thr1020Met | p.T1020M | Q6Y7W6 | protein_coding | tolerated(0.46) | benign(0.441) | TCGA-E2-A15C-01 | Breast | breast invasive carcinoma | Female | <65 | I/II | Hormone Therapy | arimidex | SD |
| GIGYF2 | insertion | Nonsense_Mutation | novel | c.3493_3494insTCTCCTGGGCTGGAATGTAGCTAGGACT | p.His1165LeufsTer7 | p.H1165Lfs*7 | Q6Y7W6 | protein_coding | | | TCGA-A8-A07J-01 | Breast | breast invasive carcinoma | Female | <65 | I/II | Chemotherapy | 5-fluorouracil | CR |
| GIGYF2 | deletion | Frame_Shift_Del | | c.734delN | p.Ala245ValfsTer56 | p.A245Vfs*56 | Q6Y7W6 | protein_coding | | | TCGA-D8-A1JK-01 | Breast | breast invasive carcinoma | Female | >=65 | I/II | Unknown | Unknown | SD |
| GIGYF2 | SNV | Missense_Mutation | | c.3323N>A | p.Gly1108Glu | p.G1108E | Q6Y7W6 | protein_coding | deleterious(0) | benign(0.015) | TCGA-C5-A1MH-01 | Cervix | cervical & endocervical cancer | Female | >=65 | III/IV | Chemotherapy | cisplatin | PD |
| GIGYF2 | SNV | Missense_Mutation | | c.712N>A | p.Glu238Lys | p.E238K | Q6Y7W6 | protein_coding | tolerated(0.1) | possibly_damaging(0.776) | TCGA-DR-A0ZM-01 | Cervix | cervical & endocervical cancer | Female | <65 | III/IV | Unspecific | Cisplatin | SD |
| GIGYF2 | SNV | Missense_Mutation | rs754519471 | c.2402N>A | p.Arg801Gln | p.R801Q | Q6Y7W6 | protein_coding | tolerated(0.26) | benign(0.297) | TCGA-EA-A3HS-01 | Cervix | cervical & endocervical cancer | Female | <65 | I/II | Unknown | Unknown | SD |
| GIGYF2 | SNV | Missense_Mutation | novel | c.937N>A | p.Glu313Lys | p.E313K | Q6Y7W6 | protein_coding | deleterious(0.01) | possibly_damaging(0.857) | TCGA-ZJ-AB0H-01 | Cervix | cervical & endocervical cancer | Female | <65 | III/IV | Unknown | Unknown | SD |
| GIGYF2 | SNV | Missense_Mutation | | c.2423N>A | p.Arg808Gln | p.R808Q | Q6Y7W6 | protein_coding | deleterious(0.01) | probably_damaging(0.953) | TCGA-AA-3672-01 | Colorectum | colon adenocarcinoma | Female | >=65 | III/IV | Unknown | Unknown | SD |


