
|
|||||
|
 | |
| |
| |
| |
| |
| |
|
Gene: CHP1 |
Gene summary for CHP1 |
| Gene information | Species | Human | Gene symbol | CHP1 | Gene ID | 11261 |
| Gene name | calcineurin like EF-hand protein 1 | |
| Gene Alias | CHP | |
| Cytomap | 15q15.1 | |
| Gene Type | protein-coding | GO ID | GO:0000226 | UniProtAcc | A0A024R9M9 |
Top |
Malignant transformation analysis |
| Identification of the aberrant gene expression in precancerous and cancerous lesions by comparing the gene expression of stem-like cells in diseased tissues with normal stem cells |
| Entrez ID | Symbol | Replicates | Species | Organ | Tissue | Adj P-value | Log2FC | Malignancy |
| 11261 | CHP1 | HTA11_2487_2000001011 | Human | Colorectum | SER | 1.25e-14 | 1.05e+00 | -0.1808 |
| 11261 | CHP1 | HTA11_1938_2000001011 | Human | Colorectum | AD | 5.03e-23 | 1.20e+00 | -0.0811 |
| 11261 | CHP1 | HTA11_78_2000001011 | Human | Colorectum | AD | 3.63e-15 | 1.16e+00 | -0.1088 |
| 11261 | CHP1 | HTA11_347_2000001011 | Human | Colorectum | AD | 5.05e-48 | 1.51e+00 | -0.1954 |
| 11261 | CHP1 | HTA11_411_2000001011 | Human | Colorectum | SER | 1.01e-08 | 1.19e+00 | -0.2602 |
| 11261 | CHP1 | HTA11_2112_2000001011 | Human | Colorectum | SER | 5.65e-05 | 1.02e+00 | -0.2196 |
| 11261 | CHP1 | HTA11_3361_2000001011 | Human | Colorectum | AD | 1.01e-05 | 7.53e-01 | -0.1207 |
| 11261 | CHP1 | HTA11_83_2000001011 | Human | Colorectum | SER | 6.51e-20 | 1.17e+00 | -0.1526 |
| 11261 | CHP1 | HTA11_696_2000001011 | Human | Colorectum | AD | 7.53e-19 | 8.81e-01 | -0.1464 |
| 11261 | CHP1 | HTA11_866_2000001011 | Human | Colorectum | AD | 1.29e-07 | 5.82e-01 | -0.1001 |
| 11261 | CHP1 | HTA11_1391_2000001011 | Human | Colorectum | AD | 3.21e-22 | 1.24e+00 | -0.059 |
| 11261 | CHP1 | HTA11_2992_2000001011 | Human | Colorectum | SER | 1.66e-09 | 1.12e+00 | -0.1706 |
| 11261 | CHP1 | HTA11_5212_2000001011 | Human | Colorectum | AD | 5.49e-19 | 1.34e+00 | -0.2061 |
| 11261 | CHP1 | HTA11_5216_2000001011 | Human | Colorectum | SER | 2.25e-05 | 1.12e+00 | -0.1462 |
| 11261 | CHP1 | HTA11_7862_2000001011 | Human | Colorectum | AD | 4.89e-03 | 6.70e-01 | -0.0179 |
| 11261 | CHP1 | HTA11_6801_2000001011 | Human | Colorectum | SER | 4.19e-03 | 7.88e-01 | 0.0171 |
| 11261 | CHP1 | HTA11_99999970781_79442 | Human | Colorectum | MSS | 2.87e-04 | 4.29e-01 | 0.294 |
| 11261 | CHP1 | HTA11_99999965062_69753 | Human | Colorectum | MSI-H | 1.07e-03 | 1.03e+00 | 0.3487 |
| 11261 | CHP1 | F007 | Human | Colorectum | FAP | 1.75e-09 | -5.24e-01 | 0.1176 |
| 11261 | CHP1 | A001-C-207 | Human | Colorectum | FAP | 7.17e-07 | -3.74e-01 | 0.1278 |
| Page: 1 2 3 4 5 6 7 8 9 |
| Tissue | Expression Dynamics | Abbreviation |
| Colorectum (GSE201348) |  | FAP: Familial adenomatous polyposis |
| CRC: Colorectal cancer | ||
| Colorectum (HTA11) |  | AD: Adenomas |
| SER: Sessile serrated lesions | ||
| MSI-H: Microsatellite-high colorectal cancer | ||
| MSS: Microsatellite stable colorectal cancer | ||
| Esophagus | 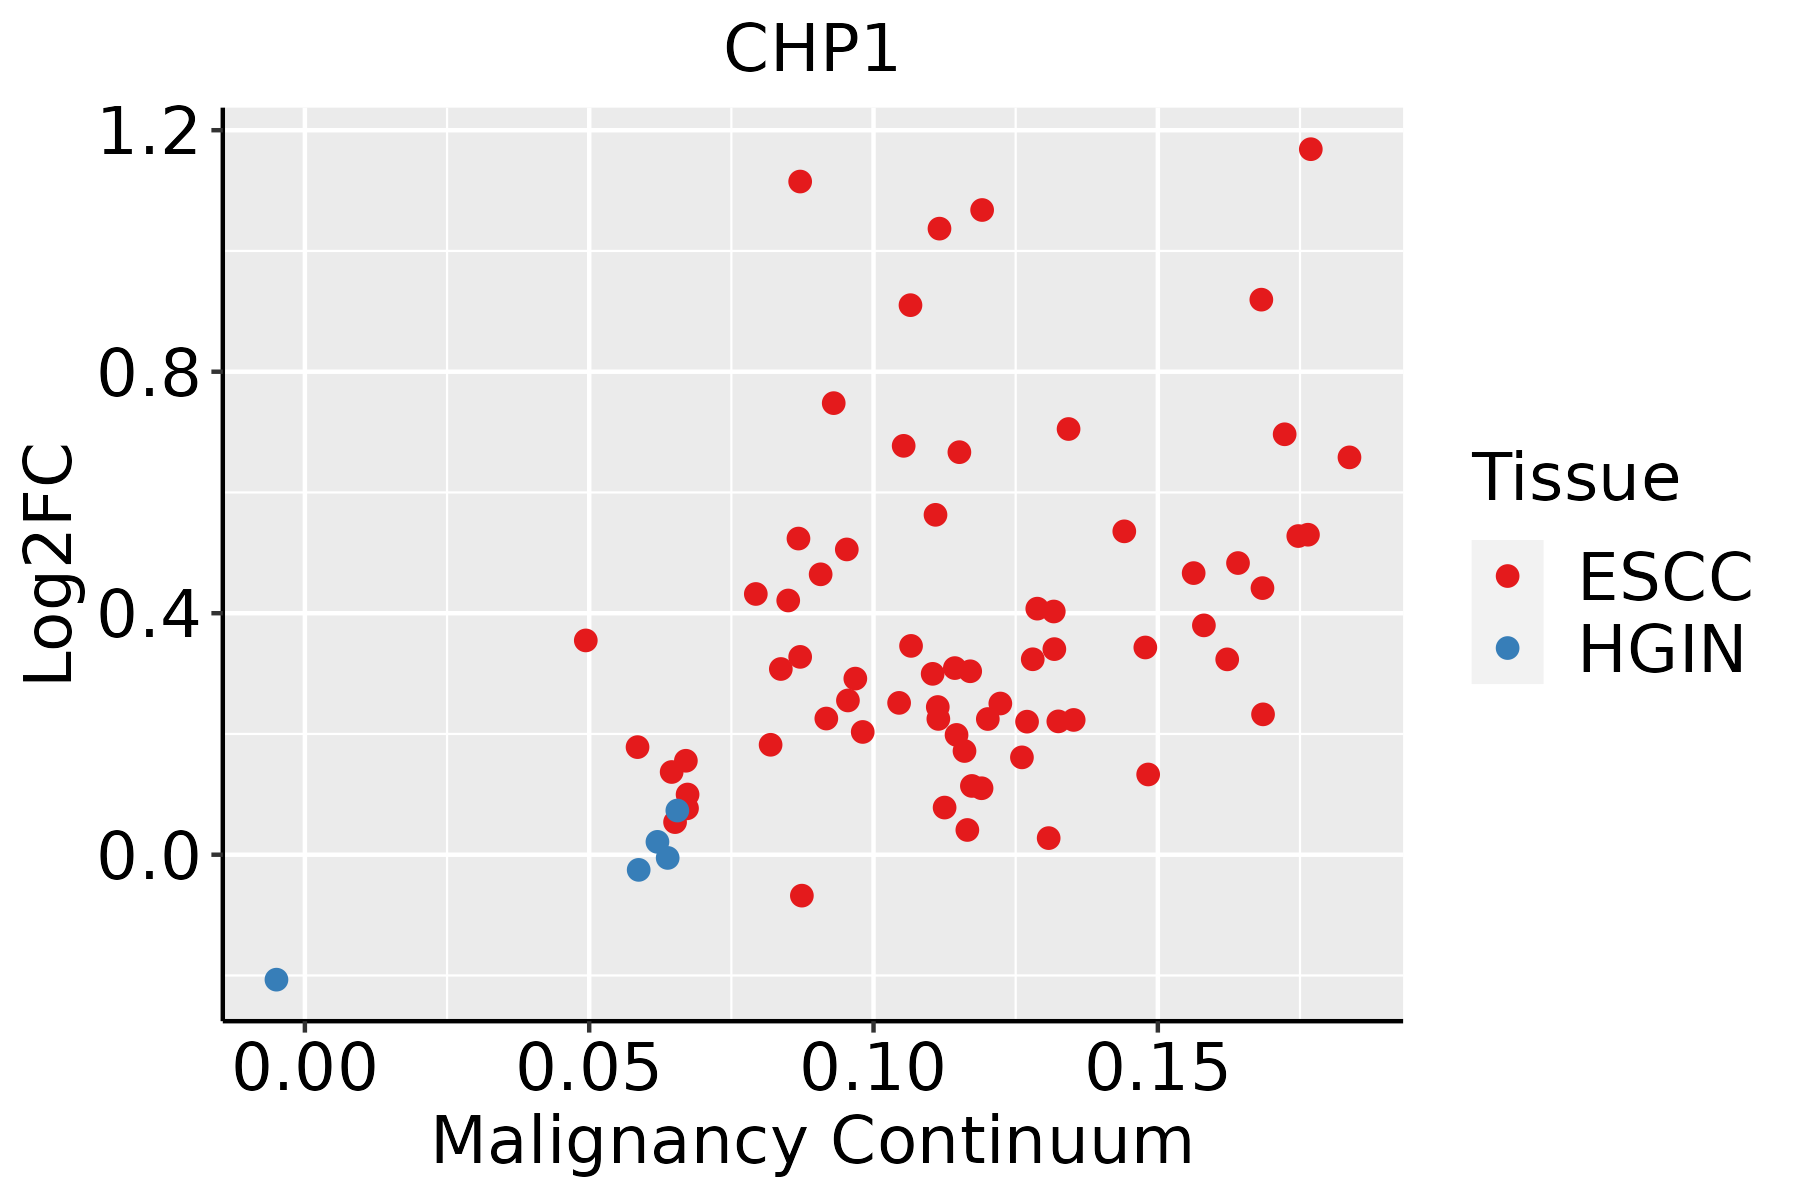 | ESCC: Esophageal squamous cell carcinoma |
| HGIN: High-grade intraepithelial neoplasias | ||
| LGIN: Low-grade intraepithelial neoplasias | ||
| Liver | 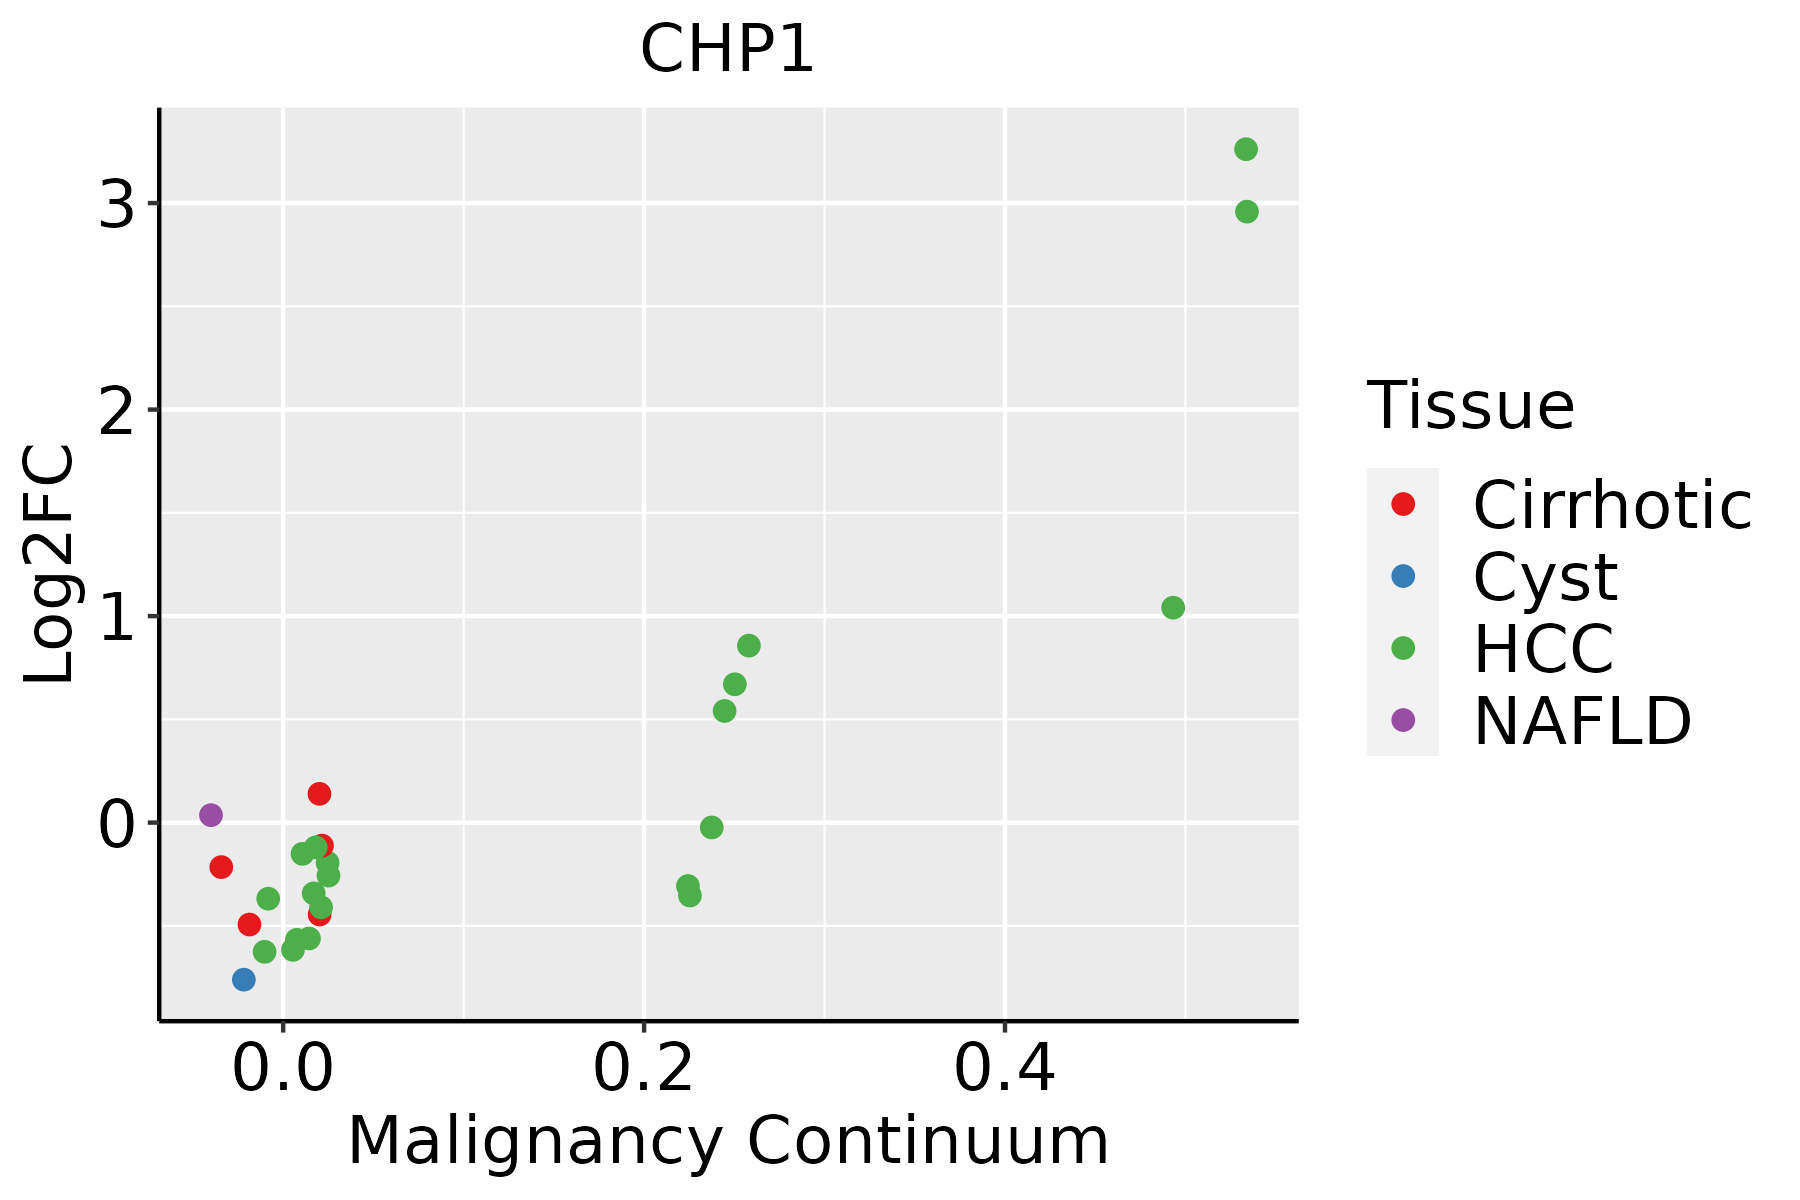 | HCC: Hepatocellular carcinoma |
| NAFLD: Non-alcoholic fatty liver disease | ||
| Oral Cavity | 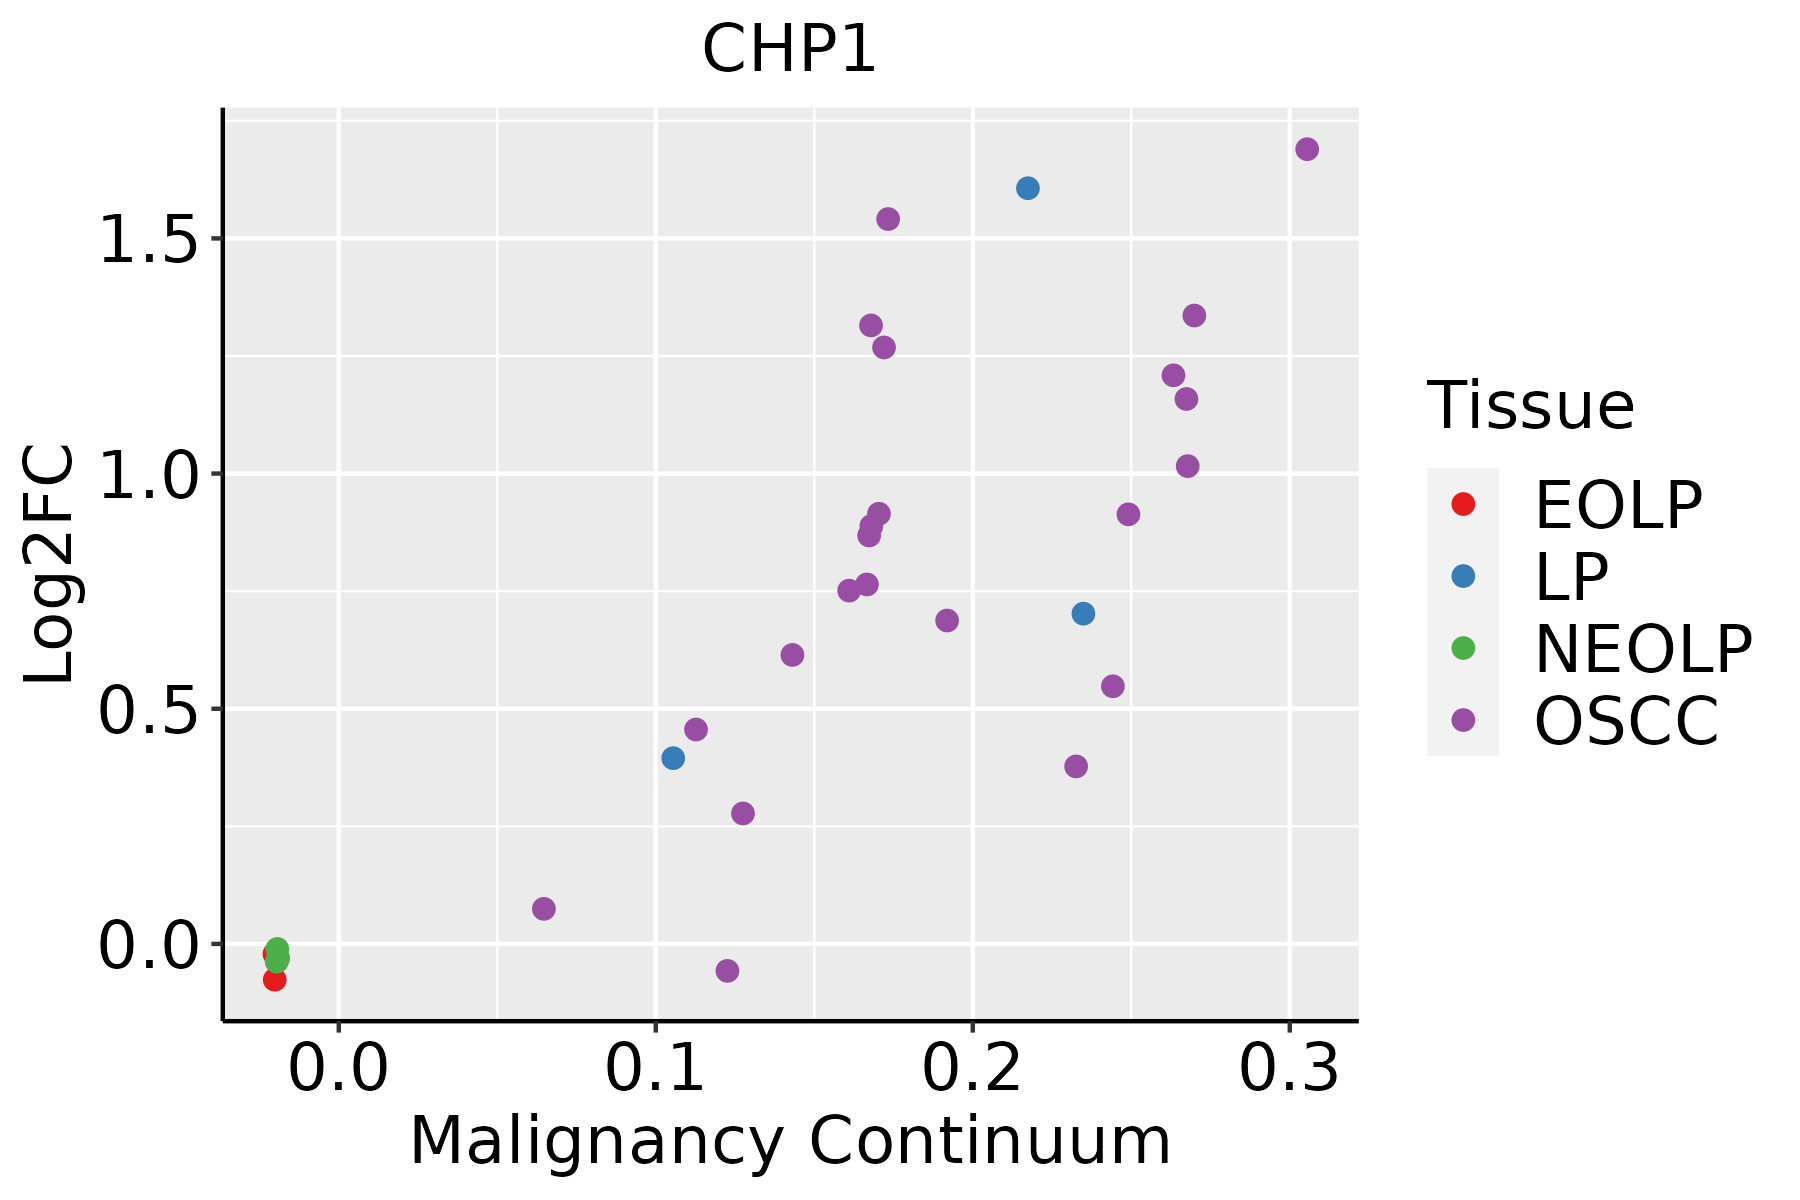 | EOLP: Erosive Oral lichen planus |
| LP: leukoplakia | ||
| NEOLP: Non-erosive oral lichen planus | ||
| OSCC: Oral squamous cell carcinoma | ||
| Skin |  | AK: Actinic keratosis |
| cSCC: Cutaneous squamous cell carcinoma | ||
| SCCIS:squamous cell carcinoma in situ | ||
| Thyroid | 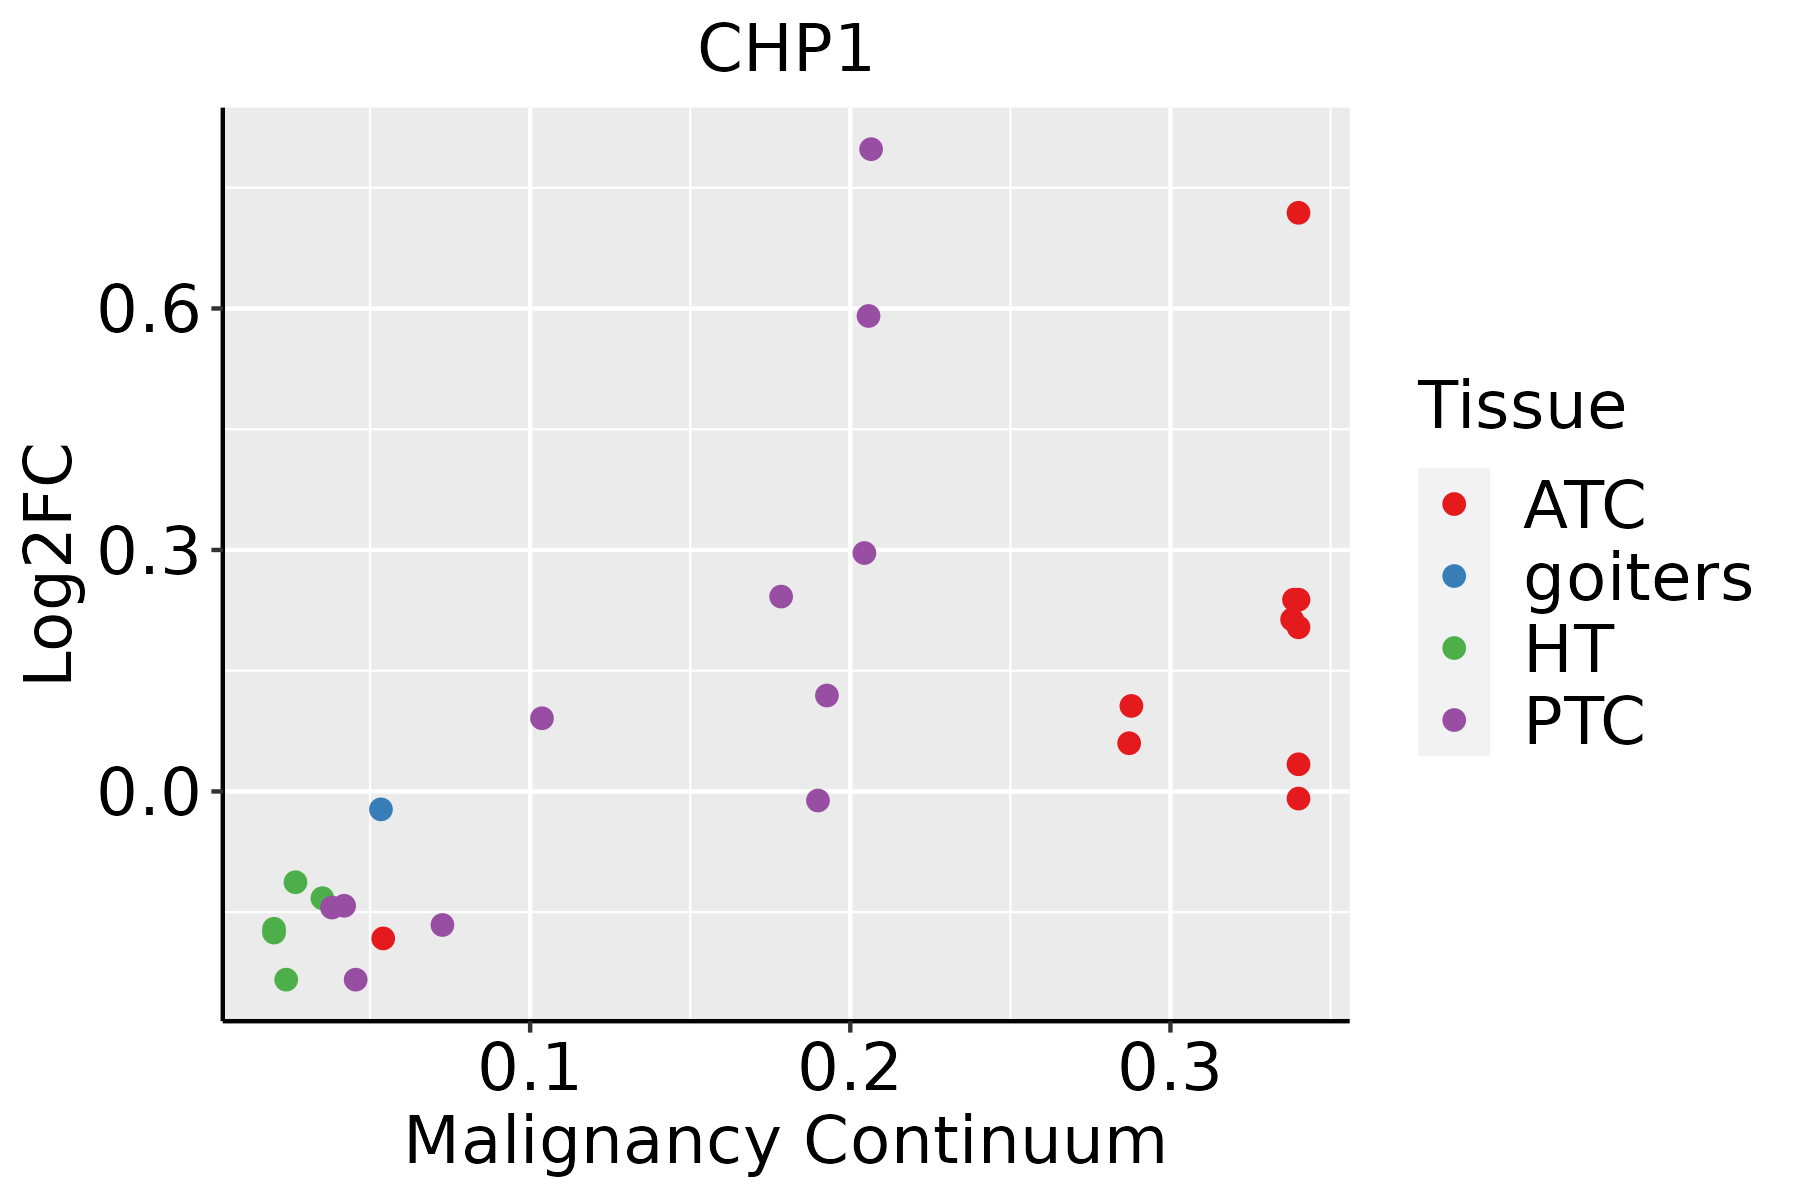 | ATC: Anaplastic thyroid cancer |
| HT: Hashimoto's thyroiditis | ||
| PTC: Papillary thyroid cancer |
| ∗log2FC in expression of this searched gene in stem-like cells from each diseased tissue sample relative to stem-like cells in normal samples in each tissue plotted against the malignancy continuum. Samples are colored based on if they are from different disease stage. |
Top |
Malignant transformation related pathway analysis |
| Find out the enriched GO biological processes and KEGG pathways involved in transition from healthy to precancer to cancer |
| Tissue | Disease Stage | Enriched GO biological Processes |
| Colorectum | AD |  |
| Colorectum | SER |  |
| Colorectum | MSS |  |
| Colorectum | MSI-H |  |
| Colorectum | FAP |  |
| ∗Top 15 enriched GO BP terms are showed in the bar plot of each disease state in each tissue. Each row represents a significant GO biological process which is colored according to the -log10(p.adjust). |
| Page: 1 2 3 4 5 6 7 8 9 |
| GO ID | Tissue | Disease Stage | Description | Gene Ratio | Bg Ratio | pvalue | p.adjust | Count |
| GO:190495122 | Liver | HCC | positive regulation of establishment of protein localization | 207/7958 | 319/18723 | 3.95e-16 | 3.29e-14 | 207 |
| GO:001605021 | Liver | HCC | vesicle organization | 194/7958 | 300/18723 | 5.58e-15 | 3.97e-13 | 194 |
| GO:005116822 | Liver | HCC | nuclear export | 113/7958 | 154/18723 | 6.30e-15 | 4.39e-13 | 113 |
| GO:005122222 | Liver | HCC | positive regulation of protein transport | 194/7958 | 303/18723 | 2.41e-14 | 1.56e-12 | 194 |
| GO:001703811 | Liver | HCC | protein import | 140/7958 | 206/18723 | 1.12e-13 | 6.46e-12 | 140 |
| GO:003139622 | Liver | HCC | regulation of protein ubiquitination | 142/7958 | 210/18723 | 1.39e-13 | 7.81e-12 | 142 |
| GO:009015012 | Liver | HCC | establishment of protein localization to membrane | 168/7958 | 260/18723 | 4.07e-13 | 2.13e-11 | 168 |
| GO:004682221 | Liver | HCC | regulation of nucleocytoplasmic transport | 81/7958 | 106/18723 | 1.11e-12 | 5.52e-11 | 81 |
| GO:001056322 | Liver | HCC | negative regulation of phosphorus metabolic process | 259/7958 | 442/18723 | 4.29e-12 | 1.92e-10 | 259 |
| GO:004593622 | Liver | HCC | negative regulation of phosphate metabolic process | 258/7958 | 441/18723 | 6.00e-12 | 2.60e-10 | 258 |
| GO:004232622 | Liver | HCC | negative regulation of phosphorylation | 227/7958 | 385/18723 | 3.98e-11 | 1.52e-09 | 227 |
| GO:005134822 | Liver | HCC | negative regulation of transferase activity | 166/7958 | 268/18723 | 8.97e-11 | 3.18e-09 | 166 |
| GO:190018012 | Liver | HCC | regulation of protein localization to nucleus | 95/7958 | 136/18723 | 9.26e-11 | 3.26e-09 | 95 |
| GO:005165621 | Liver | HCC | establishment of organelle localization | 226/7958 | 390/18723 | 4.15e-10 | 1.34e-08 | 226 |
| GO:190547511 | Liver | HCC | regulation of protein localization to membrane | 113/7958 | 175/18723 | 2.90e-09 | 7.78e-08 | 113 |
| GO:190353311 | Liver | HCC | regulation of protein targeting | 60/7958 | 81/18723 | 7.70e-09 | 1.94e-07 | 60 |
| GO:003367322 | Liver | HCC | negative regulation of kinase activity | 144/7958 | 237/18723 | 9.76e-09 | 2.45e-07 | 144 |
| GO:000193322 | Liver | HCC | negative regulation of protein phosphorylation | 196/7958 | 342/18723 | 1.95e-08 | 4.63e-07 | 196 |
| GO:005117011 | Liver | HCC | import into nucleus | 102/7958 | 159/18723 | 2.78e-08 | 6.39e-07 | 102 |
| GO:005165021 | Liver | HCC | establishment of vesicle localization | 103/7958 | 161/18723 | 2.94e-08 | 6.69e-07 | 103 |
| Page: 1 2 3 4 5 6 7 8 9 10 11 12 13 14 15 16 17 18 19 20 21 22 23 24 25 26 27 28 29 30 31 32 33 34 35 36 37 38 39 40 41 42 43 44 45 46 47 48 49 50 51 52 53 |
| Pathway ID | Tissue | Disease Stage | Description | Gene Ratio | Bg Ratio | pvalue | p.adjust | qvalue | Count |
| Page: 1 |
Top |
Cell-cell communication analysis |
| Identification of potential cell-cell interactions between two cell types and their ligand-receptor pairs for different disease states |
| Ligand | Receptor | LRpair | Pathway | Tissue | Disease Stage |
| Page: 1 |
Top |
Single-cell gene regulatory network inference analysis |
| Find out the significant the regulons (TFs) and the target genes of each regulon across cell types for different disease states |
| TF | Cell Type | Tissue | Disease Stage | Target Gene | RSS | Regulon Activity |
| ∗The dot plots of a searched regulon are shown for all cell subpopulations in each disease state of each tissue based on the regulon specific score inferred using pySCENIC and by calculating the average expression. |
| Page: 1 |
Top |
Somatic mutation of malignant transformation related genes |
| Annotation of somatic variants for genes involved in malignant transformation |
| Hugo Symbol | Variant Class | Variant Classification | dbSNP RS | HGVSc | HGVSp | HGVSp Short | SWISSPROT | BIOTYPE | SIFT | PolyPhen | Tumor Sample Barcode | Tissue | Histology | Sex | Age | Stage | Therapy Types | Drugs | Outcome |
| CHP1 | SNV | Missense_Mutation | rs79101281 | c.466N>A | p.Ala156Thr | p.A156T | Q99653 | protein_coding | tolerated(0.18) | benign(0.025) | TCGA-BH-A18G-01 | Breast | breast invasive carcinoma | Female | >=65 | I/II | Unknown | Unknown | SD |
| CHP1 | deletion | Frame_Shift_Del | novel | c.298delN | p.Asp101MetfsTer2 | p.D101Mfs*2 | Q99653 | protein_coding | TCGA-D8-A27V-01 | Breast | breast invasive carcinoma | Female | <65 | I/II | Hormone Therapy | tamoxiphen | SD | ||
| CHP1 | SNV | Missense_Mutation | c.73N>T | p.His25Tyr | p.H25Y | Q99653 | protein_coding | deleterious(0.04) | benign(0.068) | TCGA-JW-A5VL-01 | Cervix | cervical & endocervical cancer | Female | <65 | I/II | Unknown | Unknown | SD | |
| CHP1 | SNV | Missense_Mutation | novel | c.280N>A | p.Glu94Lys | p.E94K | Q99653 | protein_coding | tolerated(0.58) | benign(0.001) | TCGA-ZJ-AAXT-01 | Cervix | cervical & endocervical cancer | Female | <65 | III/IV | Unknown | Unknown | SD |
| CHP1 | SNV | Missense_Mutation | rs767999244 | c.254G>A | p.Arg85Gln | p.R85Q | Q99653 | protein_coding | tolerated(0.09) | benign(0.154) | TCGA-EI-6917-01 | Colorectum | rectum adenocarcinoma | Male | <65 | III/IV | Chemotherapy | 5fluorouracil+oxaciplatina+l-folinian | SD |
| CHP1 | SNV | Missense_Mutation | rs770704424 | c.419G>A | p.Arg140His | p.R140H | Q99653 | protein_coding | tolerated(0.32) | benign(0.006) | TCGA-EI-6917-01 | Colorectum | rectum adenocarcinoma | Male | <65 | III/IV | Chemotherapy | 5fluorouracil+oxaciplatina+l-folinian | SD |
| CHP1 | SNV | Missense_Mutation | novel | c.580N>A | p.Leu194Ile | p.L194I | Q99653 | protein_coding | deleterious(0.02) | probably_damaging(0.966) | TCGA-A5-A0G2-01 | Endometrium | uterine corpus endometrioid carcinoma | Female | <65 | III/IV | Unknown | Unknown | SD |
| CHP1 | SNV | Missense_Mutation | c.329G>A | p.Ser110Asn | p.S110N | Q99653 | protein_coding | tolerated(0.09) | benign(0.007) | TCGA-A5-A0GP-01 | Endometrium | uterine corpus endometrioid carcinoma | Female | <65 | I/II | Unknown | Unknown | SD | |
| CHP1 | SNV | Missense_Mutation | novel | c.580N>A | p.Leu194Ile | p.L194I | Q99653 | protein_coding | deleterious(0.02) | probably_damaging(0.966) | TCGA-B5-A1MR-01 | Endometrium | uterine corpus endometrioid carcinoma | Female | >=65 | III/IV | Unknown | Unknown | SD |
| CHP1 | SNV | Missense_Mutation | c.292N>G | p.Lys98Glu | p.K98E | Q99653 | protein_coding | tolerated(0.35) | benign(0) | TCGA-BS-A0UJ-01 | Endometrium | uterine corpus endometrioid carcinoma | Female | >=65 | I/II | Unknown | Unknown | SD |
| Page: 1 2 |
Top |
Related drugs of malignant transformation related genes |
| Identification of chemicals and drugs interact with genes involved in malignant transfromation |
| (DGIdb 4.0) |
| Entrez ID | Symbol | Category | Interaction Types | Drug Claim Name | Drug Name | PMIDs |
| Page: 1 |

Copyright 2023-Present -The University of Texas Health Science Center at Houston |