
|
|||||
|
 | |
| |
| |
| |
| |
| |
|
Gene: CFLAR |
Gene summary for CFLAR |
| Gene information | Species | Human | Gene symbol | CFLAR | Gene ID | 8837 |
| Gene name | CASP8 and FADD like apoptosis regulator | |
| Gene Alias | CASH | |
| Cytomap | 2q33.1 | |
| Gene Type | protein-coding | GO ID | GO:0000165 | UniProtAcc | A0A024R3Z7 |
Top |
Malignant transformation analysis |
| Identification of the aberrant gene expression in precancerous and cancerous lesions by comparing the gene expression of stem-like cells in diseased tissues with normal stem cells |
| Entrez ID | Symbol | Replicates | Species | Organ | Tissue | Adj P-value | Log2FC | Malignancy |
| 8837 | CFLAR | LZE4T | Human | Esophagus | ESCC | 1.34e-02 | 2.63e-01 | 0.0811 |
| 8837 | CFLAR | LZE5T | Human | Esophagus | ESCC | 9.82e-03 | 3.10e-01 | 0.0514 |
| 8837 | CFLAR | LZE7T | Human | Esophagus | ESCC | 5.32e-10 | 5.94e-01 | 0.0667 |
| 8837 | CFLAR | LZE8T | Human | Esophagus | ESCC | 6.04e-05 | 1.73e-01 | 0.067 |
| 8837 | CFLAR | LZE20T | Human | Esophagus | ESCC | 9.49e-09 | 4.60e-01 | 0.0662 |
| 8837 | CFLAR | LZE22D1 | Human | Esophagus | HGIN | 1.43e-04 | 3.95e-02 | 0.0595 |
| 8837 | CFLAR | LZE22T | Human | Esophagus | ESCC | 4.46e-04 | 6.23e-01 | 0.068 |
| 8837 | CFLAR | LZE24T | Human | Esophagus | ESCC | 3.66e-12 | 5.36e-01 | 0.0596 |
| 8837 | CFLAR | LZE6T | Human | Esophagus | ESCC | 2.62e-05 | 3.87e-01 | 0.0845 |
| 8837 | CFLAR | P1T-E | Human | Esophagus | ESCC | 1.64e-10 | 7.91e-01 | 0.0875 |
| 8837 | CFLAR | P2T-E | Human | Esophagus | ESCC | 1.93e-14 | 3.96e-01 | 0.1177 |
| 8837 | CFLAR | P4T-E | Human | Esophagus | ESCC | 2.26e-23 | 6.23e-01 | 0.1323 |
| 8837 | CFLAR | P5T-E | Human | Esophagus | ESCC | 6.10e-18 | 3.88e-01 | 0.1327 |
| 8837 | CFLAR | P8T-E | Human | Esophagus | ESCC | 1.14e-24 | 6.18e-01 | 0.0889 |
| 8837 | CFLAR | P9T-E | Human | Esophagus | ESCC | 2.03e-12 | 4.50e-01 | 0.1131 |
| 8837 | CFLAR | P10T-E | Human | Esophagus | ESCC | 2.33e-11 | 1.29e-01 | 0.116 |
| 8837 | CFLAR | P11T-E | Human | Esophagus | ESCC | 8.83e-12 | 5.16e-01 | 0.1426 |
| 8837 | CFLAR | P12T-E | Human | Esophagus | ESCC | 1.78e-19 | 3.09e-01 | 0.1122 |
| 8837 | CFLAR | P15T-E | Human | Esophagus | ESCC | 5.64e-14 | 5.15e-01 | 0.1149 |
| 8837 | CFLAR | P16T-E | Human | Esophagus | ESCC | 1.51e-15 | 6.40e-02 | 0.1153 |
| Page: 1 2 3 4 5 6 7 8 |
| Tissue | Expression Dynamics | Abbreviation |
| Esophagus | 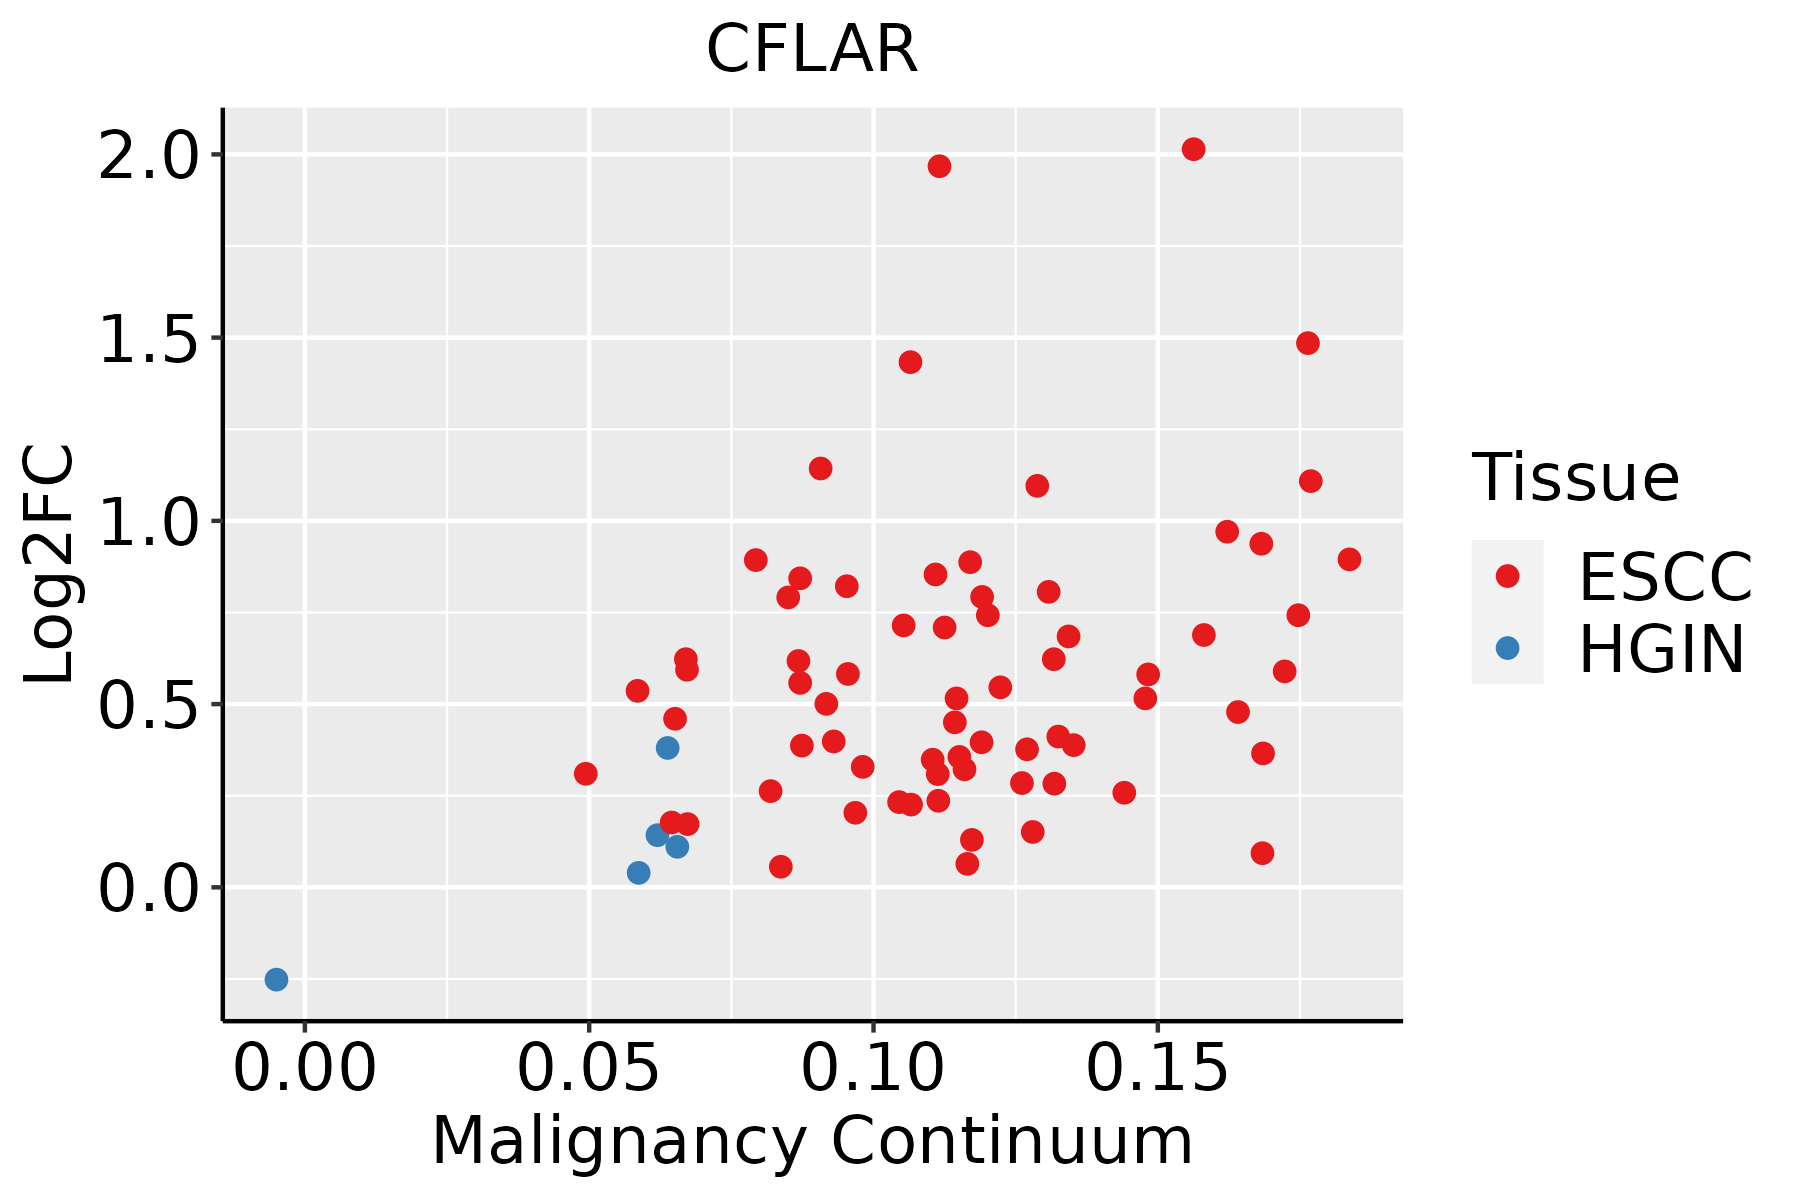 | ESCC: Esophageal squamous cell carcinoma |
| HGIN: High-grade intraepithelial neoplasias | ||
| LGIN: Low-grade intraepithelial neoplasias | ||
| Liver |  | HCC: Hepatocellular carcinoma |
| NAFLD: Non-alcoholic fatty liver disease | ||
| Lung | 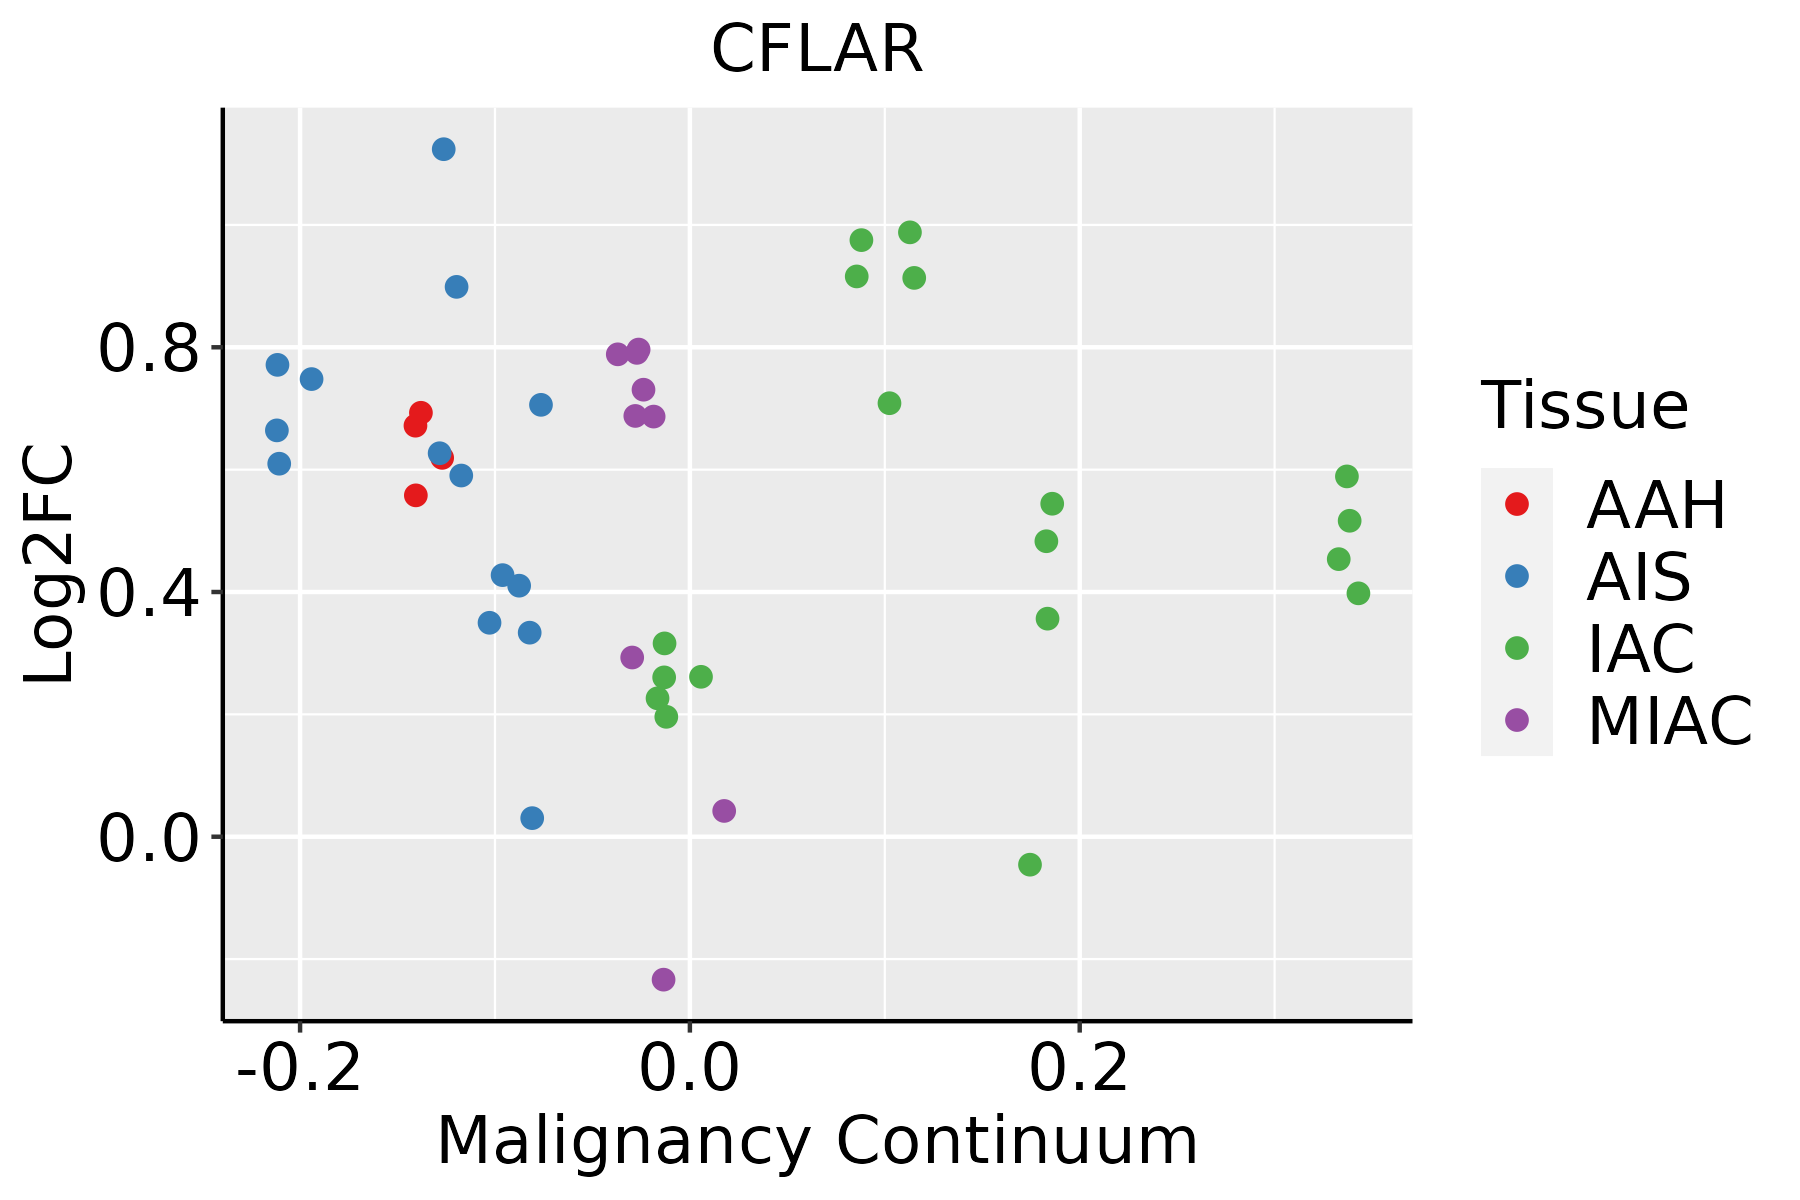 | AAH: Atypical adenomatous hyperplasia |
| AIS: Adenocarcinoma in situ | ||
| IAC: Invasive lung adenocarcinoma | ||
| MIA: Minimally invasive adenocarcinoma | ||
| Oral Cavity | 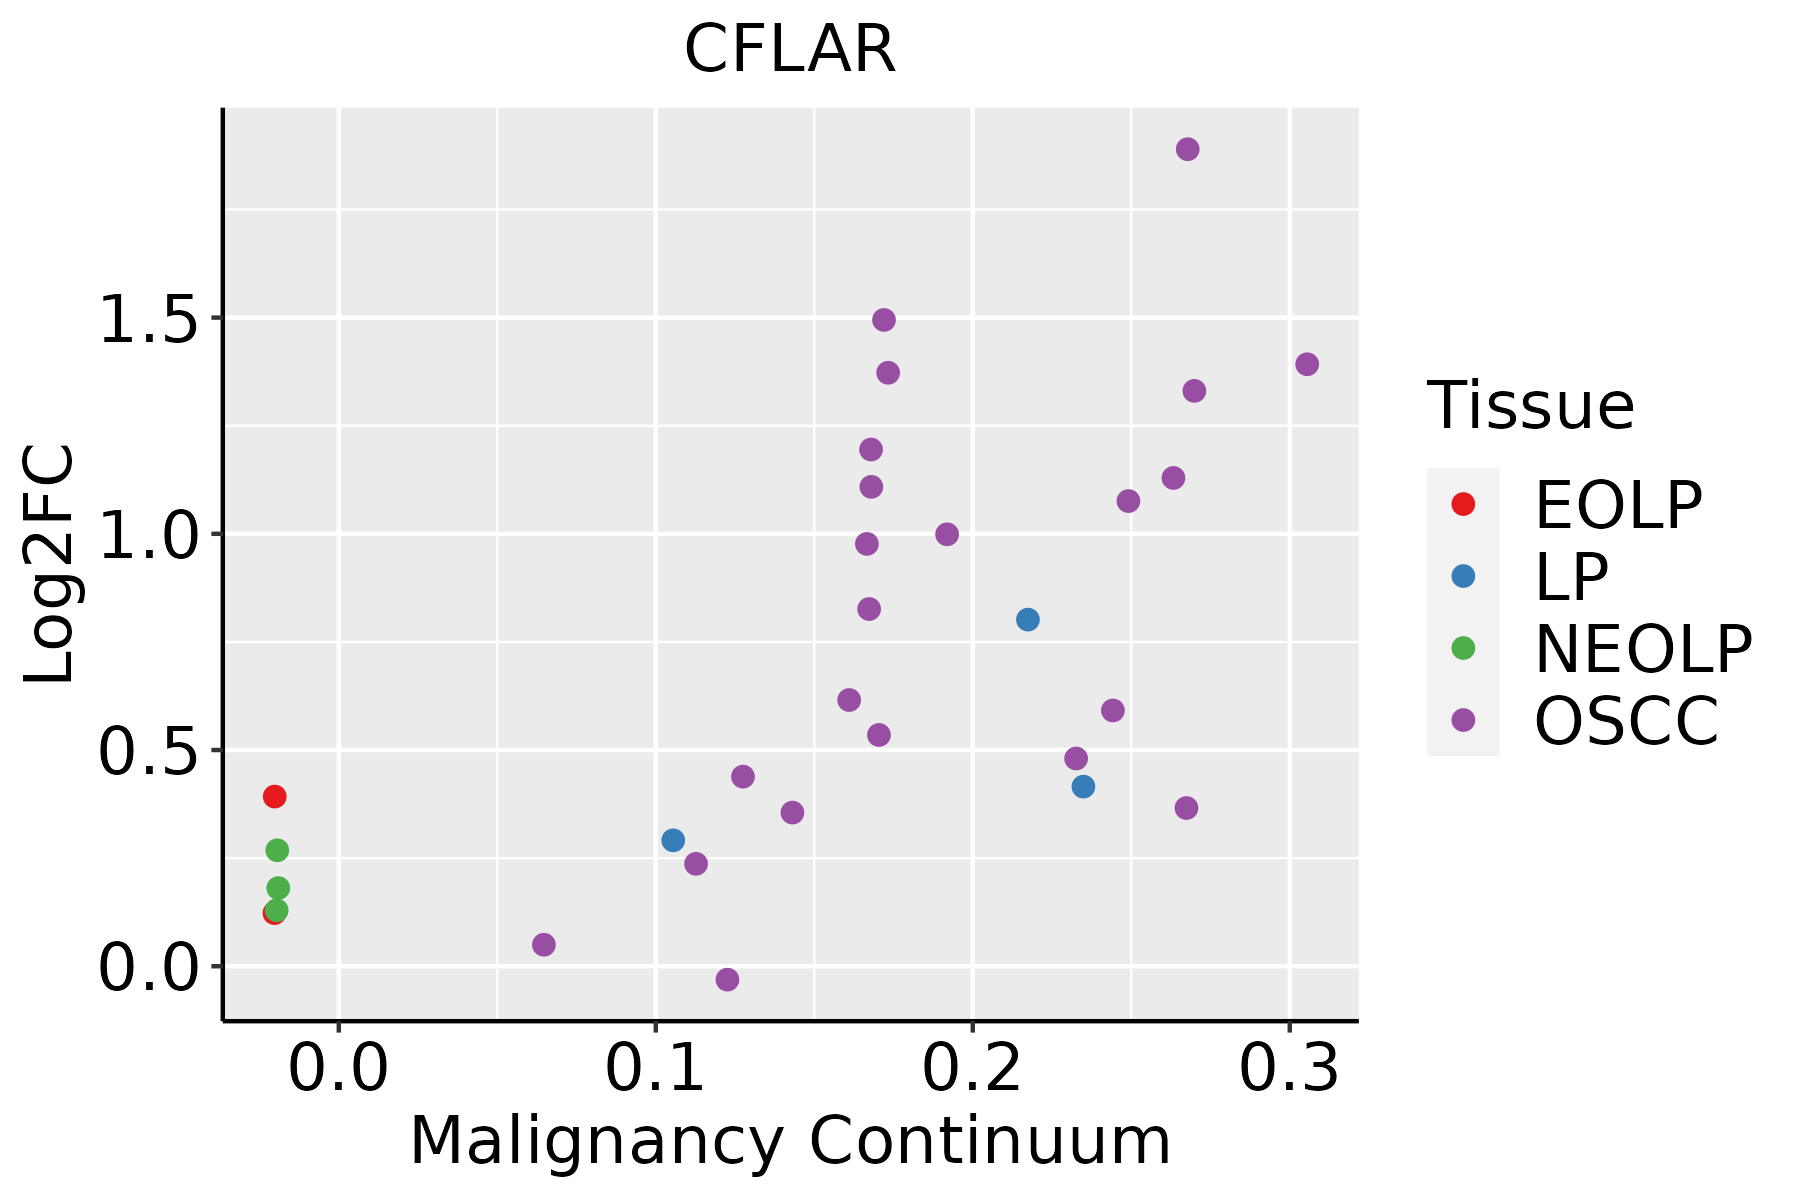 | EOLP: Erosive Oral lichen planus |
| LP: leukoplakia | ||
| NEOLP: Non-erosive oral lichen planus | ||
| OSCC: Oral squamous cell carcinoma | ||
| Prostate | 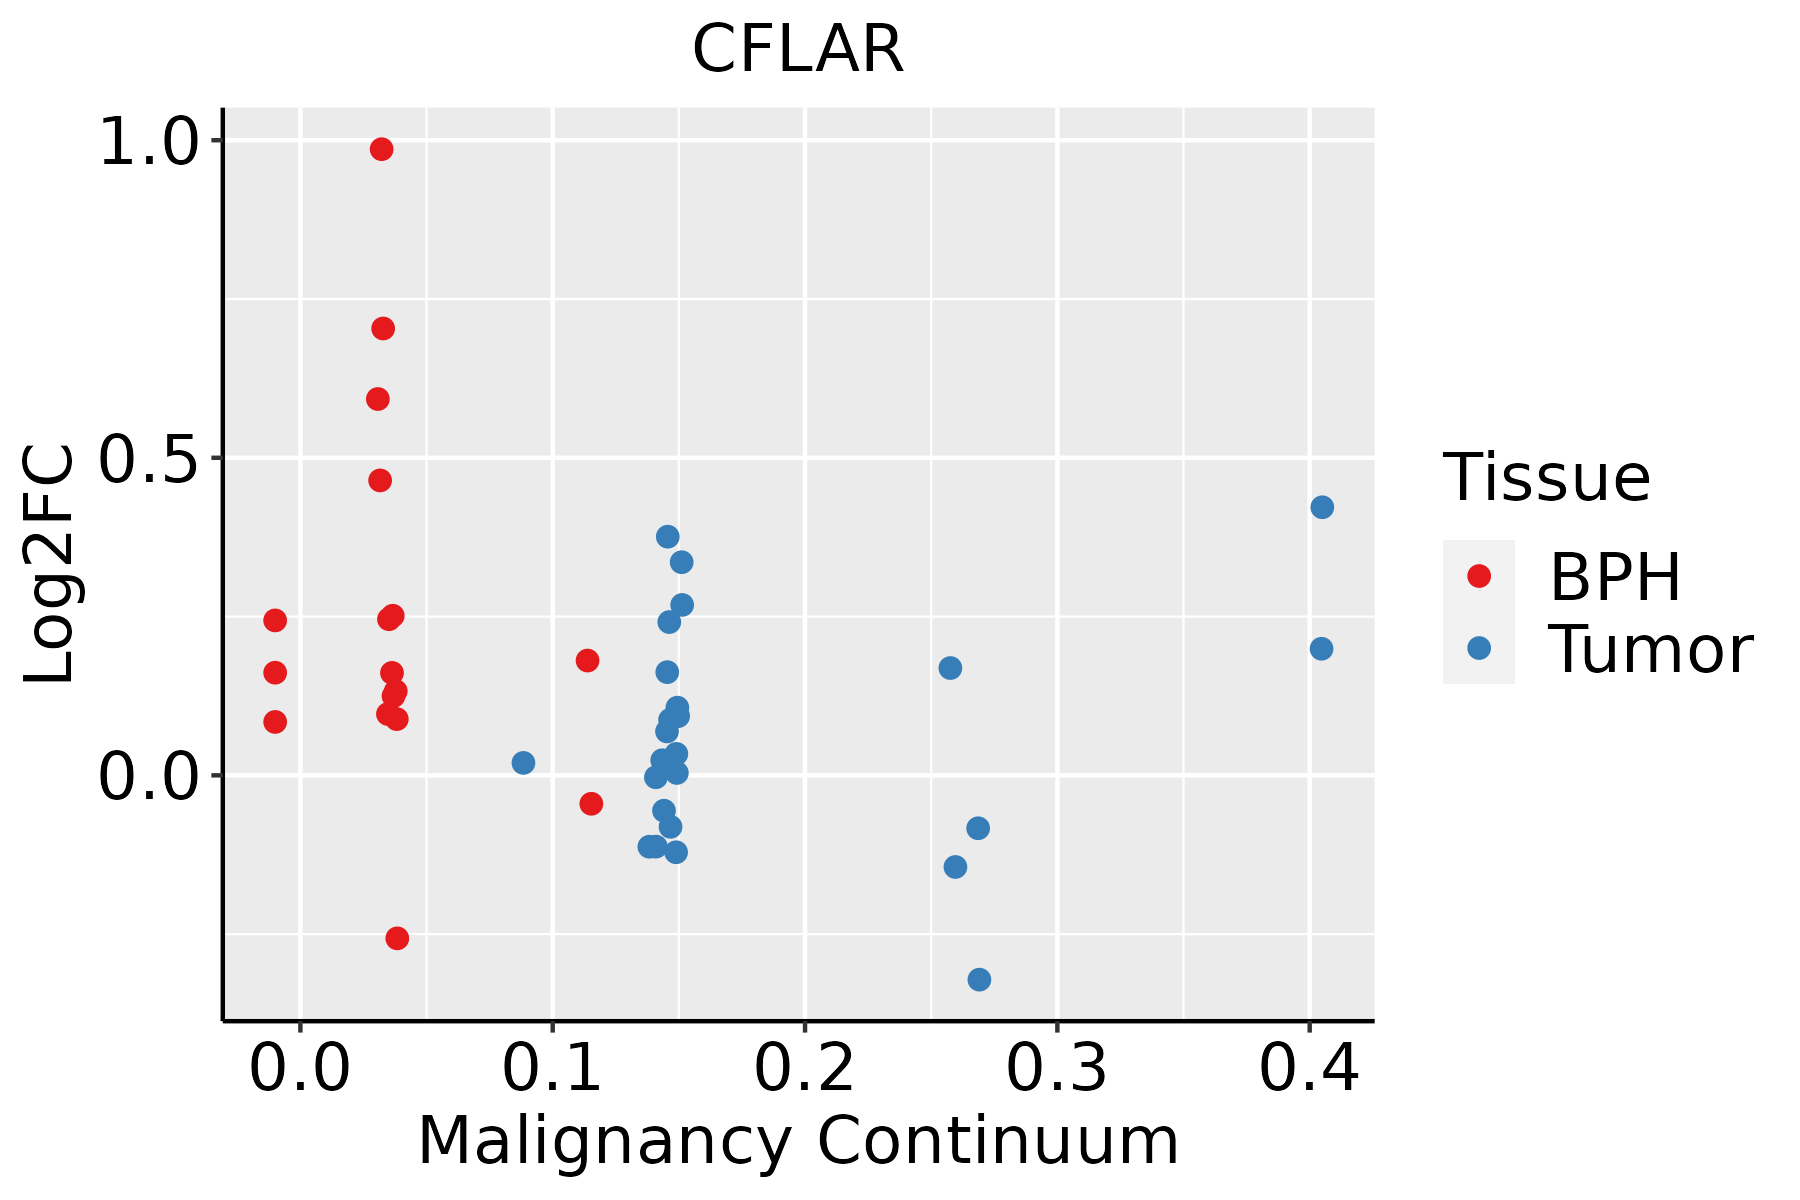 | BPH: Benign Prostatic Hyperplasia |
| Skin | 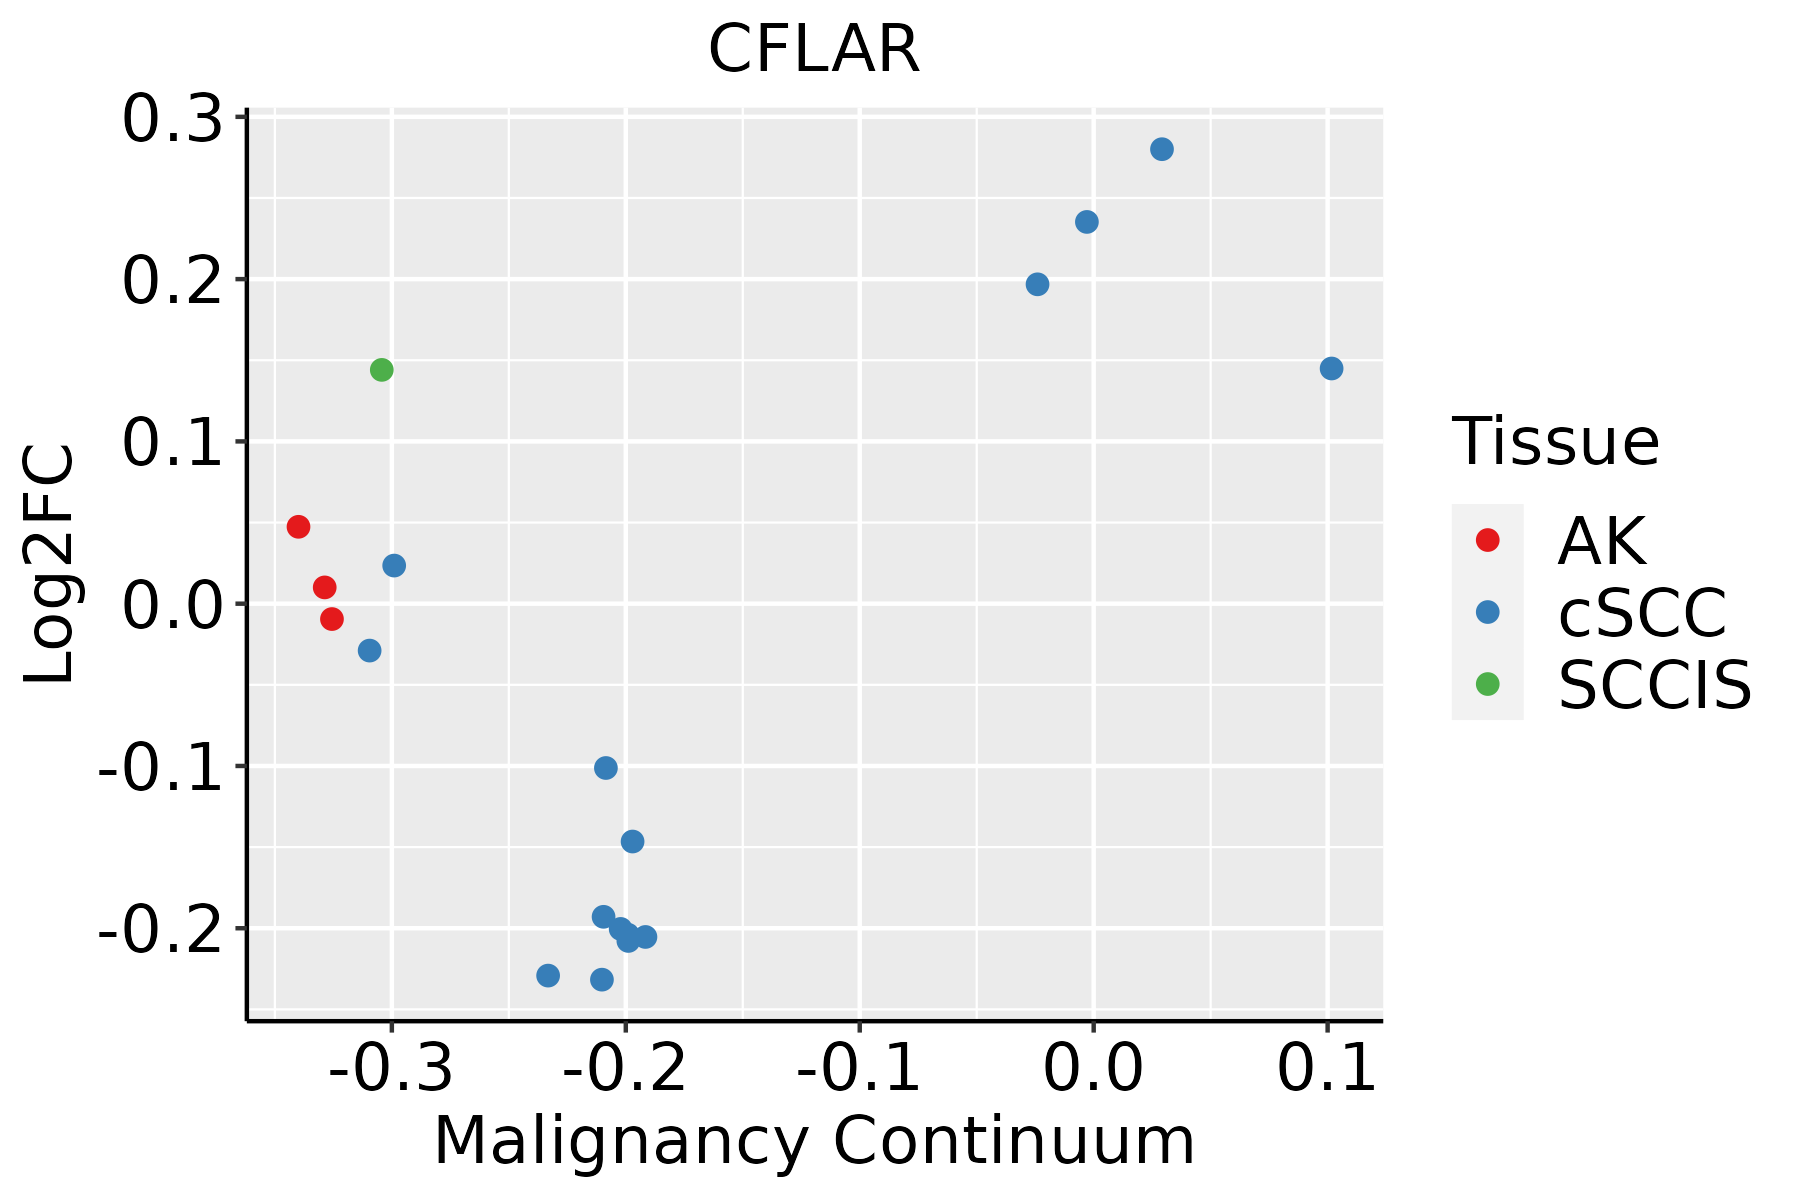 | AK: Actinic keratosis |
| cSCC: Cutaneous squamous cell carcinoma | ||
| SCCIS:squamous cell carcinoma in situ | ||
| Thyroid | 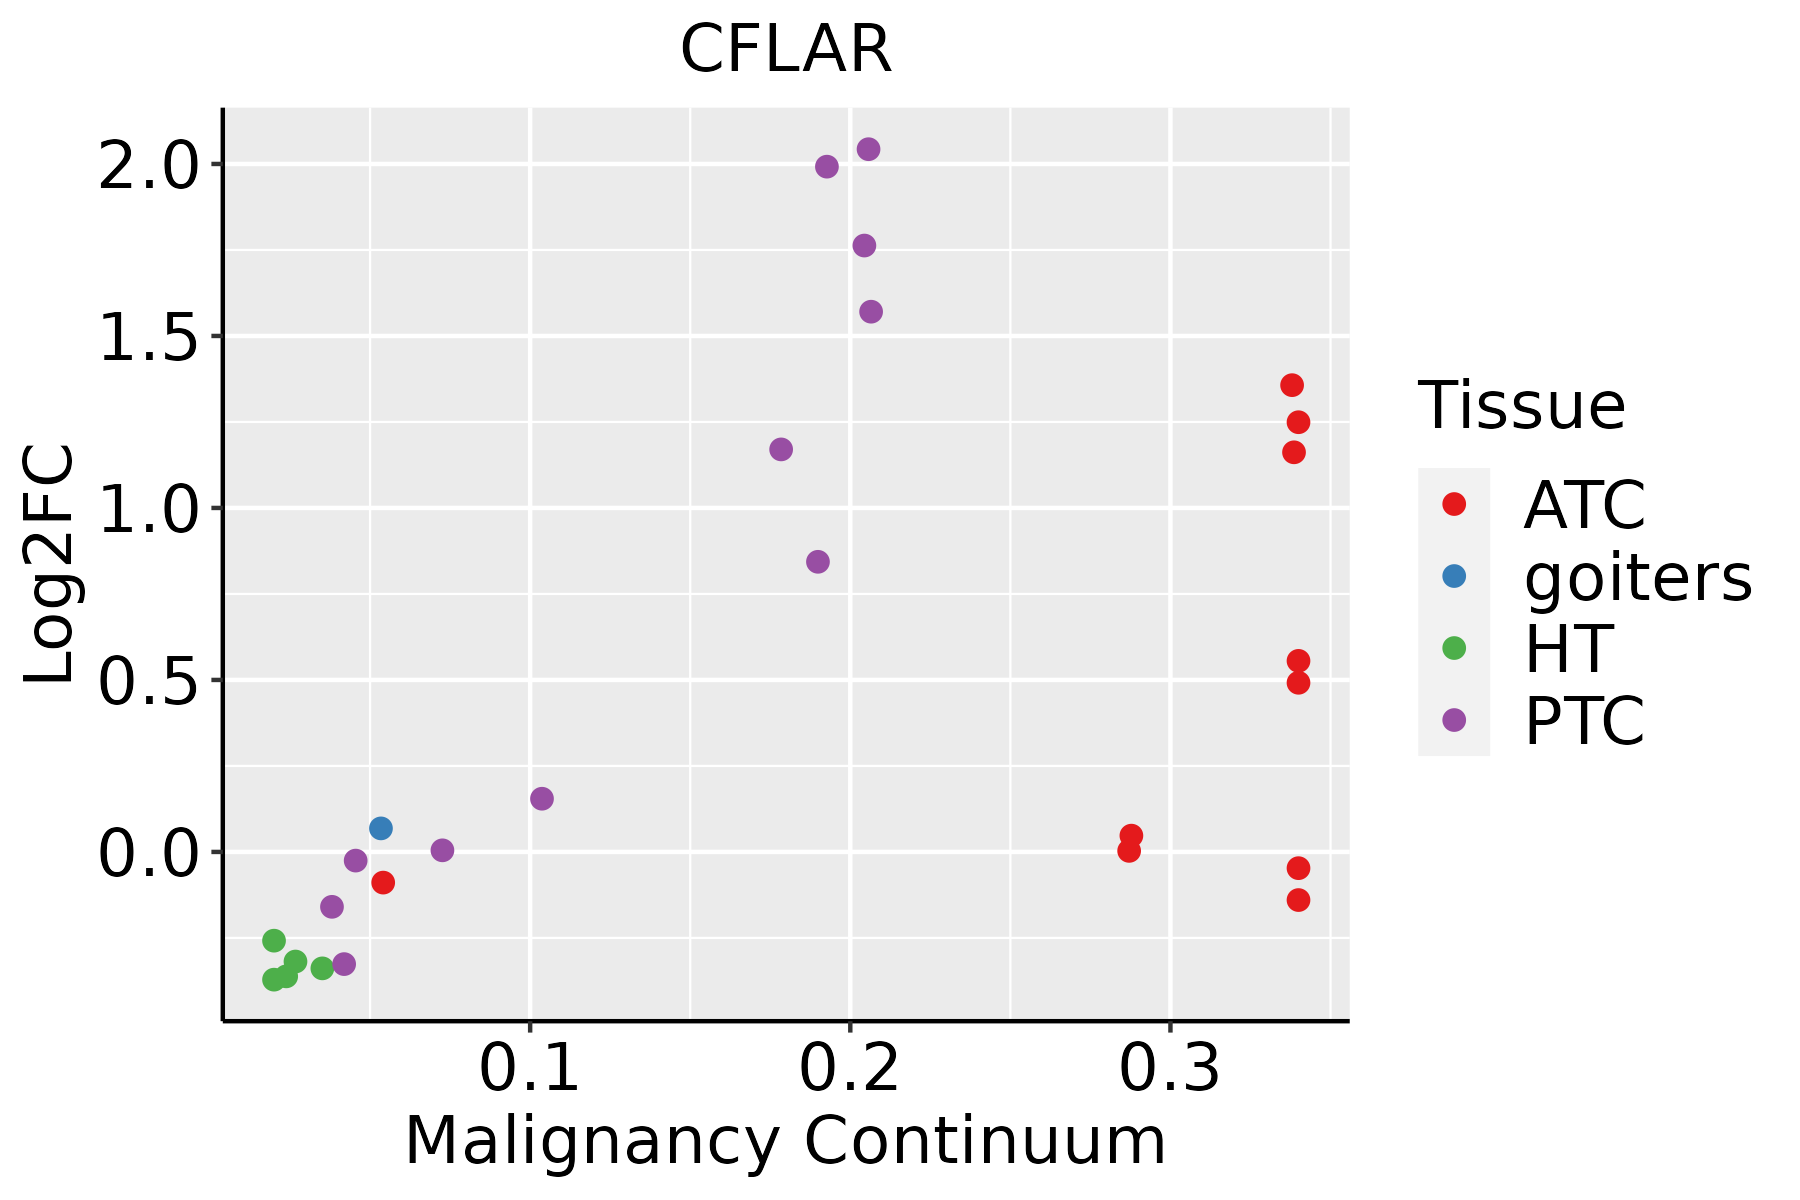 | ATC: Anaplastic thyroid cancer |
| HT: Hashimoto's thyroiditis | ||
| PTC: Papillary thyroid cancer |
| ∗log2FC in expression of this searched gene in stem-like cells from each diseased tissue sample relative to stem-like cells in normal samples in each tissue plotted against the malignancy continuum. Samples are colored based on if they are from different disease stage. |
Top |
Malignant transformation related pathway analysis |
| Find out the enriched GO biological processes and KEGG pathways involved in transition from healthy to precancer to cancer |
| Tissue | Disease Stage | Enriched GO biological Processes |
| Colorectum | AD |  |
| Colorectum | SER |  |
| Colorectum | MSS |  |
| Colorectum | MSI-H |  |
| Colorectum | FAP |  |
| ∗Top 15 enriched GO BP terms are showed in the bar plot of each disease state in each tissue. Each row represents a significant GO biological process which is colored according to the -log10(p.adjust). |
| Page: 1 2 3 4 5 6 7 8 9 |
| GO ID | Tissue | Disease Stage | Description | Gene Ratio | Bg Ratio | pvalue | p.adjust | Count |
| GO:200037717 | Oral cavity | LP | regulation of reactive oxygen species metabolic process | 67/4623 | 157/18723 | 5.54e-07 | 1.51e-05 | 67 |
| GO:200105619 | Oral cavity | LP | positive regulation of cysteine-type endopeptidase activity | 64/4623 | 148/18723 | 5.60e-07 | 1.51e-05 | 64 |
| GO:004328019 | Oral cavity | LP | positive regulation of cysteine-type endopeptidase activity involved in apoptotic process | 57/4623 | 129/18723 | 9.81e-07 | 2.48e-05 | 57 |
| GO:1901654110 | Oral cavity | LP | response to ketone | 78/4623 | 194/18723 | 1.24e-06 | 3.03e-05 | 78 |
| GO:0048545110 | Oral cavity | LP | response to steroid hormone | 122/4623 | 339/18723 | 1.91e-06 | 4.39e-05 | 122 |
| GO:000188919 | Oral cavity | LP | liver development | 62/4623 | 147/18723 | 2.32e-06 | 5.14e-05 | 62 |
| GO:2001236110 | Oral cavity | LP | regulation of extrinsic apoptotic signaling pathway | 63/4623 | 151/18723 | 2.98e-06 | 6.47e-05 | 63 |
| GO:0048732110 | Oral cavity | LP | gland development | 149/4623 | 436/18723 | 4.51e-06 | 9.17e-05 | 149 |
| GO:006100819 | Oral cavity | LP | hepaticobiliary system development | 62/4623 | 150/18723 | 5.13e-06 | 1.03e-04 | 62 |
| GO:0070482110 | Oral cavity | LP | response to oxygen levels | 122/4623 | 347/18723 | 7.10e-06 | 1.37e-04 | 122 |
| GO:003109916 | Oral cavity | LP | regeneration | 76/4623 | 198/18723 | 1.25e-05 | 2.24e-04 | 76 |
| GO:005109213 | Oral cavity | LP | positive regulation of NF-kappaB transcription factor activity | 61/4623 | 152/18723 | 1.82e-05 | 3.11e-04 | 61 |
| GO:007084917 | Oral cavity | LP | response to epidermal growth factor | 26/4623 | 49/18723 | 1.84e-05 | 3.14e-04 | 26 |
| GO:005109015 | Oral cavity | LP | regulation of DNA-binding transcription factor activity | 147/4623 | 440/18723 | 2.00e-05 | 3.35e-04 | 147 |
| GO:000691914 | Oral cavity | LP | activation of cysteine-type endopeptidase activity involved in apoptotic process | 36/4623 | 78/18723 | 2.97e-05 | 4.62e-04 | 36 |
| GO:007136417 | Oral cavity | LP | cellular response to epidermal growth factor stimulus | 24/4623 | 45/18723 | 3.44e-05 | 5.18e-04 | 24 |
| GO:0043434110 | Oral cavity | LP | response to peptide hormone | 138/4623 | 414/18723 | 4.00e-05 | 5.87e-04 | 138 |
| GO:190165317 | Oral cavity | LP | cellular response to peptide | 122/4623 | 359/18723 | 4.22e-05 | 6.10e-04 | 122 |
| GO:000862517 | Oral cavity | LP | extrinsic apoptotic signaling pathway via death domain receptors | 37/4623 | 82/18723 | 4.28e-05 | 6.15e-04 | 37 |
| GO:0001666110 | Oral cavity | LP | response to hypoxia | 106/4623 | 307/18723 | 6.38e-05 | 8.61e-04 | 106 |
| Page: 1 2 3 4 5 6 7 8 9 10 11 12 13 14 15 16 17 18 19 20 21 22 23 24 25 26 27 28 29 30 31 32 33 34 35 36 37 38 39 40 41 42 43 44 45 46 47 48 49 50 51 52 53 54 55 56 57 58 59 60 |
| Pathway ID | Tissue | Disease Stage | Description | Gene Ratio | Bg Ratio | pvalue | p.adjust | qvalue | Count |
| hsa0421020 | Esophagus | HGIN | Apoptosis | 36/1383 | 136/8465 | 1.67e-03 | 1.52e-02 | 1.20e-02 | 36 |
| hsa04210110 | Esophagus | HGIN | Apoptosis | 36/1383 | 136/8465 | 1.67e-03 | 1.52e-02 | 1.20e-02 | 36 |
| hsa0466810 | Esophagus | ESCC | TNF signaling pathway | 89/4205 | 114/8465 | 3.36e-10 | 4.01e-09 | 2.06e-09 | 89 |
| hsa0421027 | Esophagus | ESCC | Apoptosis | 102/4205 | 136/8465 | 1.05e-09 | 1.21e-08 | 6.21e-09 | 102 |
| hsa0414010 | Esophagus | ESCC | Autophagy - animal | 101/4205 | 141/8465 | 7.60e-08 | 6.21e-07 | 3.18e-07 | 101 |
| hsa051609 | Esophagus | ESCC | Hepatitis C | 107/4205 | 157/8465 | 1.75e-06 | 1.08e-05 | 5.55e-06 | 107 |
| hsa040645 | Esophagus | ESCC | NF-kappa B signaling pathway | 67/4205 | 104/8465 | 1.62e-03 | 4.89e-03 | 2.50e-03 | 67 |
| hsa051425 | Esophagus | ESCC | Chagas disease | 65/4205 | 102/8465 | 2.81e-03 | 7.59e-03 | 3.89e-03 | 65 |
| hsa0466817 | Esophagus | ESCC | TNF signaling pathway | 89/4205 | 114/8465 | 3.36e-10 | 4.01e-09 | 2.06e-09 | 89 |
| hsa0421037 | Esophagus | ESCC | Apoptosis | 102/4205 | 136/8465 | 1.05e-09 | 1.21e-08 | 6.21e-09 | 102 |
| hsa0414015 | Esophagus | ESCC | Autophagy - animal | 101/4205 | 141/8465 | 7.60e-08 | 6.21e-07 | 3.18e-07 | 101 |
| hsa0516016 | Esophagus | ESCC | Hepatitis C | 107/4205 | 157/8465 | 1.75e-06 | 1.08e-05 | 5.55e-06 | 107 |
| hsa0406412 | Esophagus | ESCC | NF-kappa B signaling pathway | 67/4205 | 104/8465 | 1.62e-03 | 4.89e-03 | 2.50e-03 | 67 |
| hsa0514213 | Esophagus | ESCC | Chagas disease | 65/4205 | 102/8465 | 2.81e-03 | 7.59e-03 | 3.89e-03 | 65 |
| hsa041406 | Liver | Cirrhotic | Autophagy - animal | 65/2530 | 141/8465 | 3.10e-05 | 2.47e-04 | 1.52e-04 | 65 |
| hsa042106 | Liver | Cirrhotic | Apoptosis | 58/2530 | 136/8465 | 9.84e-04 | 5.55e-03 | 3.42e-03 | 58 |
| hsa051605 | Liver | Cirrhotic | Hepatitis C | 63/2530 | 157/8465 | 3.67e-03 | 1.49e-02 | 9.20e-03 | 63 |
| hsa0414011 | Liver | Cirrhotic | Autophagy - animal | 65/2530 | 141/8465 | 3.10e-05 | 2.47e-04 | 1.52e-04 | 65 |
| hsa0421011 | Liver | Cirrhotic | Apoptosis | 58/2530 | 136/8465 | 9.84e-04 | 5.55e-03 | 3.42e-03 | 58 |
| hsa0516012 | Liver | Cirrhotic | Hepatitis C | 63/2530 | 157/8465 | 3.67e-03 | 1.49e-02 | 9.20e-03 | 63 |
| Page: 1 2 3 4 5 |
Top |
Cell-cell communication analysis |
| Identification of potential cell-cell interactions between two cell types and their ligand-receptor pairs for different disease states |
| Ligand | Receptor | LRpair | Pathway | Tissue | Disease Stage |
| Page: 1 |
Top |
Single-cell gene regulatory network inference analysis |
| Find out the significant the regulons (TFs) and the target genes of each regulon across cell types for different disease states |
| TF | Cell Type | Tissue | Disease Stage | Target Gene | RSS | Regulon Activity |
| ∗The dot plots of a searched regulon are shown for all cell subpopulations in each disease state of each tissue based on the regulon specific score inferred using pySCENIC and by calculating the average expression. |
| Page: 1 |
Top |
Somatic mutation of malignant transformation related genes |
| Annotation of somatic variants for genes involved in malignant transformation |
| Hugo Symbol | Variant Class | Variant Classification | dbSNP RS | HGVSc | HGVSp | HGVSp Short | SWISSPROT | BIOTYPE | SIFT | PolyPhen | Tumor Sample Barcode | Tissue | Histology | Sex | Age | Stage | Therapy Types | Drugs | Outcome |
| CFLAR | SNV | Missense_Mutation | c.670N>A | p.Val224Met | p.V224M | O15519 | protein_coding | deleterious(0.04) | possibly_damaging(0.798) | TCGA-AN-A0AM-01 | Breast | breast invasive carcinoma | Female | <65 | I/II | Unknown | Unknown | SD | |
| CFLAR | SNV | Missense_Mutation | novel | c.1152N>C | p.Glu384Asp | p.E384D | O15519 | protein_coding | tolerated(0.56) | benign(0.003) | TCGA-AN-A0FX-01 | Breast | breast invasive carcinoma | Female | <65 | I/II | Unknown | Unknown | SD |
| CFLAR | SNV | Missense_Mutation | novel | c.565G>T | p.Ala189Ser | p.A189S | O15519 | protein_coding | tolerated(1) | benign(0) | TCGA-EW-A423-01 | Breast | breast invasive carcinoma | Female | >=65 | I/II | Hormone Therapy | anastrozole | SD |
| CFLAR | insertion | In_Frame_Ins | novel | c.1150_1151insTTTTCCCCAGAGCTTCTTCGAGACACCTTC | p.Glu384delinsValPheProArgAlaSerSerArgHisLeuGln | p.E384delinsVFPRASSRHLQ | O15519 | protein_coding | TCGA-AN-A0FX-01 | Breast | breast invasive carcinoma | Female | <65 | I/II | Unknown | Unknown | SD | ||
| CFLAR | insertion | Nonsense_Mutation | novel | c.700_701insCACTGTAGCCAGACTGCCTCTCTAGA | p.Phe234SerfsTer3 | p.F234Sfs*3 | O15519 | protein_coding | TCGA-ZJ-A8QQ-01 | Cervix | cervical & endocervical cancer | Female | <65 | I/II | Chemotherapy | cisplatin | SD | ||
| CFLAR | SNV | Missense_Mutation | c.1143G>T | p.Lys381Asn | p.K381N | O15519 | protein_coding | tolerated(0.4) | benign(0.015) | TCGA-AA-3977-01 | Colorectum | colon adenocarcinoma | Male | >=65 | I/II | Unknown | Unknown | SD | |
| CFLAR | SNV | Missense_Mutation | c.877N>A | p.Leu293Ile | p.L293I | O15519 | protein_coding | tolerated(0.08) | possibly_damaging(0.906) | TCGA-AA-A01Z-01 | Colorectum | colon adenocarcinoma | Male | >=65 | I/II | Unknown | Unknown | PD | |
| CFLAR | SNV | Missense_Mutation | novel | c.803N>A | p.Arg268Gln | p.R268Q | O15519 | protein_coding | tolerated(0.36) | benign(0.003) | TCGA-G4-6320-01 | Colorectum | colon adenocarcinoma | Male | >=65 | III/IV | Chemotherapy | oxaliplatin | SD |
| CFLAR | SNV | Missense_Mutation | c.653N>A | p.Gly218Asp | p.G218D | O15519 | protein_coding | tolerated(0.56) | benign(0) | TCGA-AG-A002-01 | Colorectum | rectum adenocarcinoma | Male | <65 | I/II | Unknown | Unknown | SD | |
| CFLAR | SNV | Missense_Mutation | novel | c.191N>A | p.Arg64Gln | p.R64Q | O15519 | protein_coding | deleterious(0) | probably_damaging(1) | TCGA-A5-A0G2-01 | Endometrium | uterine corpus endometrioid carcinoma | Female | <65 | III/IV | Unknown | Unknown | SD |
| Page: 1 2 3 4 |
Top |
Related drugs of malignant transformation related genes |
| Identification of chemicals and drugs interact with genes involved in malignant transfromation |
| (DGIdb 4.0) |
| Entrez ID | Symbol | Category | Interaction Types | Drug Claim Name | Drug Name | PMIDs |
| 8837 | CFLAR | DRUG RESISTANCE, DRUGGABLE GENOME, PROTEASE | BAY-11-7085 | BAY-11-7085 | 22326395 | |
| 8837 | CFLAR | DRUG RESISTANCE, DRUGGABLE GENOME, PROTEASE | DEHYDROEQUOL | IDRONOXIL | ||
| 8837 | CFLAR | DRUG RESISTANCE, DRUGGABLE GENOME, PROTEASE | FINASTERIDE | FINASTERIDE | 11399535 | |
| 8837 | CFLAR | DRUG RESISTANCE, DRUGGABLE GENOME, PROTEASE | BICALUTAMIDE | BICALUTAMIDE | 22623731 | |
| 8837 | CFLAR | DRUG RESISTANCE, DRUGGABLE GENOME, PROTEASE | NINTEDANIB | NINTEDANIB | ||
| 8837 | CFLAR | DRUG RESISTANCE, DRUGGABLE GENOME, PROTEASE | CABOZANTINIB | CABOZANTINIB | ||
| 8837 | CFLAR | DRUG RESISTANCE, DRUGGABLE GENOME, PROTEASE | DOVITINIB | DOVITINIB |
| Page: 1 |

Copyright 2023-Present -The University of Texas Health Science Center at Houston |