
|
|||||
|
 | |
| |
| |
| |
| |
| |
|
Gene: CCT5 |
Gene summary for CCT5 |
| Gene information | Species | Human | Gene symbol | CCT5 | Gene ID | 22948 |
| Gene name | chaperonin containing TCP1 subunit 5 | |
| Gene Alias | CCT-epsilon | |
| Cytomap | 5p15.2 | |
| Gene Type | protein-coding | GO ID | GO:0000003 | UniProtAcc | B4DX08 |
Top |
Malignant transformation analysis |
| Identification of the aberrant gene expression in precancerous and cancerous lesions by comparing the gene expression of stem-like cells in diseased tissues with normal stem cells |
| Entrez ID | Symbol | Replicates | Species | Organ | Tissue | Adj P-value | Log2FC | Malignancy |
| 22948 | CCT5 | GSM4909282 | Human | Breast | IDC | 2.85e-20 | 5.90e-01 | -0.0288 |
| 22948 | CCT5 | GSM4909285 | Human | Breast | IDC | 4.43e-23 | 6.30e-01 | 0.21 |
| 22948 | CCT5 | GSM4909286 | Human | Breast | IDC | 1.57e-03 | -6.90e-02 | 0.1081 |
| 22948 | CCT5 | GSM4909288 | Human | Breast | IDC | 3.72e-04 | 3.12e-01 | 0.0988 |
| 22948 | CCT5 | GSM4909293 | Human | Breast | IDC | 9.82e-03 | -1.12e-01 | 0.1581 |
| 22948 | CCT5 | GSM4909296 | Human | Breast | IDC | 2.19e-11 | -3.38e-01 | 0.1524 |
| 22948 | CCT5 | GSM4909297 | Human | Breast | IDC | 3.63e-07 | -8.96e-02 | 0.1517 |
| 22948 | CCT5 | GSM4909301 | Human | Breast | IDC | 2.05e-04 | -2.72e-01 | 0.1577 |
| 22948 | CCT5 | GSM4909307 | Human | Breast | IDC | 6.30e-06 | -2.84e-01 | 0.1569 |
| 22948 | CCT5 | GSM4909311 | Human | Breast | IDC | 1.89e-25 | -2.72e-01 | 0.1534 |
| 22948 | CCT5 | GSM4909312 | Human | Breast | IDC | 1.01e-06 | -4.73e-02 | 0.1552 |
| 22948 | CCT5 | GSM4909313 | Human | Breast | IDC | 6.29e-05 | -2.99e-01 | 0.0391 |
| 22948 | CCT5 | GSM4909318 | Human | Breast | IDC | 3.11e-09 | 7.13e-01 | 0.2031 |
| 22948 | CCT5 | GSM4909319 | Human | Breast | IDC | 8.51e-27 | -3.80e-01 | 0.1563 |
| 22948 | CCT5 | GSM4909320 | Human | Breast | IDC | 1.30e-02 | -3.16e-01 | 0.1575 |
| 22948 | CCT5 | GSM4909321 | Human | Breast | IDC | 9.26e-09 | -1.47e-01 | 0.1559 |
| 22948 | CCT5 | brca1 | Human | Breast | Precancer | 8.88e-31 | 6.44e-01 | -0.0338 |
| 22948 | CCT5 | brca2 | Human | Breast | Precancer | 2.36e-11 | 4.02e-01 | -0.024 |
| 22948 | CCT5 | brca3 | Human | Breast | Precancer | 4.68e-05 | 3.82e-01 | -0.0263 |
| 22948 | CCT5 | M2 | Human | Breast | IDC | 1.03e-18 | 7.91e-01 | 0.21 |
| Page: 1 2 3 4 5 6 7 8 9 10 11 |
| Tissue | Expression Dynamics | Abbreviation |
| Breast | 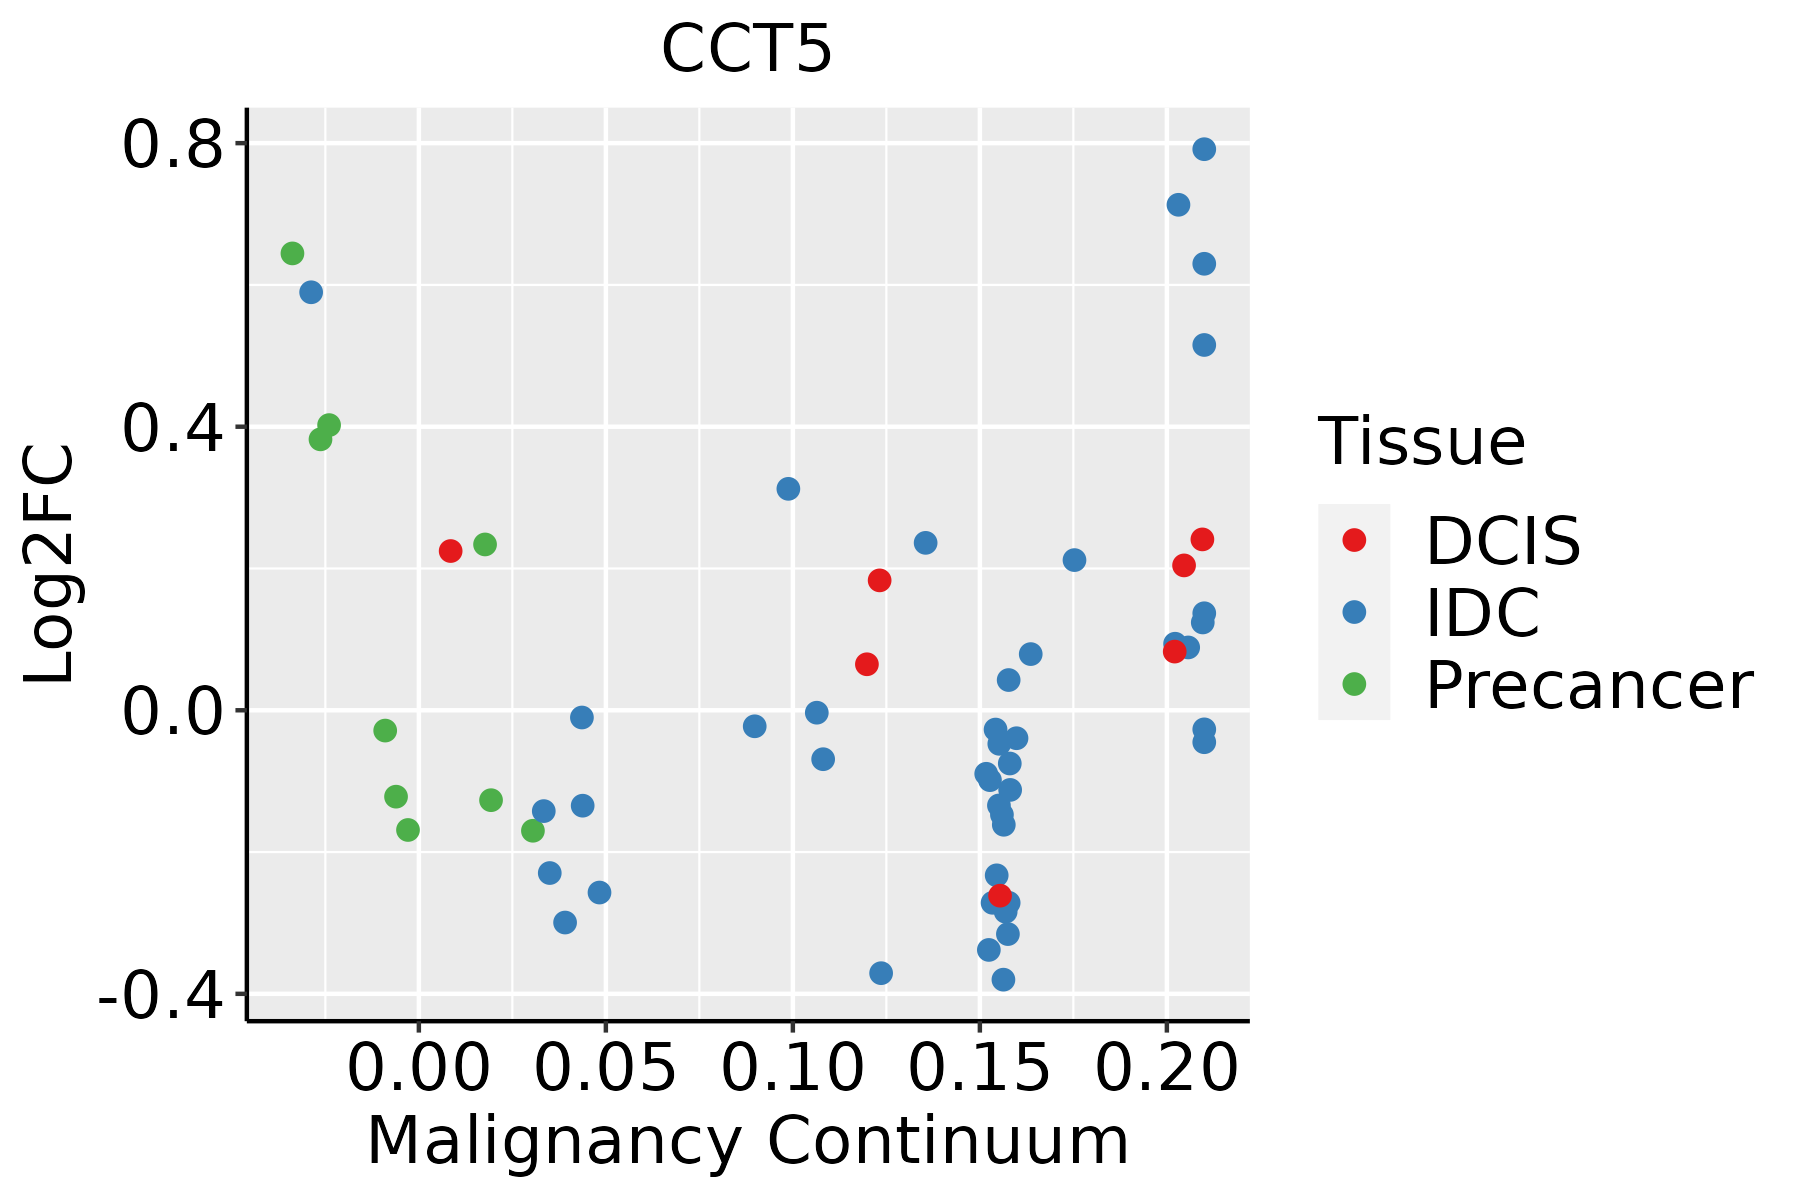 | IDC: Invasive ductal carcinoma |
| DCIS: Ductal carcinoma in situ | ||
| Precancer(BRCA1-mut): Precancerous lesion from BRCA1 mutation carriers | ||
| Endometrium | 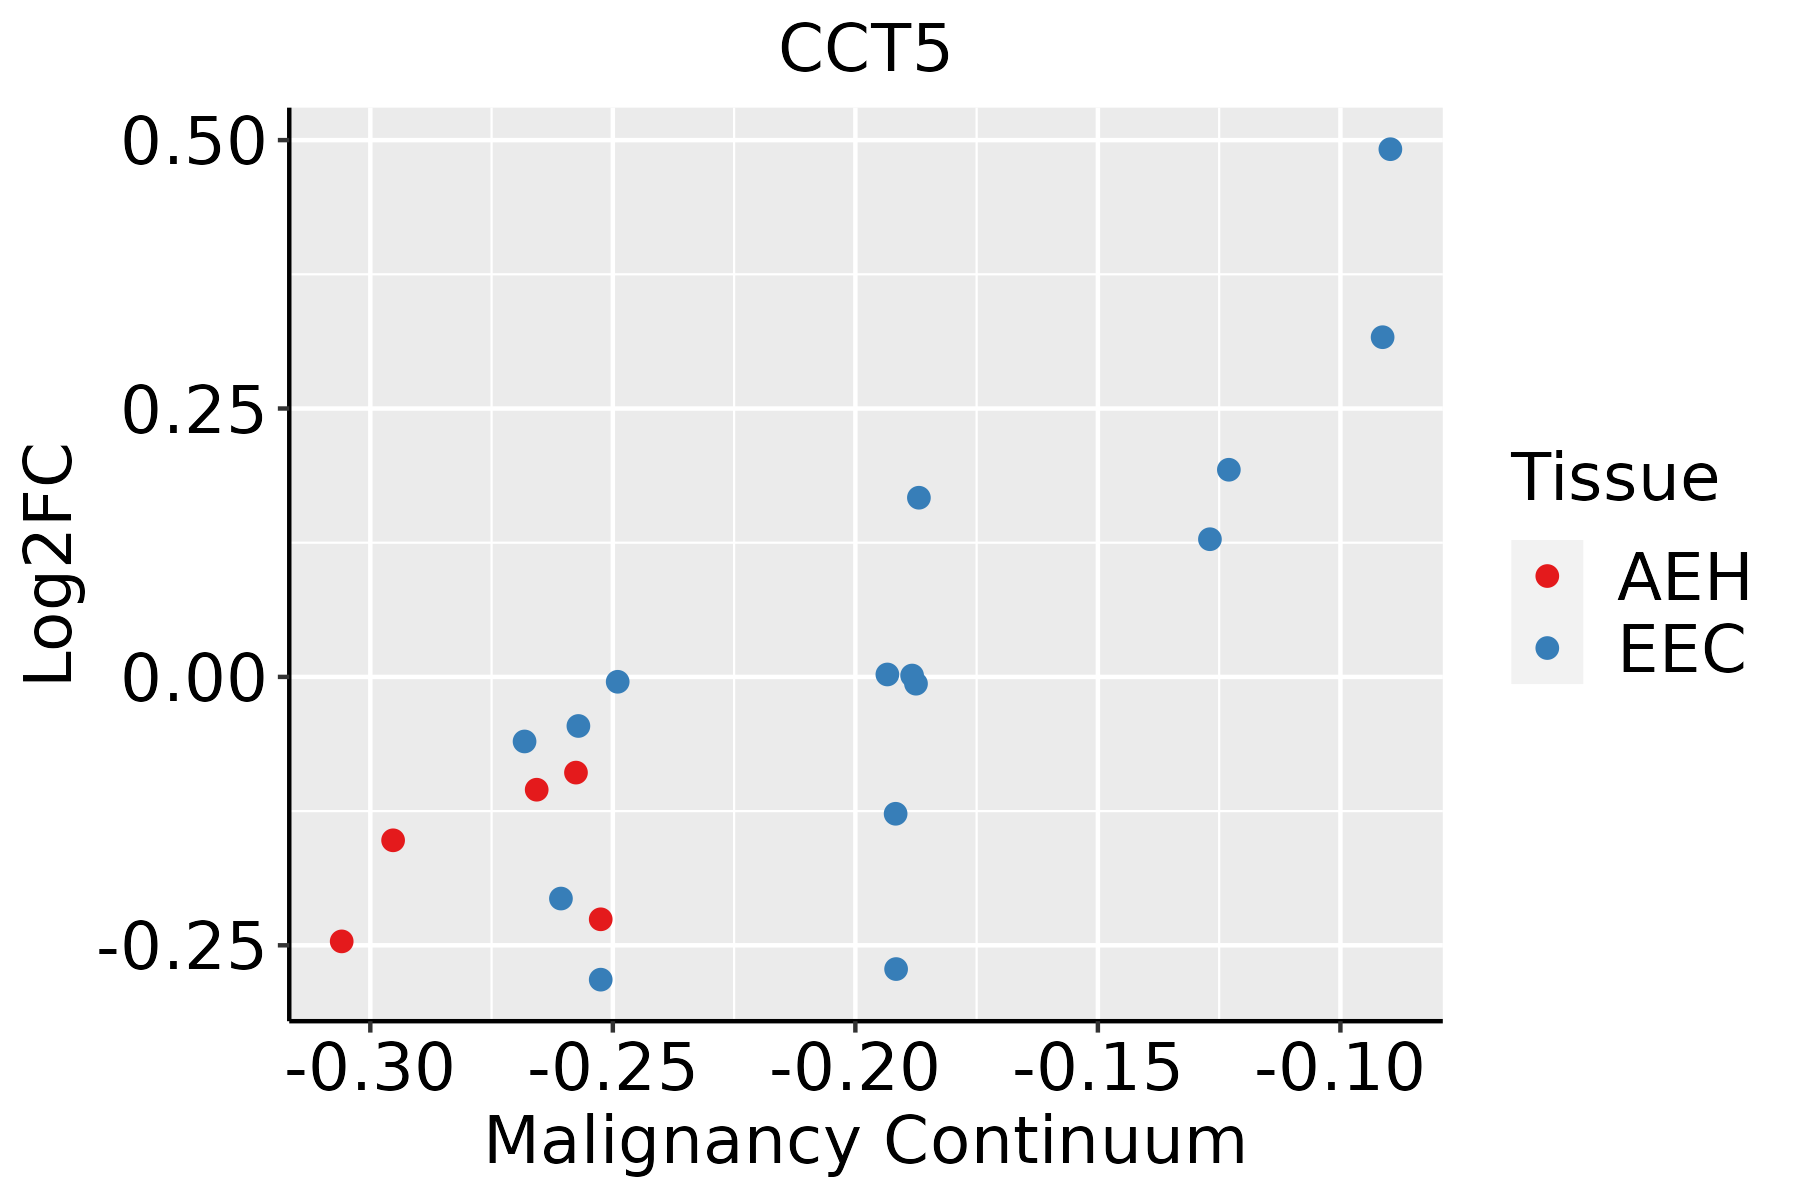 | AEH: Atypical endometrial hyperplasia |
| EEC: Endometrioid Cancer | ||
| Esophagus | 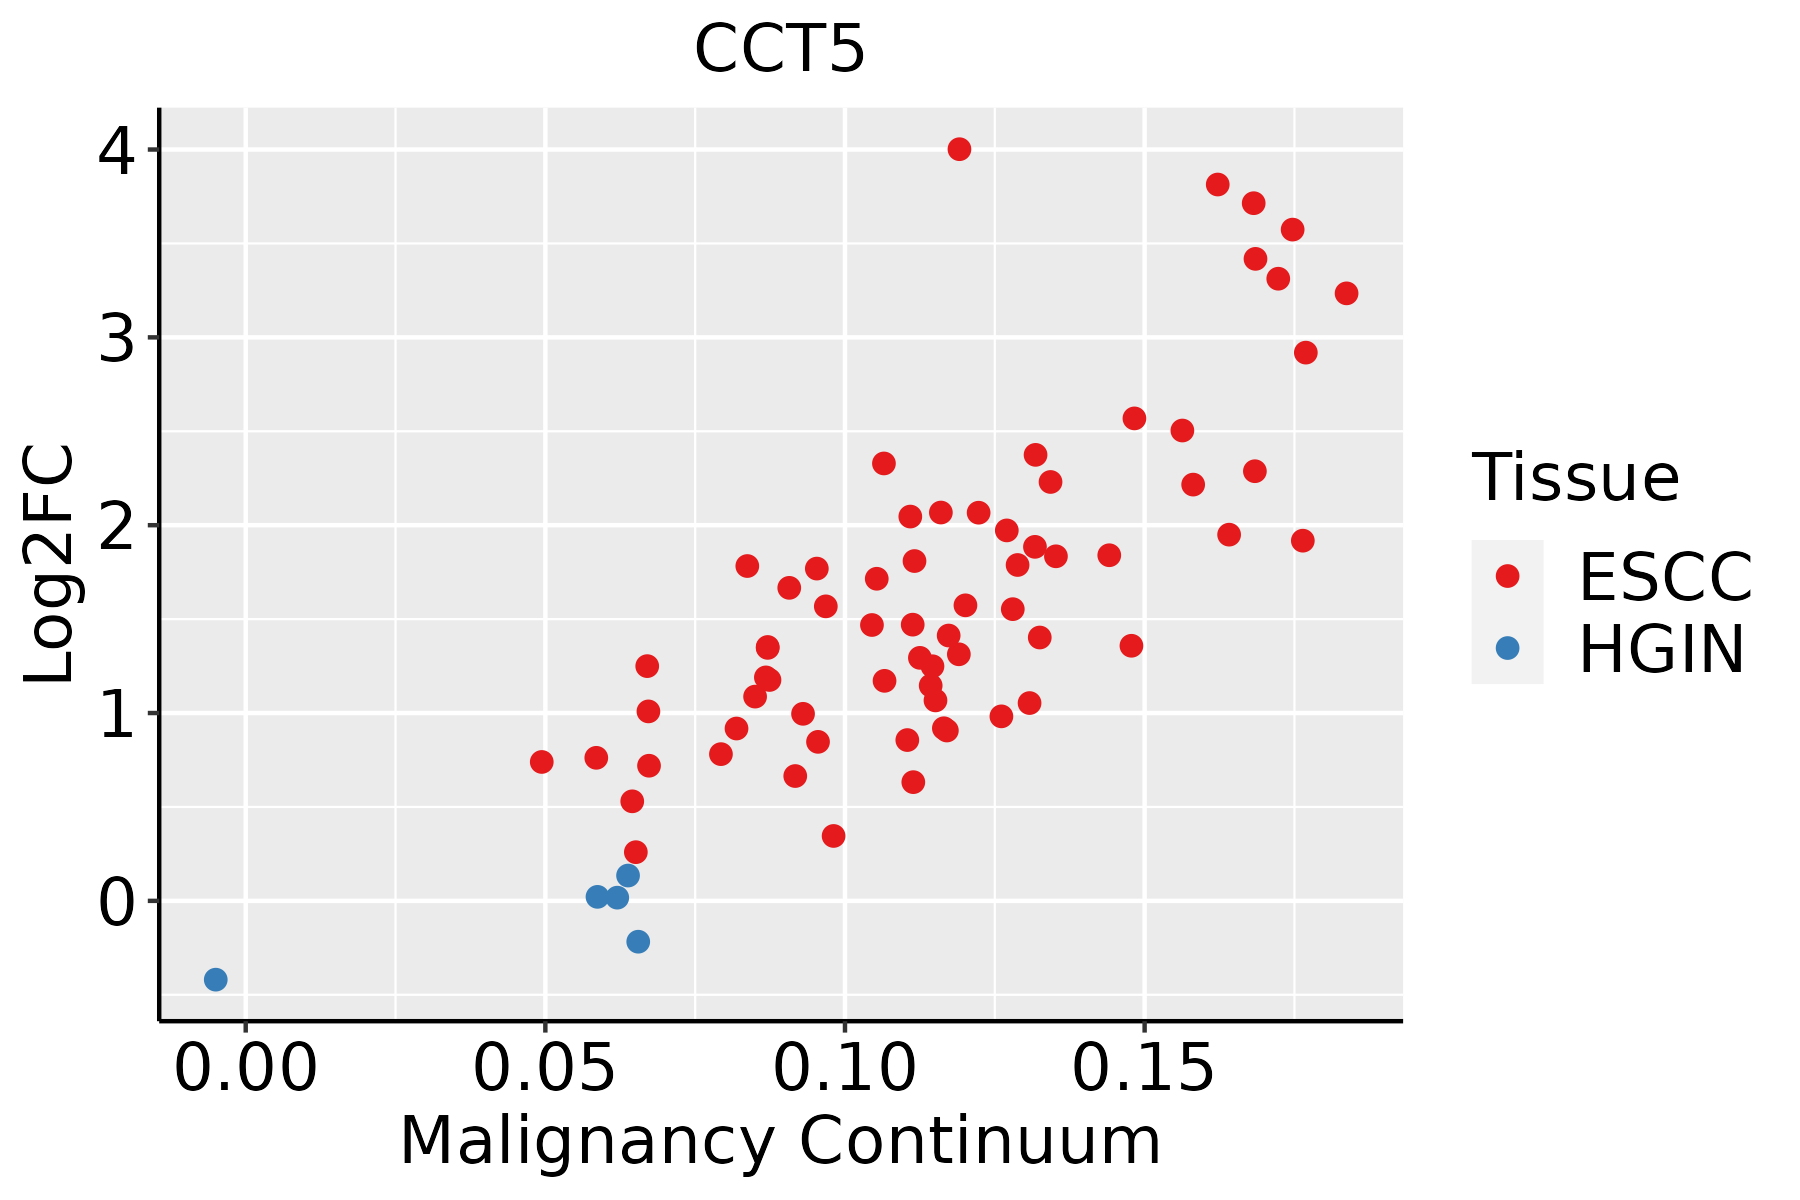 | ESCC: Esophageal squamous cell carcinoma |
| HGIN: High-grade intraepithelial neoplasias | ||
| LGIN: Low-grade intraepithelial neoplasias | ||
| GC | 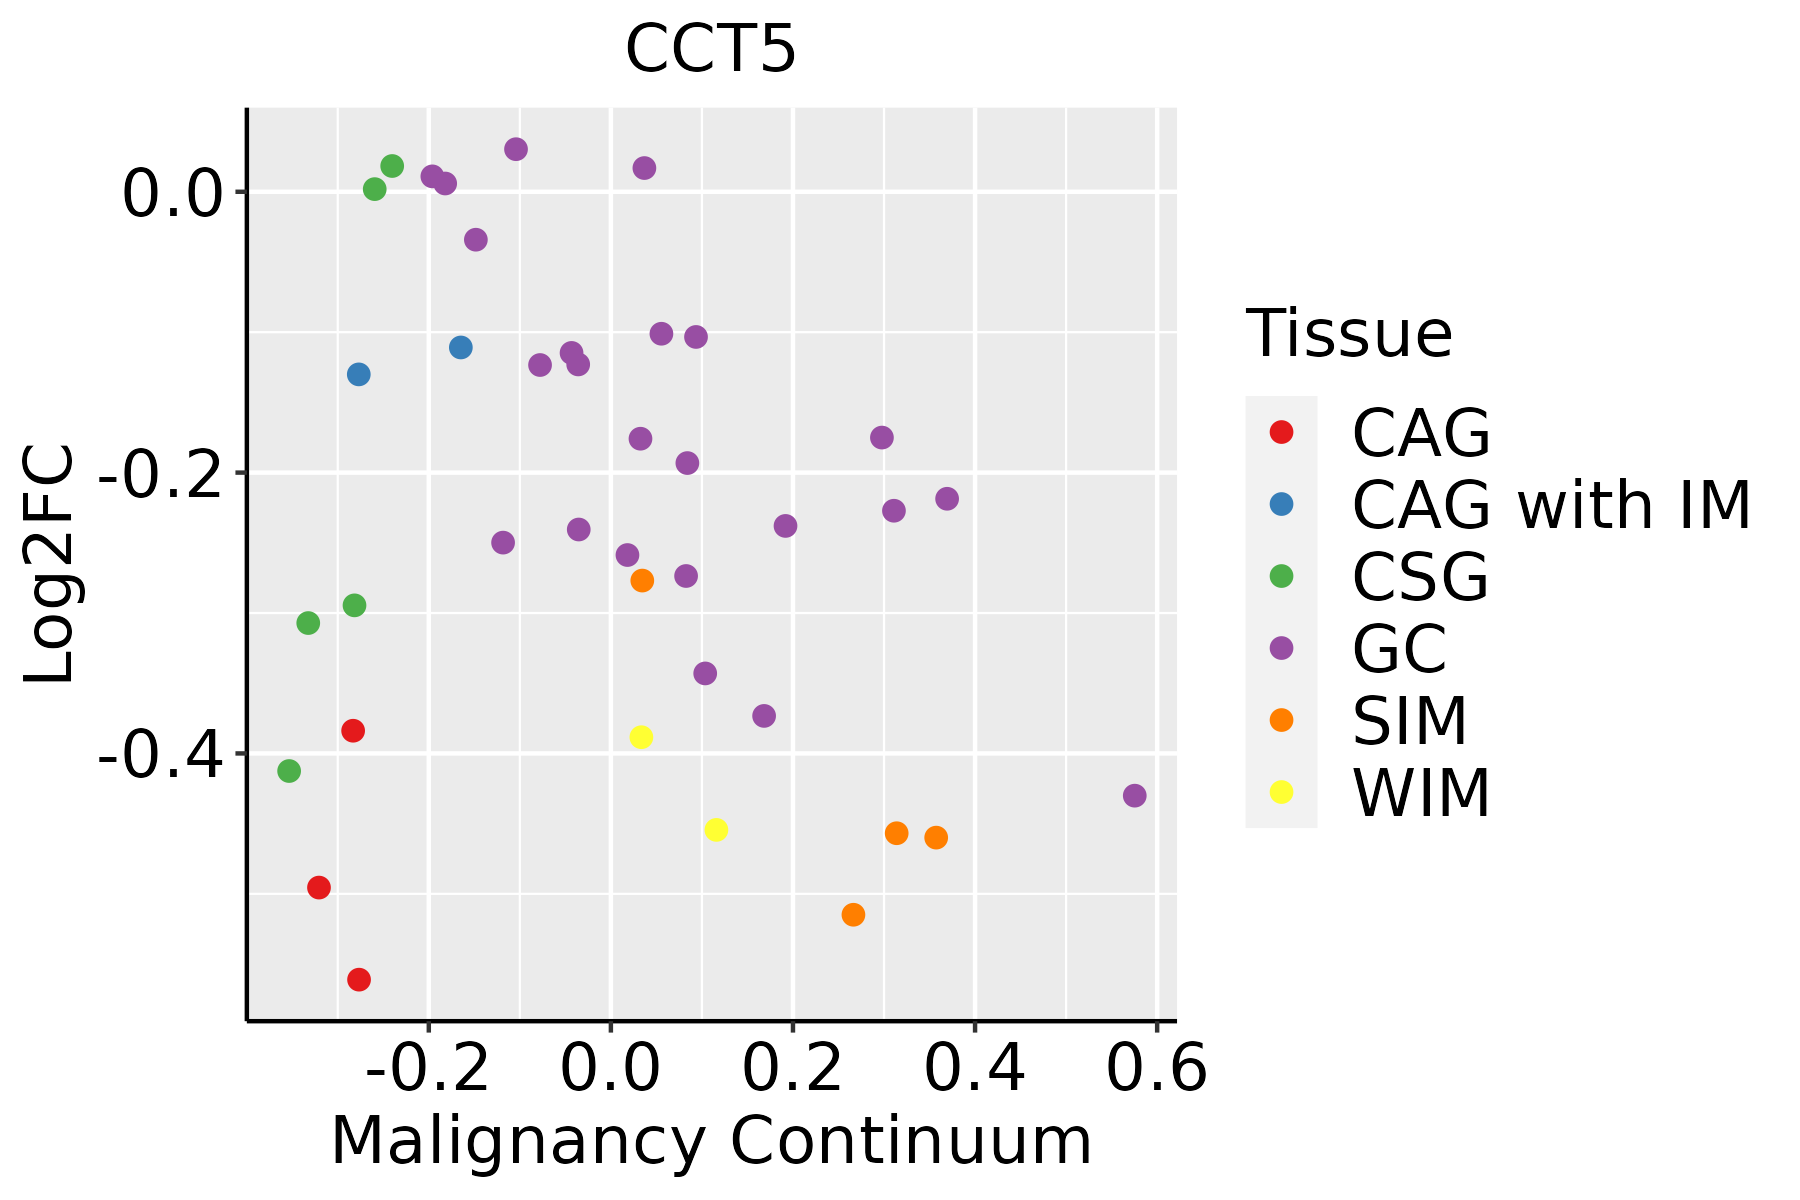 | CAG: Chronic atrophic gastritis |
| CAG with IM: Chronic atrophic gastritis with intestinal metaplasia | ||
| CSG: Chronic superficial gastritis | ||
| GC: Gastric cancer | ||
| SIM: Severe intestinal metaplasia | ||
| WIM: Wild intestinal metaplasia | ||
| Liver | 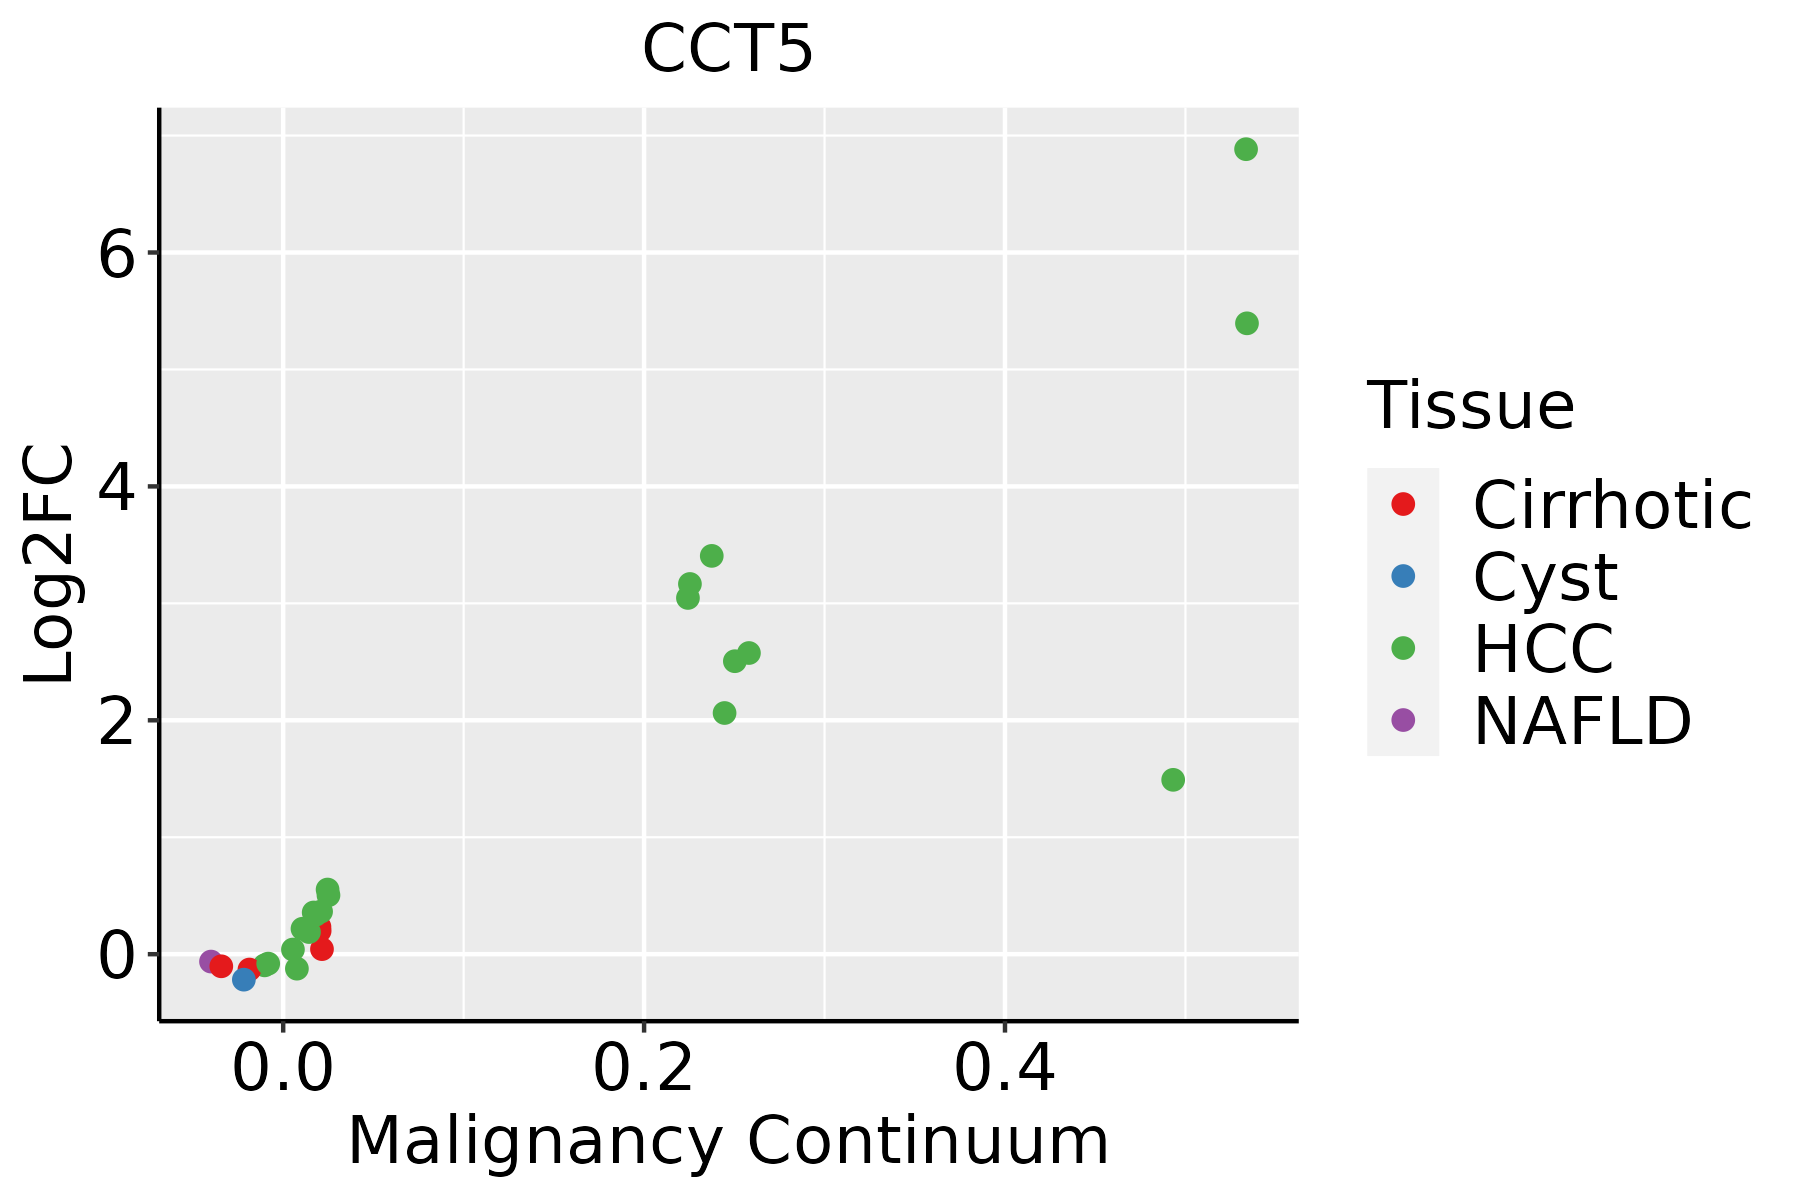 | HCC: Hepatocellular carcinoma |
| NAFLD: Non-alcoholic fatty liver disease | ||
| Oral Cavity | 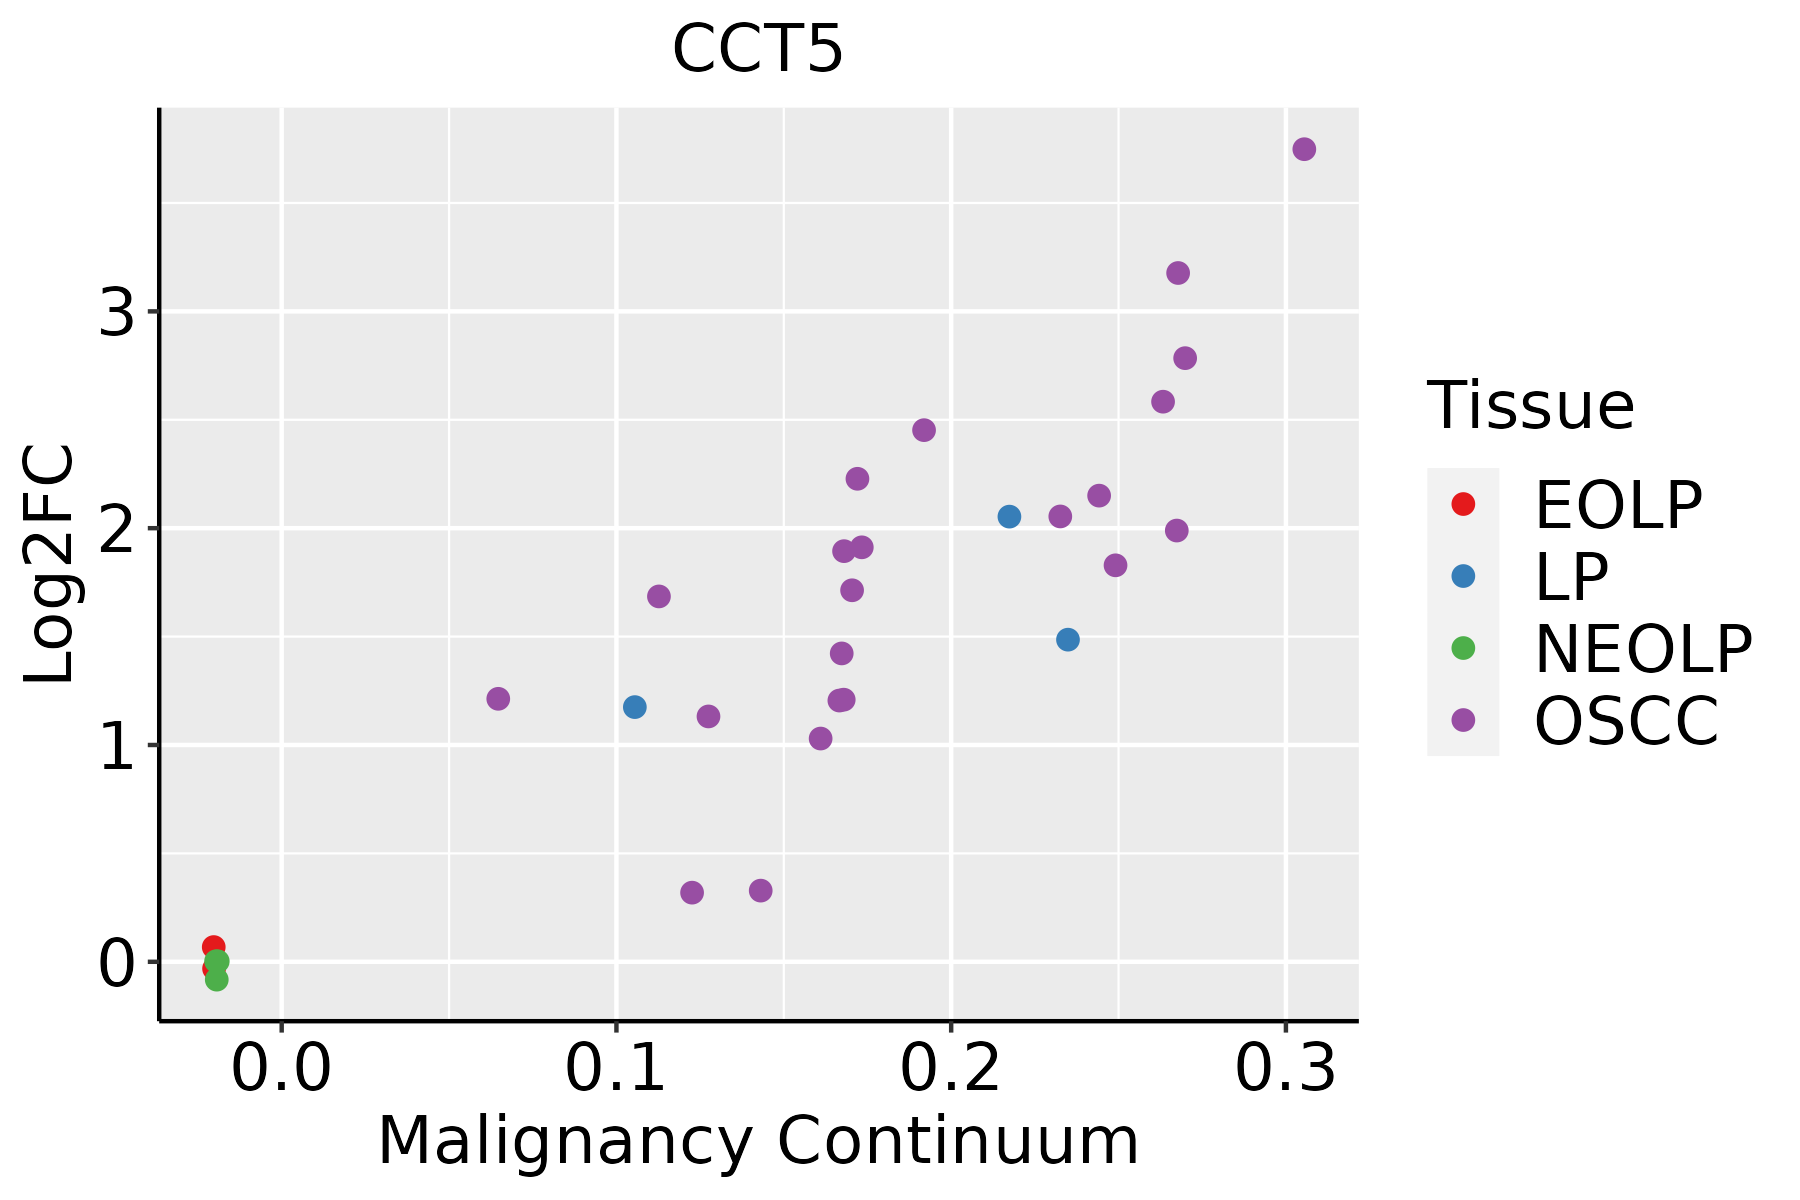 | EOLP: Erosive Oral lichen planus |
| LP: leukoplakia | ||
| NEOLP: Non-erosive oral lichen planus | ||
| OSCC: Oral squamous cell carcinoma | ||
| Prostate |  | BPH: Benign Prostatic Hyperplasia |
| Skin | 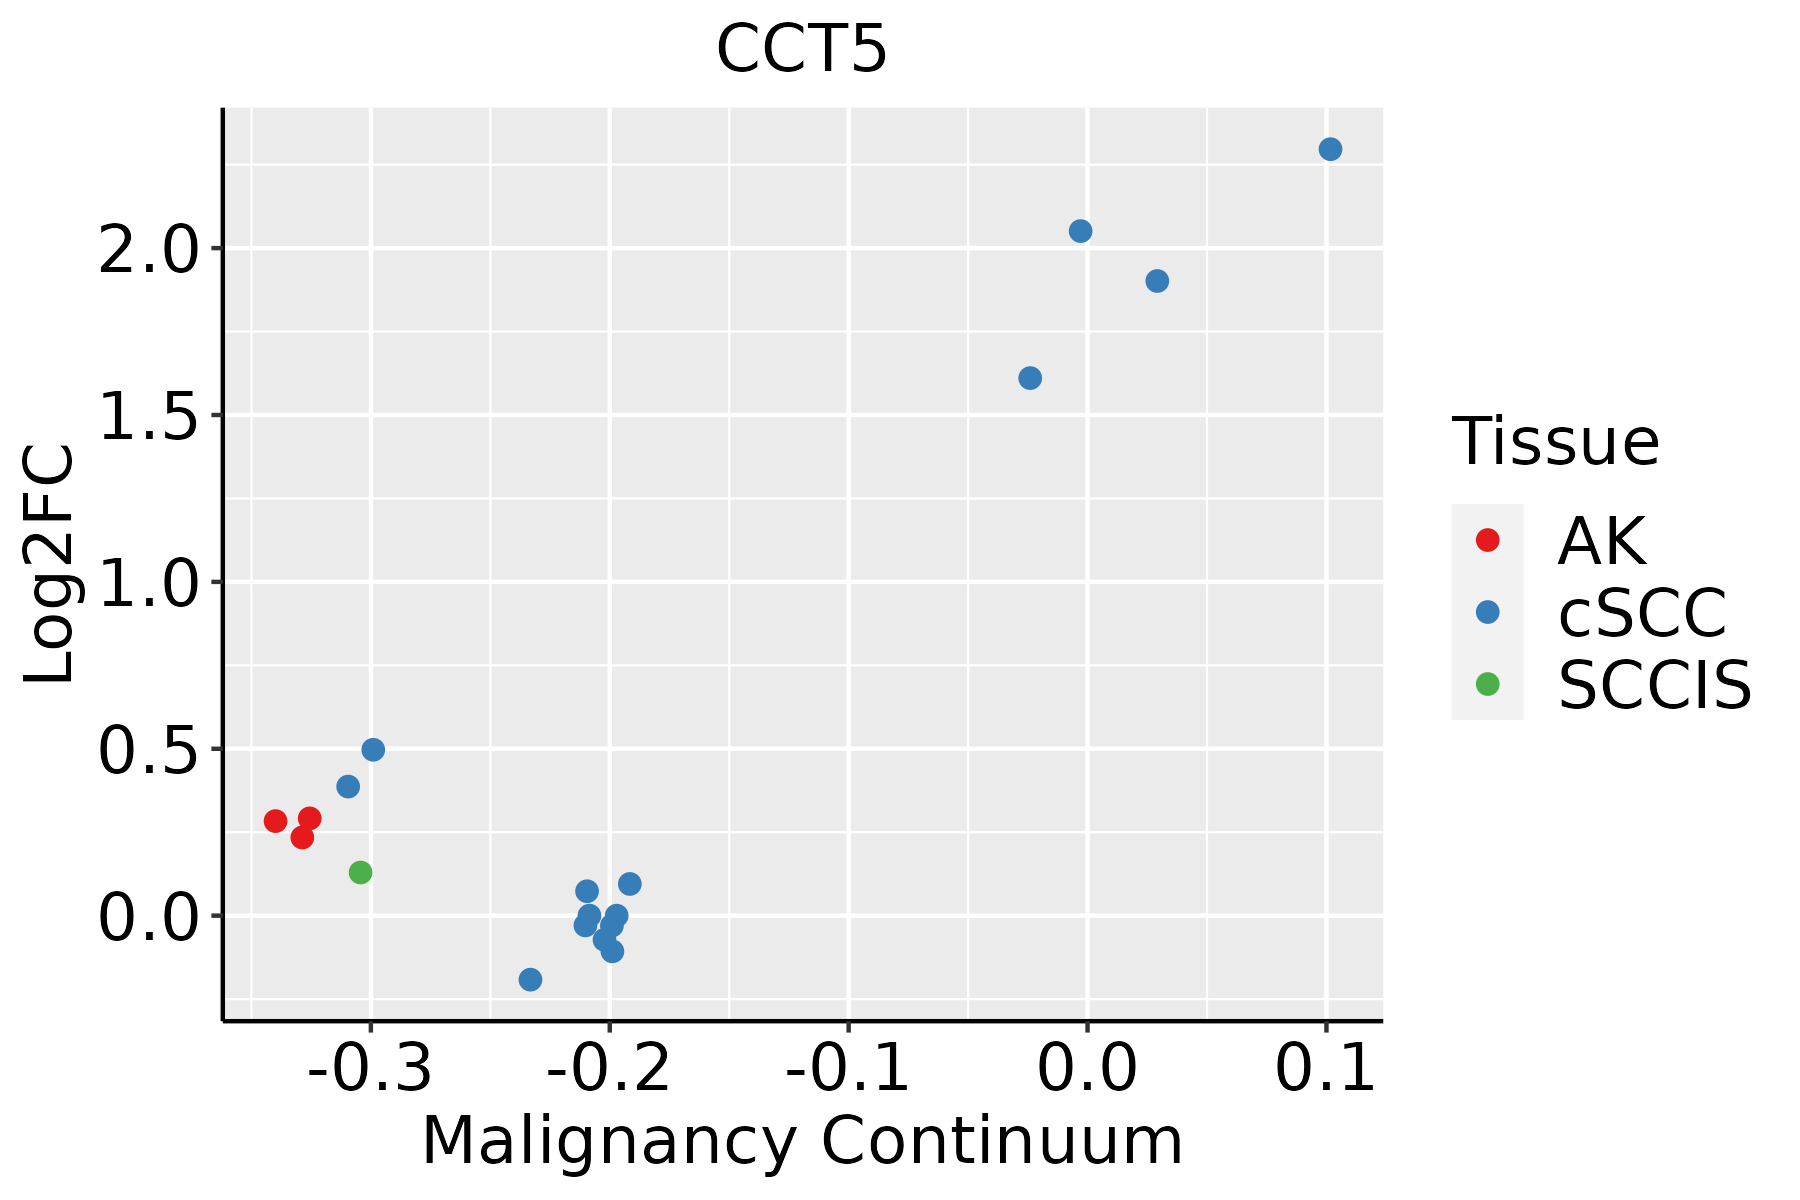 | AK: Actinic keratosis |
| cSCC: Cutaneous squamous cell carcinoma | ||
| SCCIS:squamous cell carcinoma in situ | ||
| Thyroid | 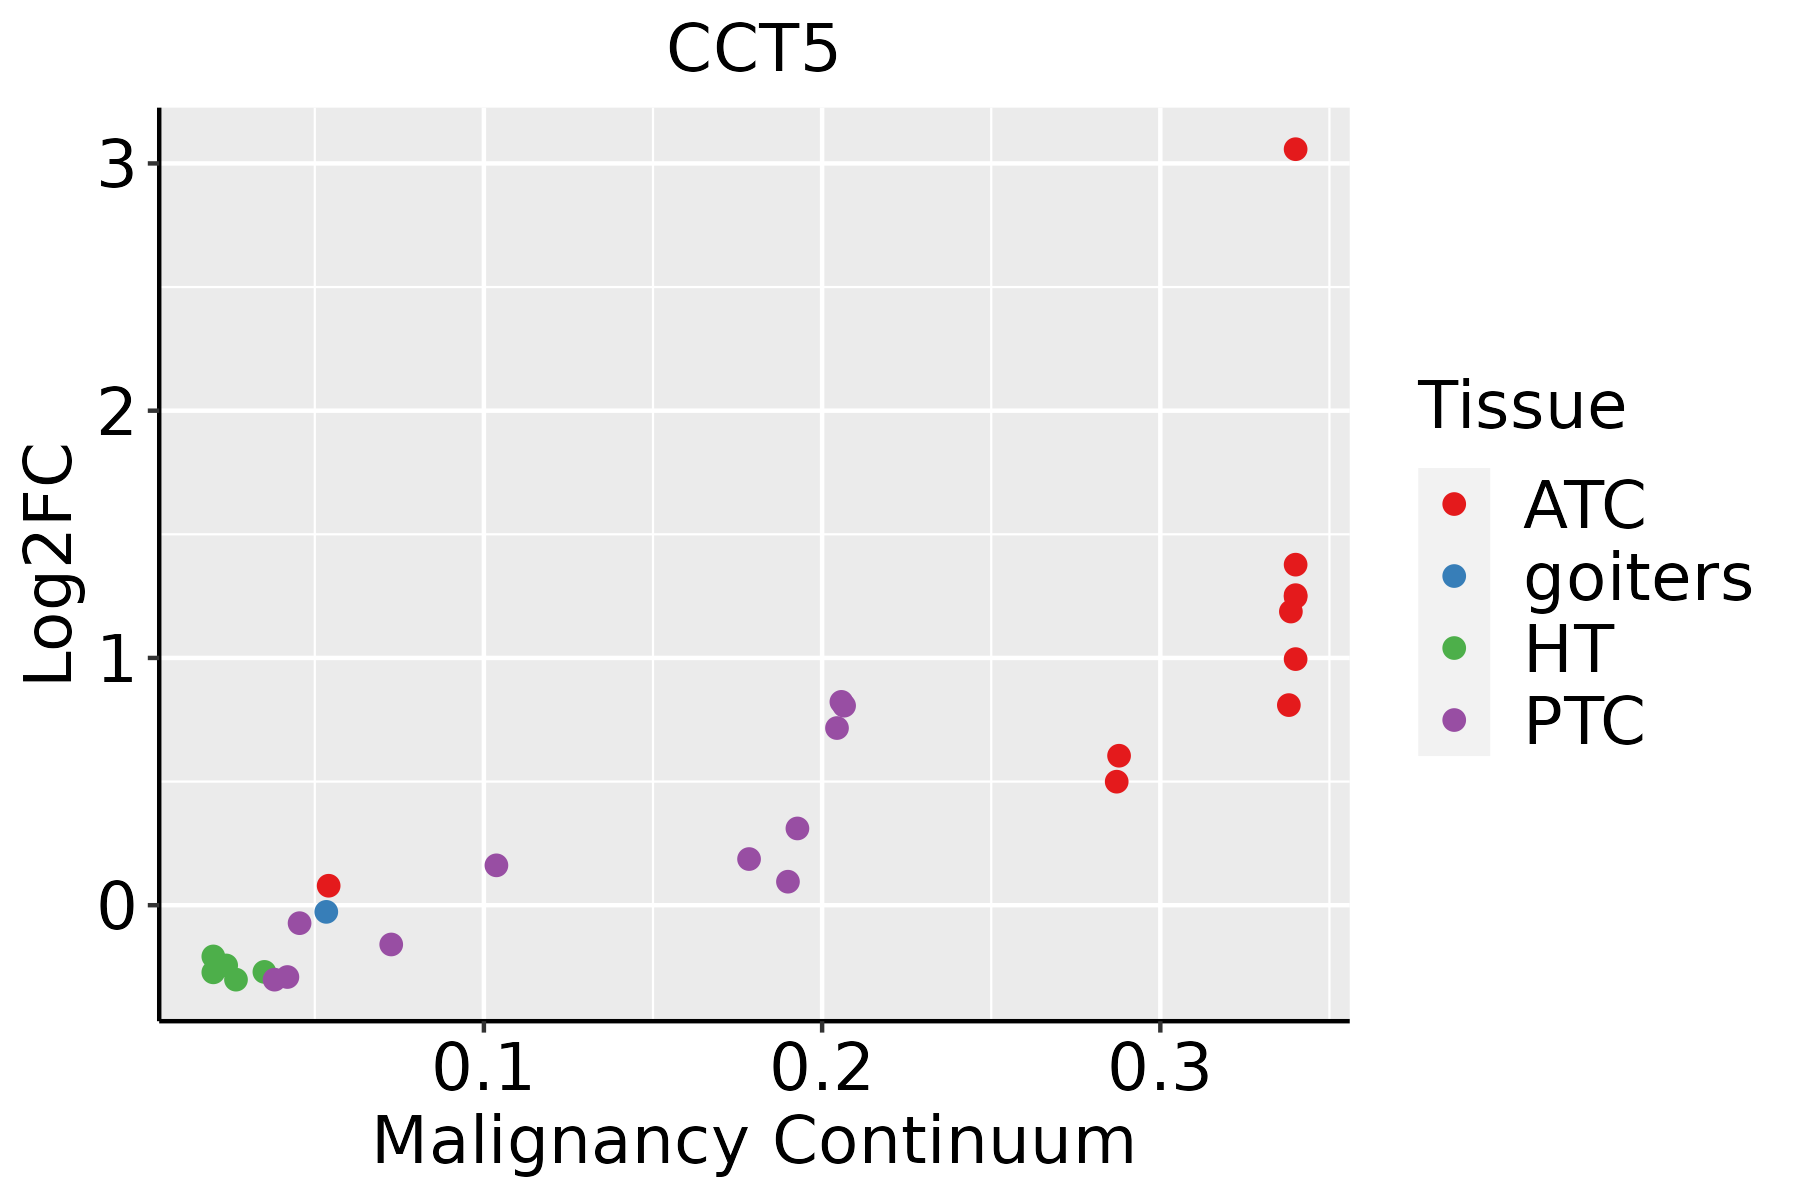 | ATC: Anaplastic thyroid cancer |
| HT: Hashimoto's thyroiditis | ||
| PTC: Papillary thyroid cancer |
| ∗log2FC in expression of this searched gene in stem-like cells from each diseased tissue sample relative to stem-like cells in normal samples in each tissue plotted against the malignancy continuum. Samples are colored based on if they are from different disease stage. |
Top |
Malignant transformation related pathway analysis |
| Find out the enriched GO biological processes and KEGG pathways involved in transition from healthy to precancer to cancer |
| Tissue | Disease Stage | Enriched GO biological Processes |
| Colorectum | AD |  |
| Colorectum | SER |  |
| Colorectum | MSS |  |
| Colorectum | MSI-H |  |
| Colorectum | FAP |  |
| ∗Top 15 enriched GO BP terms are showed in the bar plot of each disease state in each tissue. Each row represents a significant GO biological process which is colored according to the -log10(p.adjust). |
| Page: 1 2 3 4 5 6 7 8 9 |
| GO ID | Tissue | Disease Stage | Description | Gene Ratio | Bg Ratio | pvalue | p.adjust | Count |
| GO:000072320 | Skin | AK | telomere maintenance | 31/1910 | 131/18723 | 6.10e-06 | 1.39e-04 | 31 |
| GO:003220418 | Skin | AK | regulation of telomere maintenance | 22/1910 | 80/18723 | 1.08e-05 | 2.28e-04 | 22 |
| GO:190018019 | Skin | AK | regulation of protein localization to nucleus | 31/1910 | 136/18723 | 1.37e-05 | 2.70e-04 | 31 |
| GO:200125220 | Skin | AK | positive regulation of chromosome organization | 22/1910 | 82/18723 | 1.65e-05 | 3.16e-04 | 22 |
| GO:000961519 | Skin | AK | response to virus | 63/1910 | 367/18723 | 2.53e-05 | 4.54e-04 | 63 |
| GO:190018218 | Skin | AK | positive regulation of protein localization to nucleus | 22/1910 | 87/18723 | 4.49e-05 | 7.06e-04 | 22 |
| GO:005105216 | Skin | AK | regulation of DNA metabolic process | 60/1910 | 359/18723 | 8.56e-05 | 1.17e-03 | 60 |
| GO:200027820 | Skin | AK | regulation of DNA biosynthetic process | 24/1910 | 106/18723 | 1.38e-04 | 1.69e-03 | 24 |
| GO:001083320 | Skin | AK | telomere maintenance via telomere lengthening | 20/1910 | 81/18723 | 1.40e-04 | 1.70e-03 | 20 |
| GO:000700419 | Skin | AK | telomere maintenance via telomerase | 18/1910 | 69/18723 | 1.40e-04 | 1.70e-03 | 18 |
| GO:003220619 | Skin | AK | positive regulation of telomere maintenance | 15/1910 | 52/18723 | 1.48e-04 | 1.77e-03 | 15 |
| GO:00322008 | Skin | AK | telomere organization | 31/1910 | 159/18723 | 3.03e-04 | 3.12e-03 | 31 |
| GO:000627817 | Skin | AK | RNA-dependent DNA biosynthetic process | 18/1910 | 75/18723 | 4.30e-04 | 4.05e-03 | 18 |
| GO:190435820 | Skin | AK | positive regulation of telomere maintenance via telomere lengthening | 11/1910 | 37/18723 | 8.40e-04 | 6.96e-03 | 11 |
| GO:190435617 | Skin | AK | regulation of telomere maintenance via telomere lengthening | 15/1910 | 61/18723 | 9.64e-04 | 7.68e-03 | 15 |
| GO:005105418 | Skin | AK | positive regulation of DNA metabolic process | 35/1910 | 201/18723 | 1.14e-03 | 8.83e-03 | 35 |
| GO:00322109 | Skin | AK | regulation of telomere maintenance via telomerase | 13/1910 | 53/18723 | 2.11e-03 | 1.40e-02 | 13 |
| GO:200057320 | Skin | AK | positive regulation of DNA biosynthetic process | 15/1910 | 66/18723 | 2.26e-03 | 1.49e-02 | 15 |
| GO:007189717 | Skin | AK | DNA biosynthetic process | 31/1910 | 180/18723 | 2.53e-03 | 1.63e-02 | 31 |
| GO:007020218 | Skin | AK | regulation of establishment of protein localization to chromosome | 5/1910 | 12/18723 | 4.71e-03 | 2.69e-02 | 5 |
| Page: 1 2 3 4 5 6 7 8 9 10 11 12 13 14 15 16 17 18 19 20 21 22 23 24 25 26 27 28 29 30 31 32 33 34 35 36 37 38 39 40 41 42 43 44 |
| Pathway ID | Tissue | Disease Stage | Description | Gene Ratio | Bg Ratio | pvalue | p.adjust | qvalue | Count |
| Page: 1 |
Top |
Cell-cell communication analysis |
| Identification of potential cell-cell interactions between two cell types and their ligand-receptor pairs for different disease states |
| Ligand | Receptor | LRpair | Pathway | Tissue | Disease Stage |
| Page: 1 |
Top |
Single-cell gene regulatory network inference analysis |
| Find out the significant the regulons (TFs) and the target genes of each regulon across cell types for different disease states |
| TF | Cell Type | Tissue | Disease Stage | Target Gene | RSS | Regulon Activity |
| ∗The dot plots of a searched regulon are shown for all cell subpopulations in each disease state of each tissue based on the regulon specific score inferred using pySCENIC and by calculating the average expression. |
| Page: 1 |
Top |
Somatic mutation of malignant transformation related genes |
| Annotation of somatic variants for genes involved in malignant transformation |
| Hugo Symbol | Variant Class | Variant Classification | dbSNP RS | HGVSc | HGVSp | HGVSp Short | SWISSPROT | BIOTYPE | SIFT | PolyPhen | Tumor Sample Barcode | Tissue | Histology | Sex | Age | Stage | Therapy Types | Drugs | Outcome |
| CCT5 | SNV | Missense_Mutation | rs762786367 | c.1046N>T | p.Thr349Ile | p.T349I | P48643 | protein_coding | deleterious(0) | possibly_damaging(0.71) | TCGA-BH-A0AW-01 | Breast | breast invasive carcinoma | Female | <65 | I/II | Chemotherapy | carboplatin | SD |
| CCT5 | SNV | Missense_Mutation | c.1031G>T | p.Arg344Met | p.R344M | P48643 | protein_coding | deleterious(0) | probably_damaging(0.988) | TCGA-BH-A18G-01 | Breast | breast invasive carcinoma | Female | >=65 | I/II | Unknown | Unknown | SD | |
| CCT5 | SNV | Missense_Mutation | c.1018C>T | p.Arg340Trp | p.R340W | P48643 | protein_coding | deleterious(0) | probably_damaging(0.996) | TCGA-2W-A8YY-01 | Cervix | cervical & endocervical cancer | Female | <65 | I/II | Chemotherapy | cisplatin | CR | |
| CCT5 | SNV | Missense_Mutation | c.1018N>T | p.Arg340Trp | p.R340W | P48643 | protein_coding | deleterious(0) | probably_damaging(0.996) | TCGA-VS-A9U6-01 | Cervix | cervical & endocervical cancer | Female | <65 | I/II | Chemotherapy | cisplatin | PD | |
| CCT5 | SNV | Missense_Mutation | rs768768696 | c.1006G>A | p.Ala336Thr | p.A336T | P48643 | protein_coding | tolerated(0.07) | benign(0.325) | TCGA-A6-5661-01 | Colorectum | colon adenocarcinoma | Female | >=65 | I/II | Unknown | Unknown | SD |
| CCT5 | SNV | Missense_Mutation | novel | c.359N>T | p.Ala120Val | p.A120V | P48643 | protein_coding | deleterious(0) | probably_damaging(1) | TCGA-AA-3949-01 | Colorectum | colon adenocarcinoma | Female | >=65 | III/IV | Unknown | Unknown | SD |
| CCT5 | SNV | Missense_Mutation | rs768768696 | c.1006N>A | p.Ala336Thr | p.A336T | P48643 | protein_coding | tolerated(0.07) | benign(0.325) | TCGA-AA-3949-01 | Colorectum | colon adenocarcinoma | Female | >=65 | III/IV | Unknown | Unknown | SD |
| CCT5 | SNV | Missense_Mutation | c.338N>A | p.Ala113Asp | p.A113D | P48643 | protein_coding | deleterious(0) | probably_damaging(0.994) | TCGA-AA-A010-01 | Colorectum | colon adenocarcinoma | Female | <65 | I/II | Chemotherapy | folinic | CR | |
| CCT5 | SNV | Missense_Mutation | novel | c.819N>G | p.Asp273Glu | p.D273E | P48643 | protein_coding | tolerated(1) | benign(0.019) | TCGA-AA-A02R-01 | Colorectum | colon adenocarcinoma | Female | >=65 | I/II | Unknown | Unknown | PD |
| CCT5 | SNV | Missense_Mutation | c.1400N>A | p.Gly467Asp | p.G467D | P48643 | protein_coding | deleterious(0) | probably_damaging(1) | TCGA-CM-5861-01 | Colorectum | colon adenocarcinoma | Female | <65 | I/II | Unknown | Unknown | PD |
| Page: 1 2 3 4 5 6 |
Top |
Related drugs of malignant transformation related genes |
| Identification of chemicals and drugs interact with genes involved in malignant transfromation |
| (DGIdb 4.0) |
| Entrez ID | Symbol | Category | Interaction Types | Drug Claim Name | Drug Name | PMIDs |
| Page: 1 |

Copyright 2023-Present -The University of Texas Health Science Center at Houston |