
|
|||||
|
 | |
| |
| |
| |
| |
| |
|
Gene: BTG2 |
Gene summary for BTG2 |
| Gene information | Species | Human | Gene symbol | BTG2 | Gene ID | 7832 |
| Gene name | BTG anti-proliferation factor 2 | |
| Gene Alias | APRO1 | |
| Cytomap | 1q32.1 | |
| Gene Type | protein-coding | GO ID | GO:0000122 | UniProtAcc | P78543 |
Top |
Malignant transformation analysis |
| Identification of the aberrant gene expression in precancerous and cancerous lesions by comparing the gene expression of stem-like cells in diseased tissues with normal stem cells |
| Entrez ID | Symbol | Replicates | Species | Organ | Tissue | Adj P-value | Log2FC | Malignancy |
| 7832 | BTG2 | GSM4909282 | Human | Breast | IDC | 1.00e-51 | 1.09e+00 | -0.0288 |
| 7832 | BTG2 | GSM4909286 | Human | Breast | IDC | 4.61e-03 | -1.98e-01 | 0.1081 |
| 7832 | BTG2 | GSM4909290 | Human | Breast | IDC | 1.63e-10 | -4.38e-01 | 0.2096 |
| 7832 | BTG2 | GSM4909293 | Human | Breast | IDC | 1.41e-04 | 3.93e-01 | 0.1581 |
| 7832 | BTG2 | GSM4909296 | Human | Breast | IDC | 6.89e-06 | -3.06e-01 | 0.1524 |
| 7832 | BTG2 | GSM4909297 | Human | Breast | IDC | 2.71e-10 | 3.25e-01 | 0.1517 |
| 7832 | BTG2 | GSM4909298 | Human | Breast | IDC | 1.41e-14 | 6.32e-01 | 0.1551 |
| 7832 | BTG2 | GSM4909299 | Human | Breast | IDC | 9.89e-15 | 5.71e-01 | 0.035 |
| 7832 | BTG2 | GSM4909300 | Human | Breast | IDC | 3.61e-02 | 4.77e-01 | 0.0334 |
| 7832 | BTG2 | GSM4909301 | Human | Breast | IDC | 1.02e-25 | 7.35e-01 | 0.1577 |
| 7832 | BTG2 | GSM4909303 | Human | Breast | IDC | 1.88e-09 | 8.03e-01 | 0.0438 |
| 7832 | BTG2 | GSM4909305 | Human | Breast | IDC | 3.40e-06 | 4.44e-01 | 0.0436 |
| 7832 | BTG2 | GSM4909306 | Human | Breast | IDC | 2.22e-09 | 4.00e-01 | 0.1564 |
| 7832 | BTG2 | GSM4909308 | Human | Breast | IDC | 8.37e-65 | 1.20e+00 | 0.158 |
| 7832 | BTG2 | GSM4909311 | Human | Breast | IDC | 3.11e-13 | -7.53e-02 | 0.1534 |
| 7832 | BTG2 | GSM4909312 | Human | Breast | IDC | 7.28e-39 | 9.42e-01 | 0.1552 |
| 7832 | BTG2 | GSM4909313 | Human | Breast | IDC | 3.42e-40 | 1.10e+00 | 0.0391 |
| 7832 | BTG2 | GSM4909315 | Human | Breast | IDC | 3.14e-07 | -3.70e-01 | 0.21 |
| 7832 | BTG2 | GSM4909319 | Human | Breast | IDC | 3.08e-21 | 2.38e-01 | 0.1563 |
| 7832 | BTG2 | GSM4909321 | Human | Breast | IDC | 3.81e-26 | 7.90e-01 | 0.1559 |
| Page: 1 2 3 4 5 6 7 8 9 10 11 12 13 |
| Tissue | Expression Dynamics | Abbreviation |
| Breast | 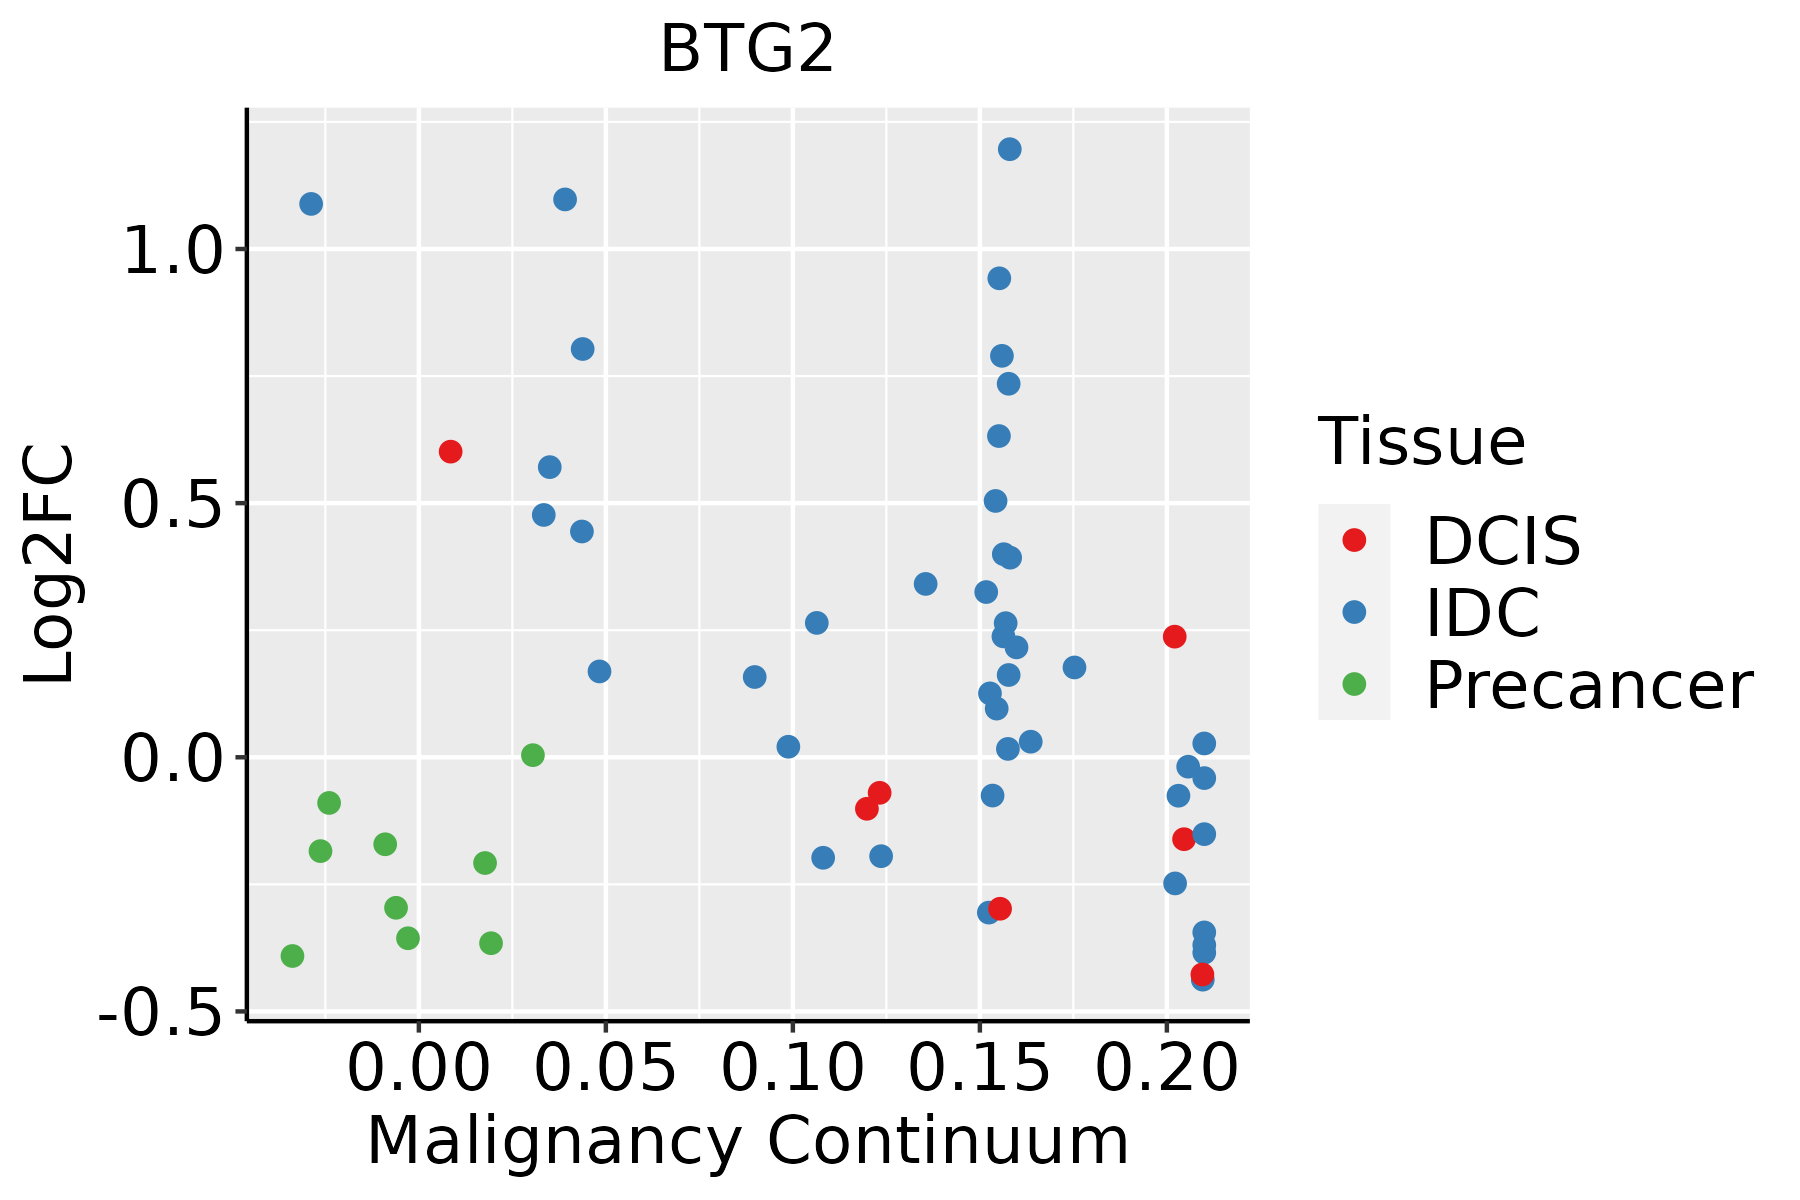 | IDC: Invasive ductal carcinoma |
| DCIS: Ductal carcinoma in situ | ||
| Precancer(BRCA1-mut): Precancerous lesion from BRCA1 mutation carriers | ||
| Cervix |  | CC: Cervix cancer |
| HSIL_HPV: HPV-infected high-grade squamous intraepithelial lesions | ||
| N_HPV: HPV-infected normal cervix | ||
| Endometrium | 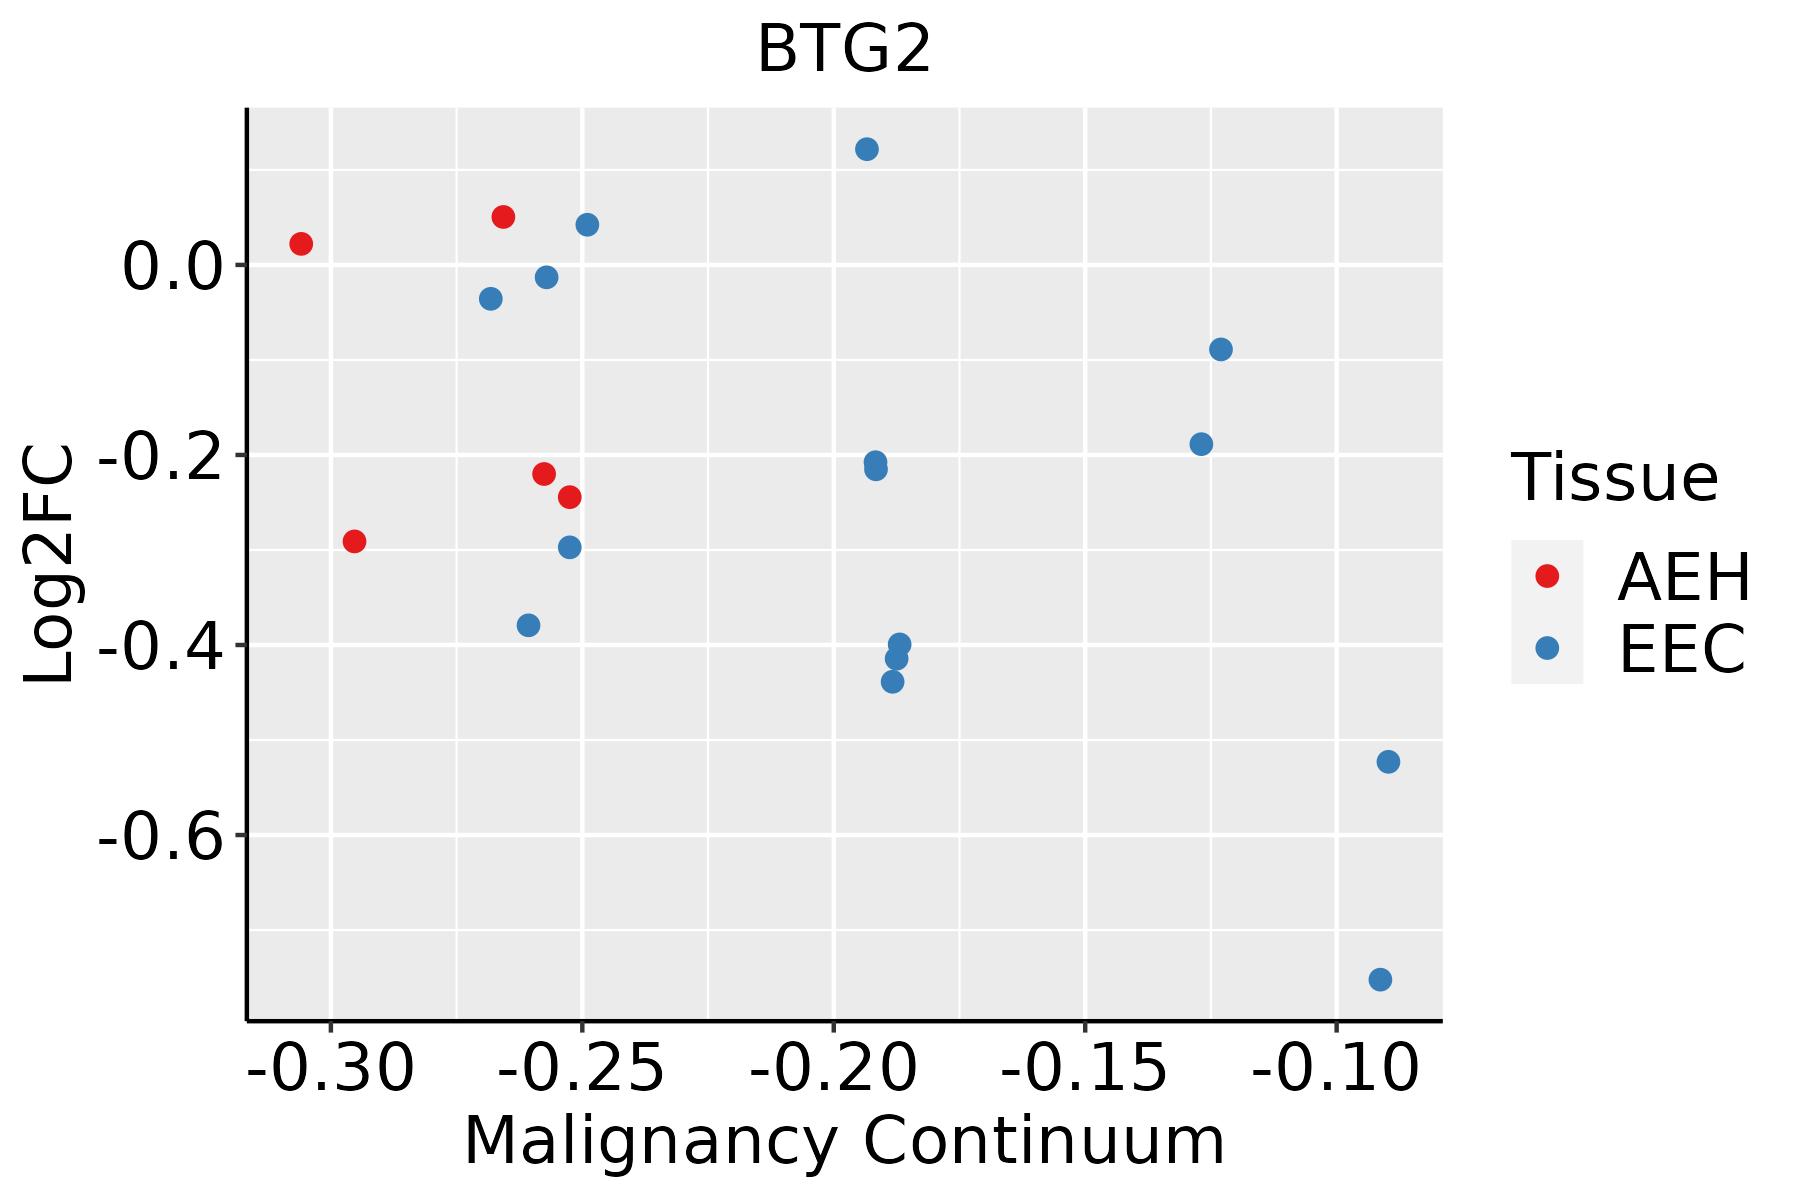 | AEH: Atypical endometrial hyperplasia |
| EEC: Endometrioid Cancer | ||
| Esophagus | 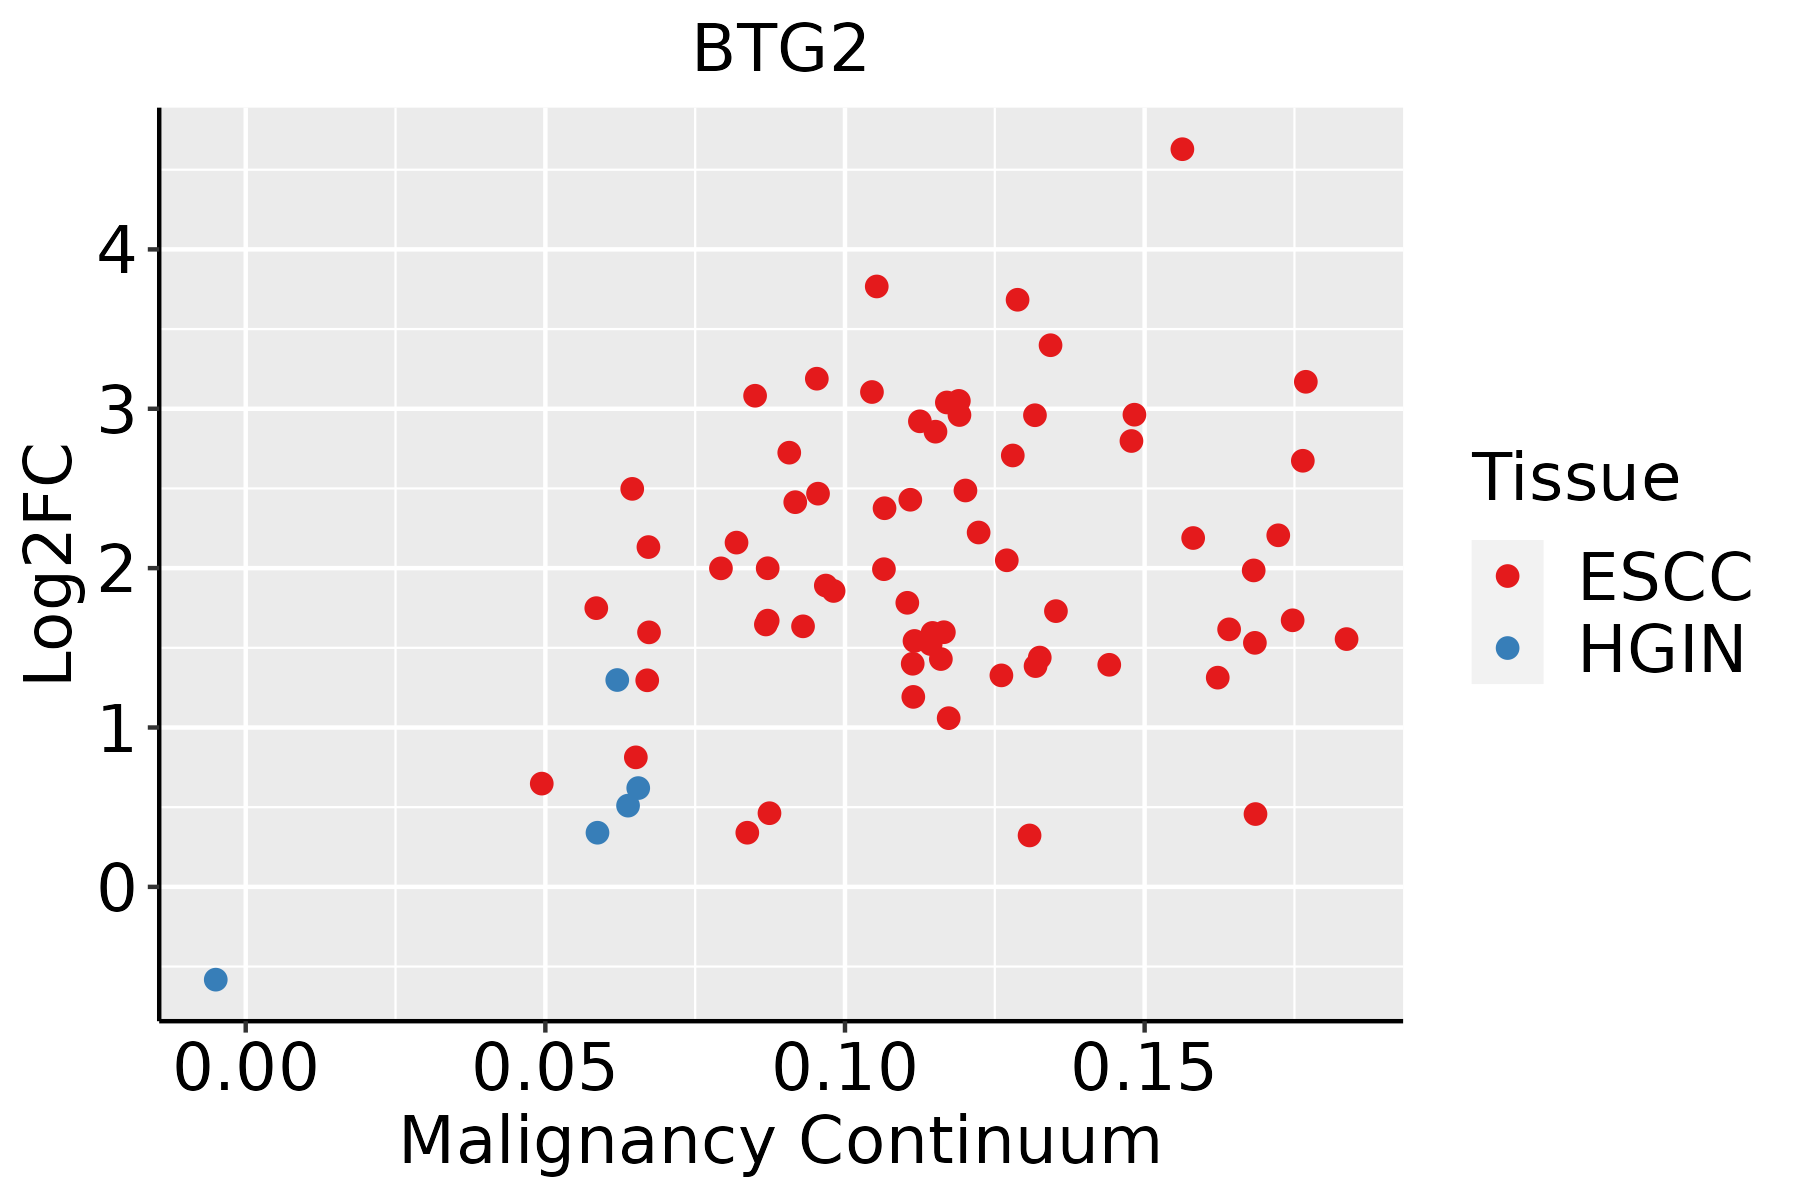 | ESCC: Esophageal squamous cell carcinoma |
| HGIN: High-grade intraepithelial neoplasias | ||
| LGIN: Low-grade intraepithelial neoplasias | ||
| GC | 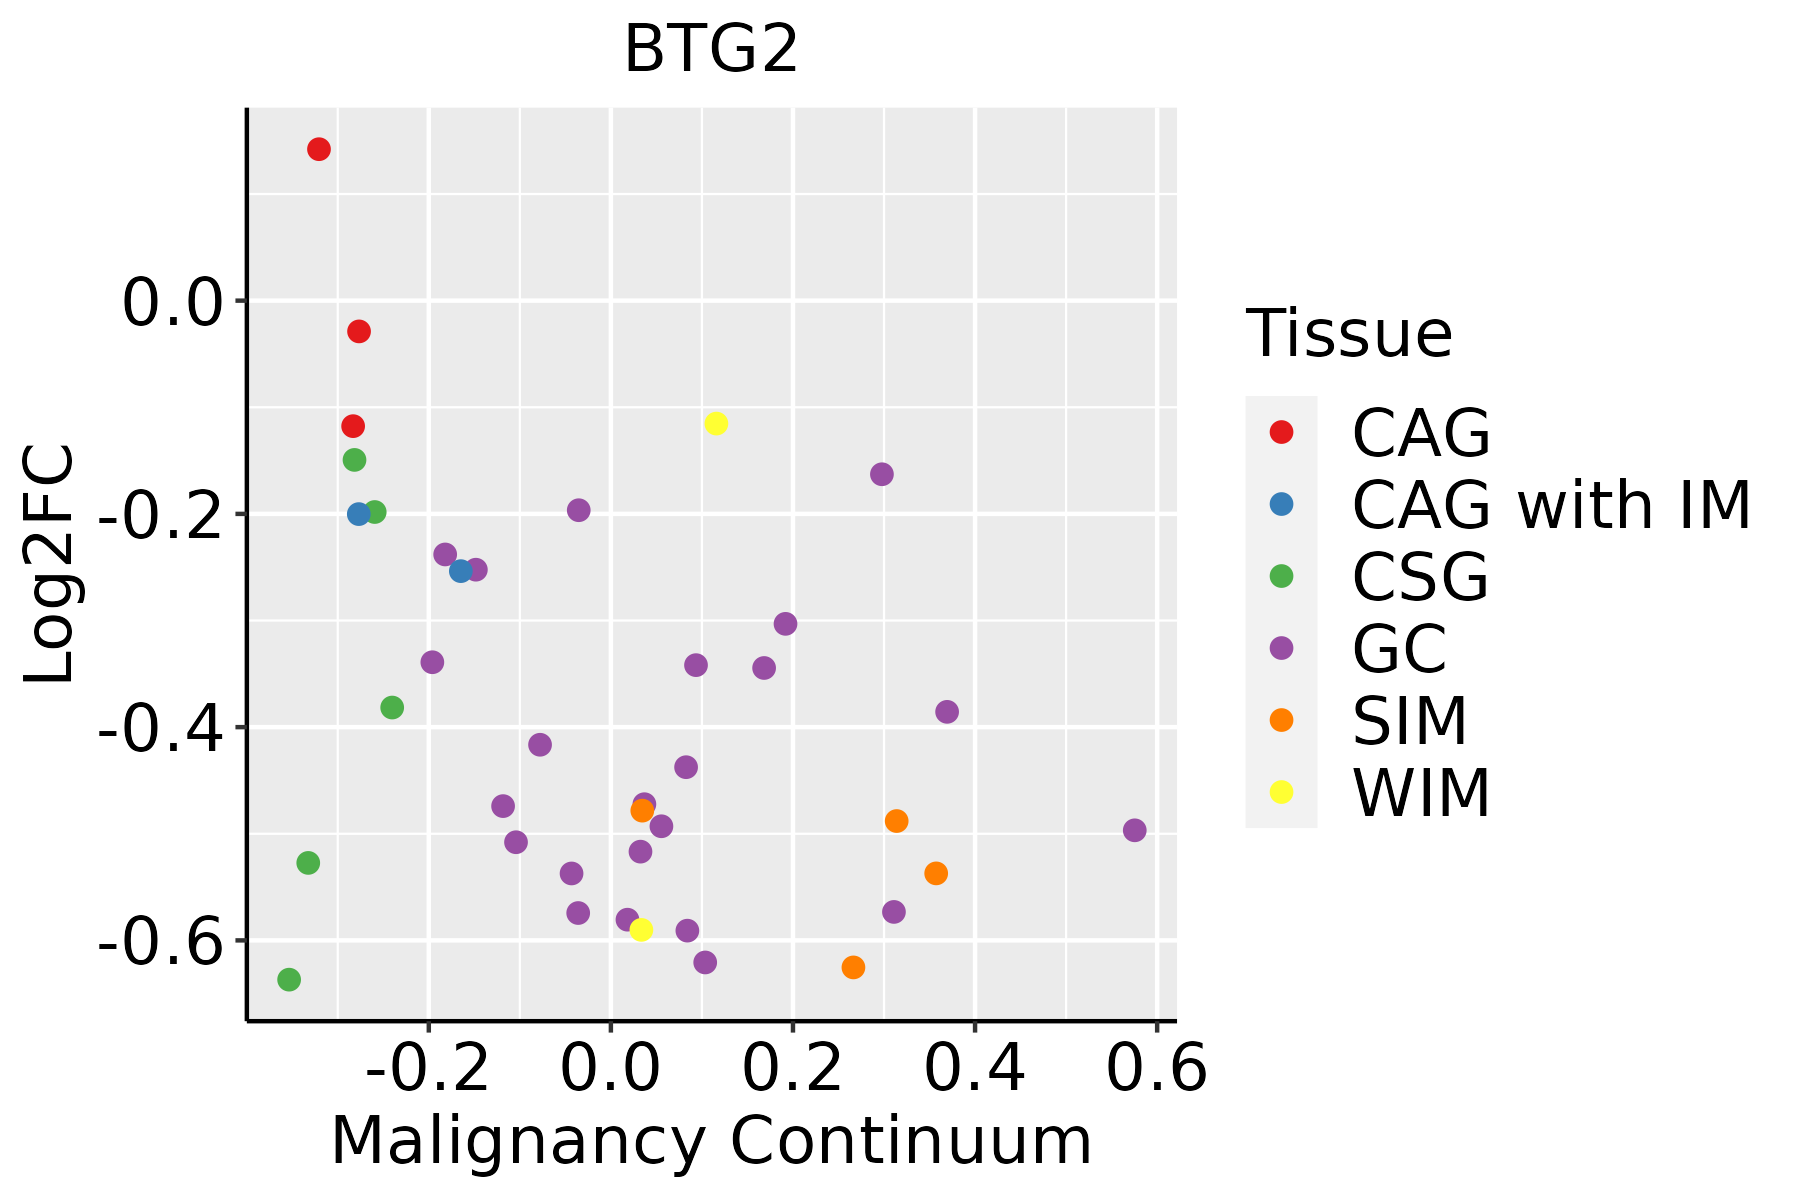 | CAG: Chronic atrophic gastritis |
| CAG with IM: Chronic atrophic gastritis with intestinal metaplasia | ||
| CSG: Chronic superficial gastritis | ||
| GC: Gastric cancer | ||
| SIM: Severe intestinal metaplasia | ||
| WIM: Wild intestinal metaplasia | ||
| Liver | 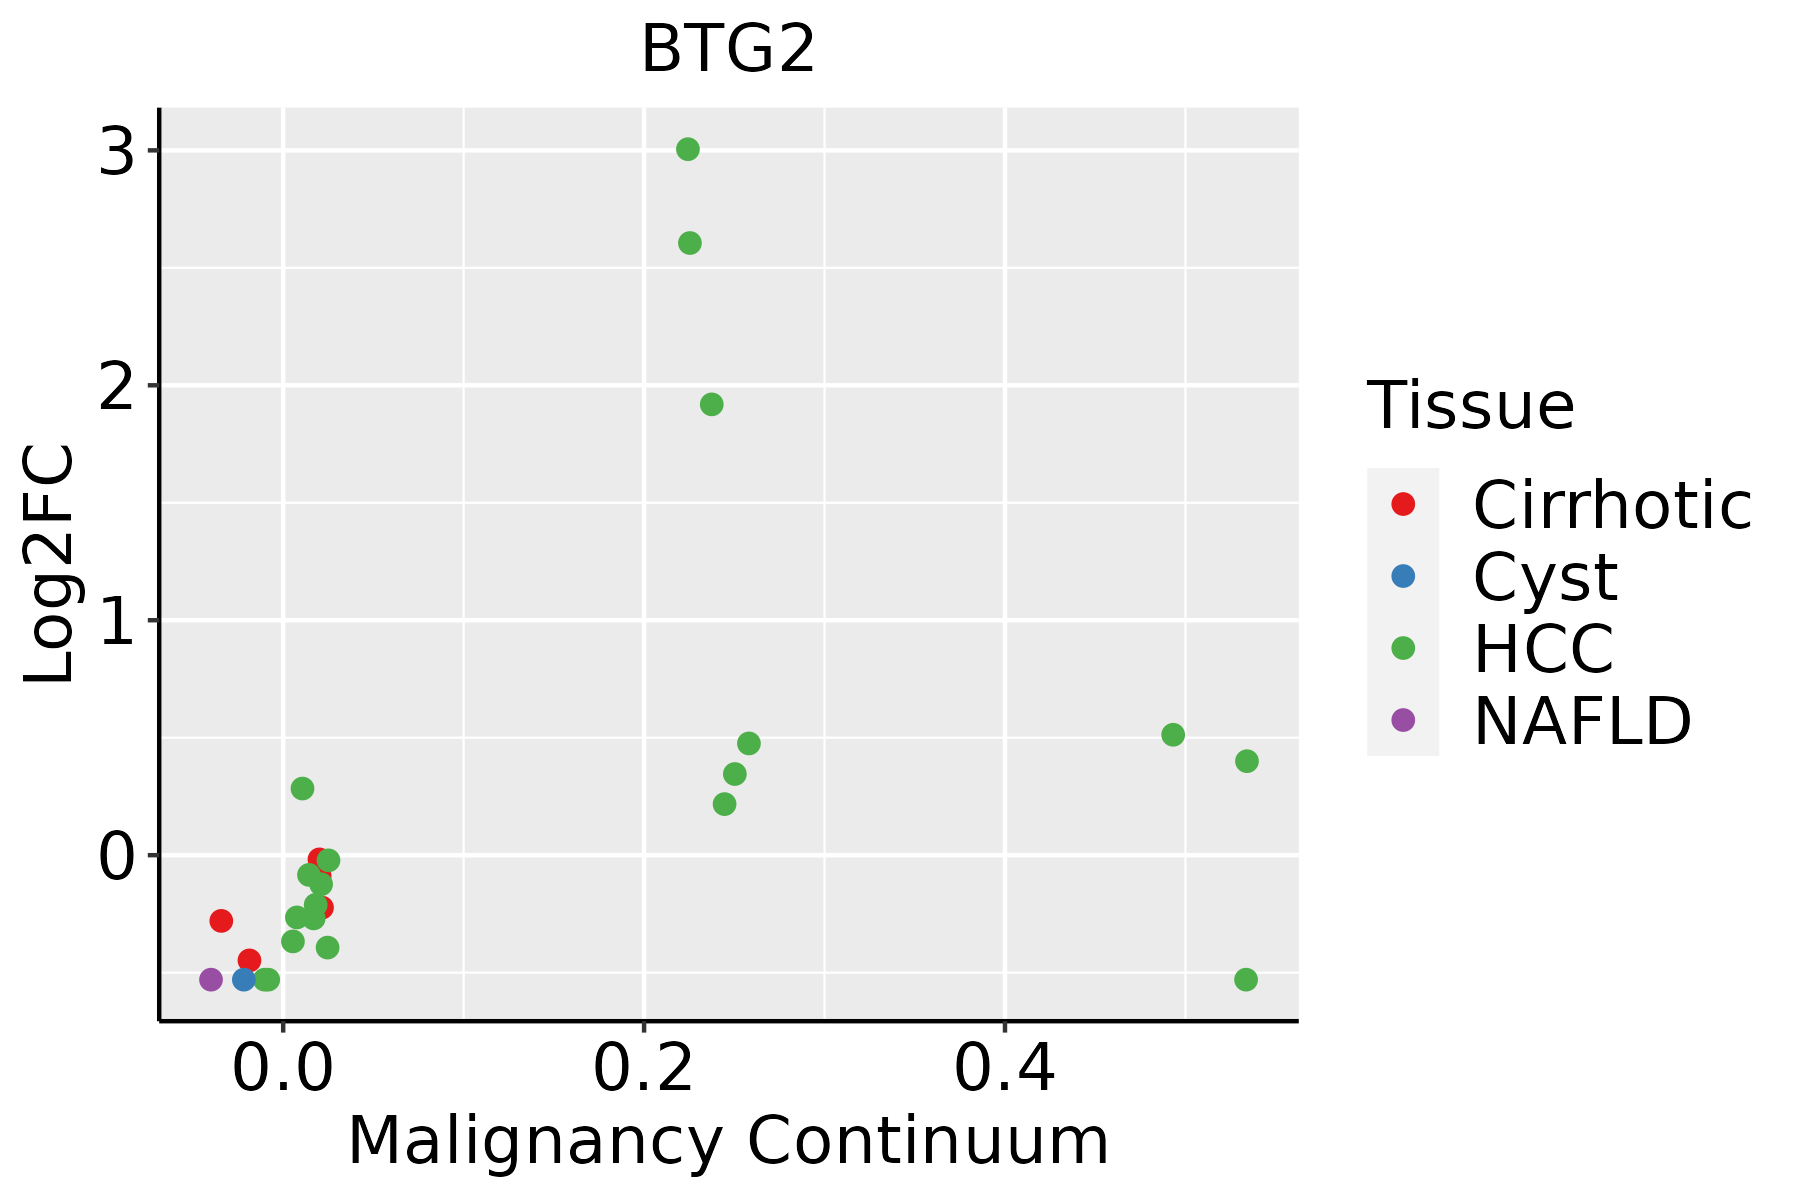 | HCC: Hepatocellular carcinoma |
| NAFLD: Non-alcoholic fatty liver disease | ||
| Lung |  | AAH: Atypical adenomatous hyperplasia |
| AIS: Adenocarcinoma in situ | ||
| IAC: Invasive lung adenocarcinoma | ||
| MIA: Minimally invasive adenocarcinoma | ||
| Oral Cavity | 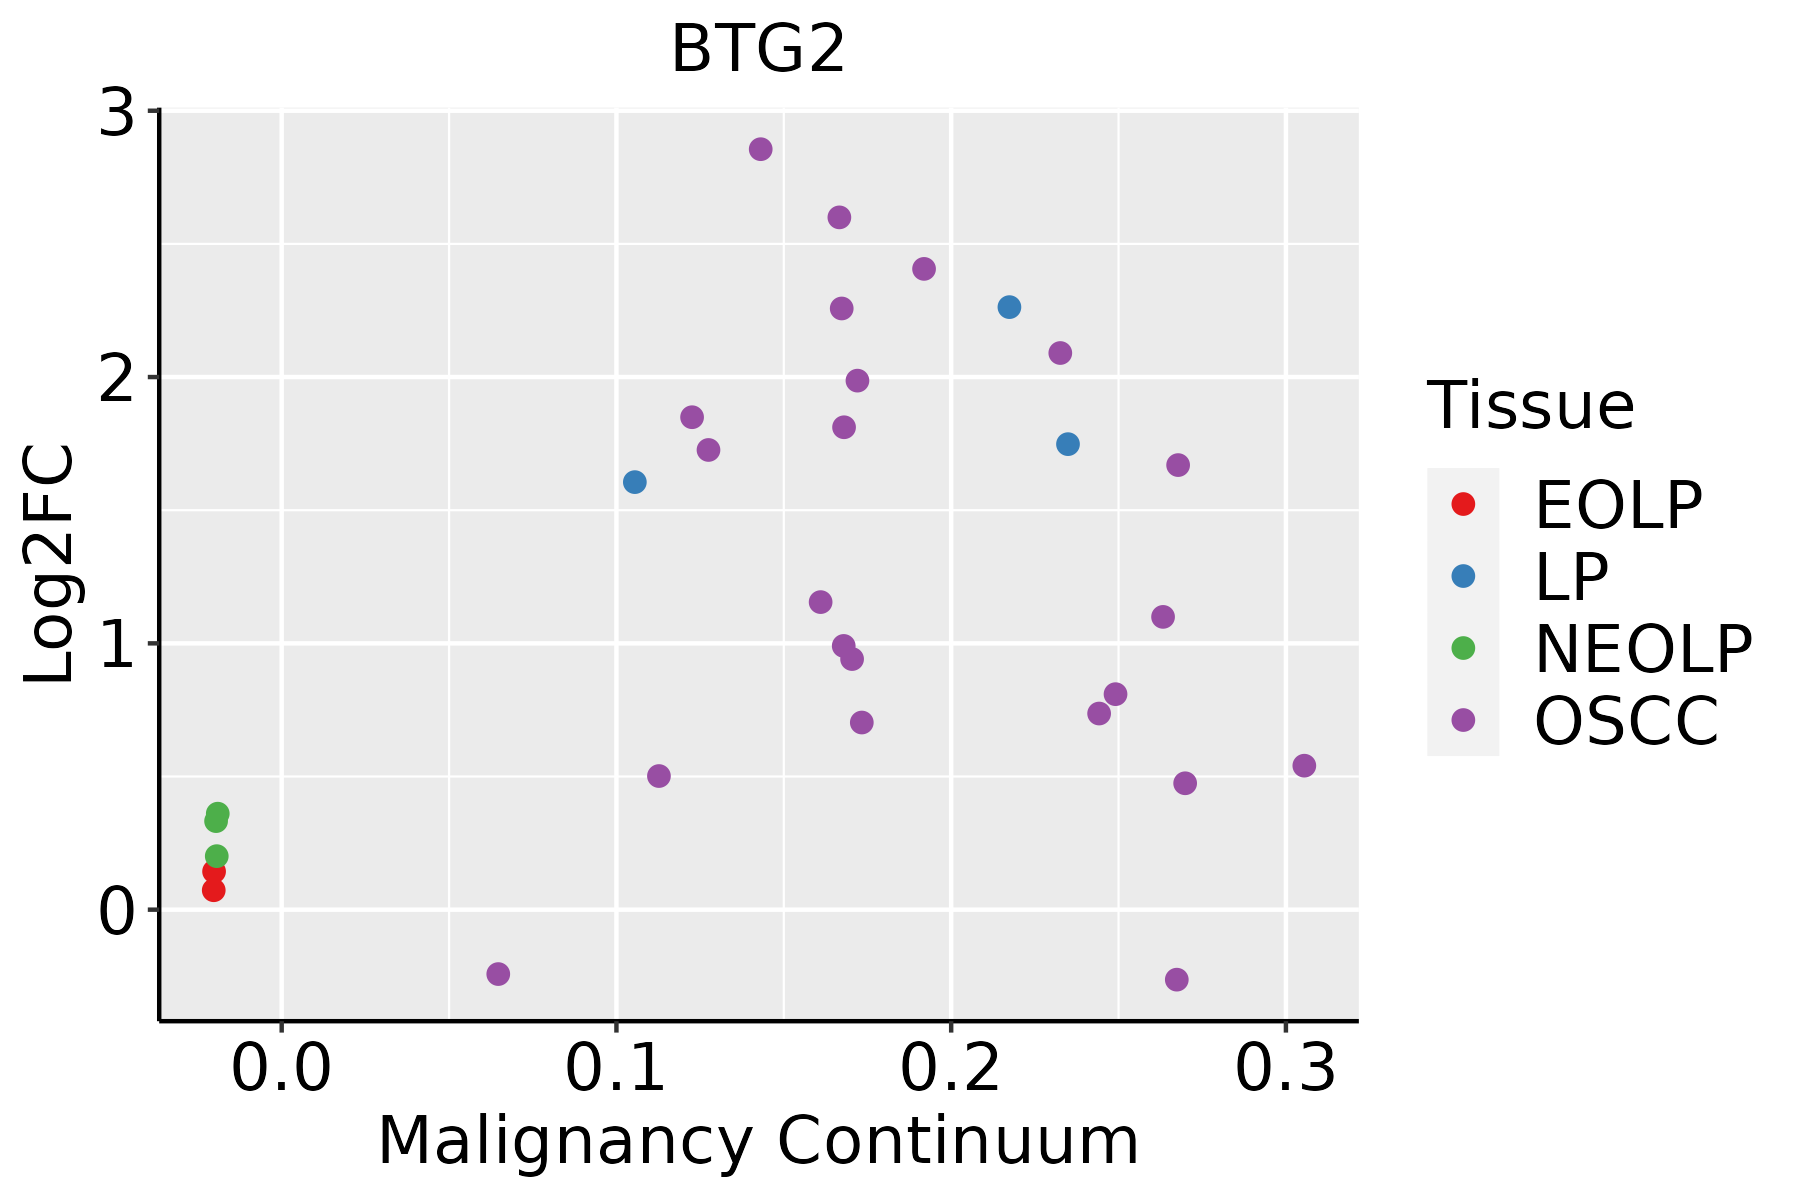 | EOLP: Erosive Oral lichen planus |
| LP: leukoplakia | ||
| NEOLP: Non-erosive oral lichen planus | ||
| OSCC: Oral squamous cell carcinoma | ||
| Prostate | 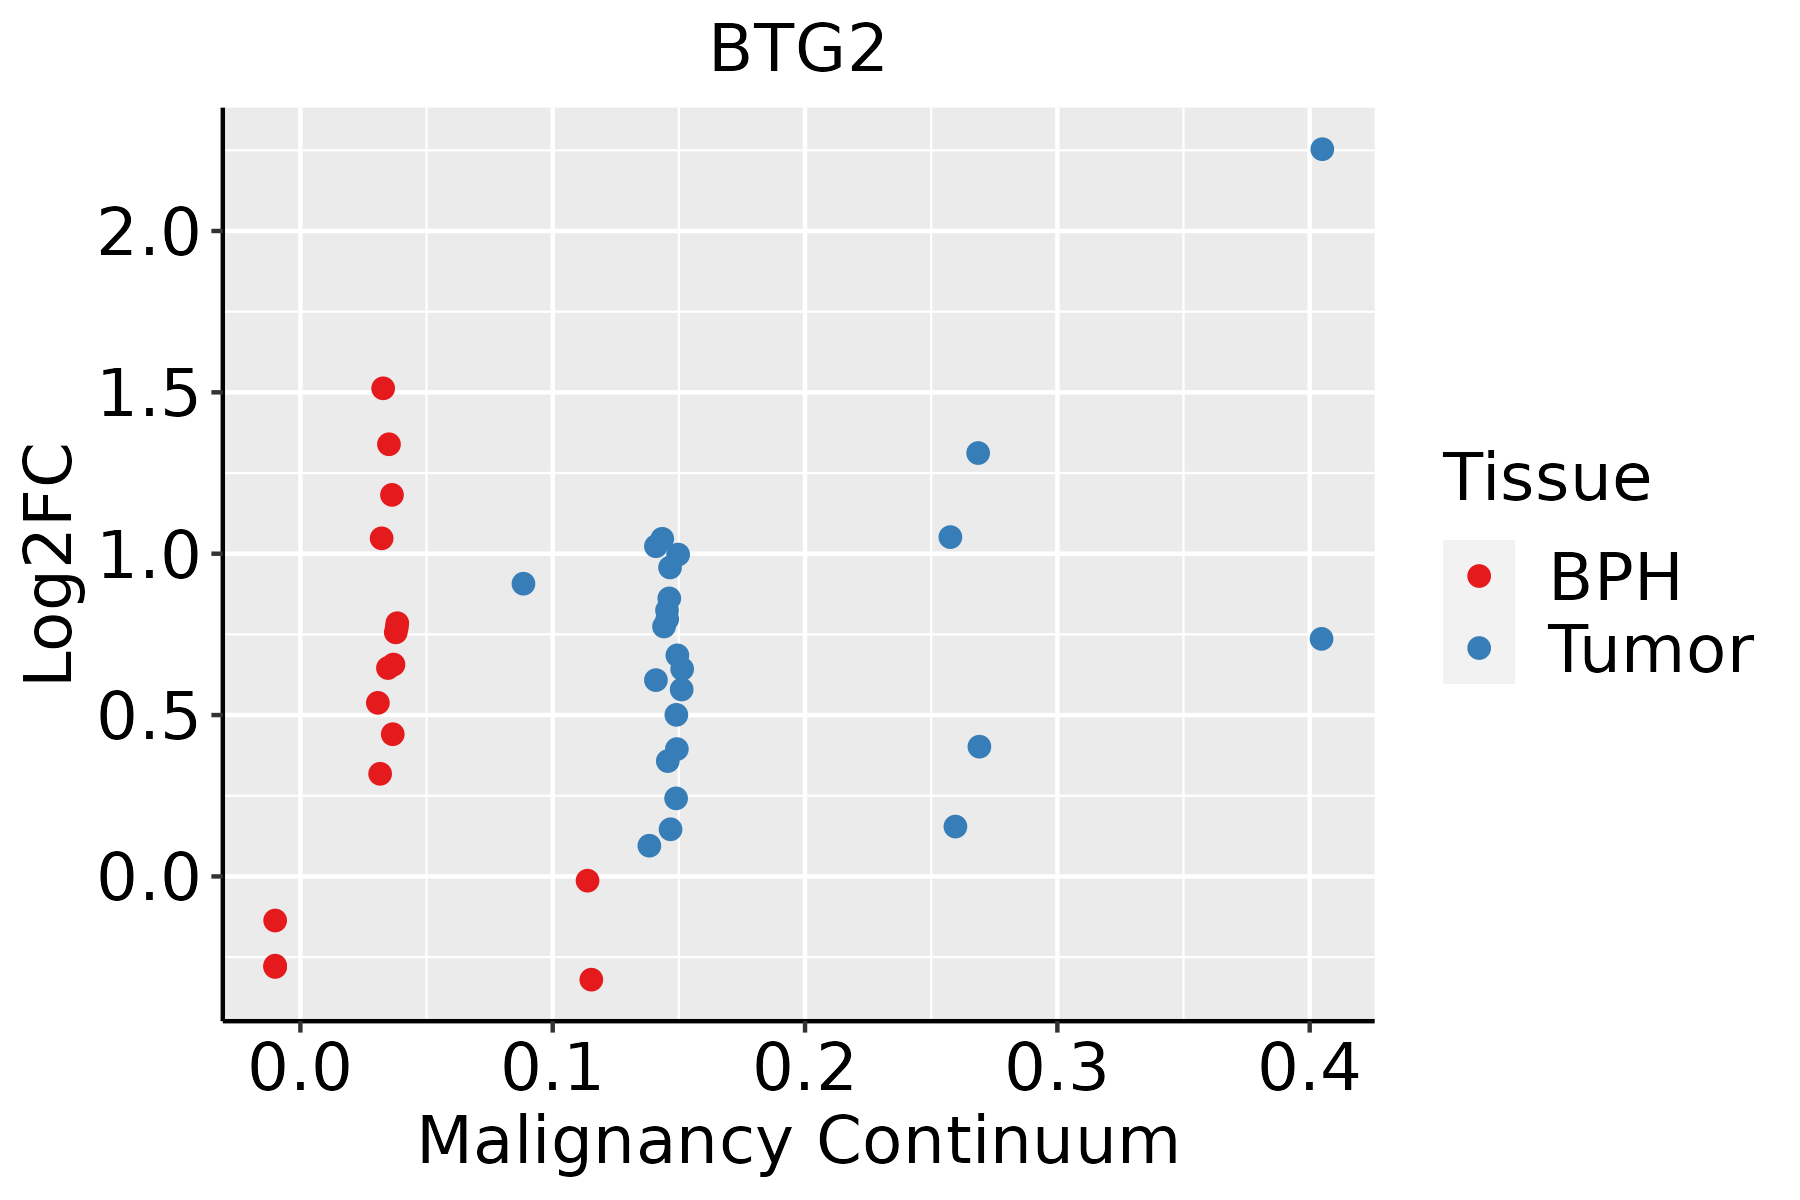 | BPH: Benign Prostatic Hyperplasia |
| Skin | 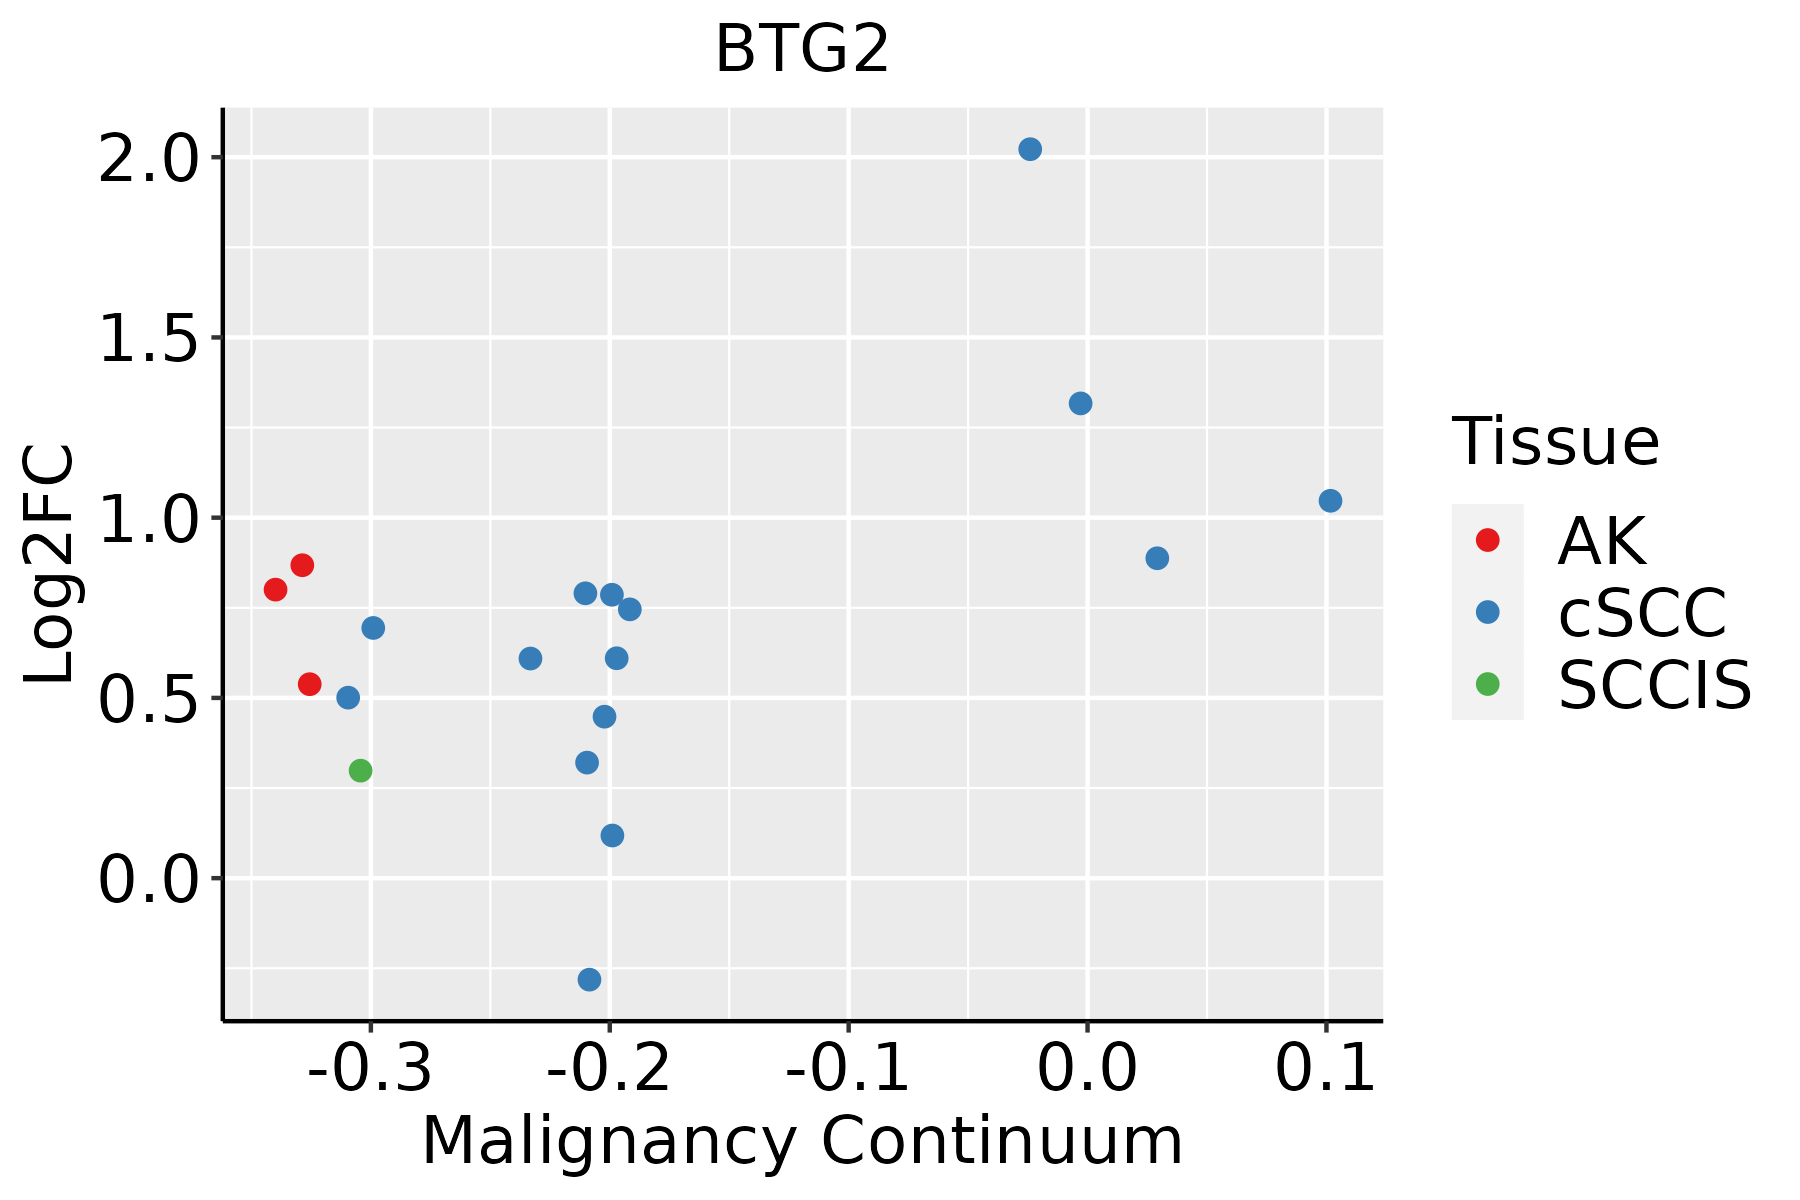 | AK: Actinic keratosis |
| cSCC: Cutaneous squamous cell carcinoma | ||
| SCCIS:squamous cell carcinoma in situ | ||
| Thyroid |  | ATC: Anaplastic thyroid cancer |
| HT: Hashimoto's thyroiditis | ||
| PTC: Papillary thyroid cancer |
| ∗log2FC in expression of this searched gene in stem-like cells from each diseased tissue sample relative to stem-like cells in normal samples in each tissue plotted against the malignancy continuum. Samples are colored based on if they are from different disease stage. |
Top |
Malignant transformation related pathway analysis |
| Find out the enriched GO biological processes and KEGG pathways involved in transition from healthy to precancer to cancer |
| Tissue | Disease Stage | Enriched GO biological Processes |
| Colorectum | AD |  |
| Colorectum | SER |  |
| Colorectum | MSS |  |
| Colorectum | MSI-H |  |
| Colorectum | FAP |  |
| ∗Top 15 enriched GO BP terms are showed in the bar plot of each disease state in each tissue. Each row represents a significant GO biological process which is colored according to the -log10(p.adjust). |
| Page: 1 2 3 4 5 6 7 8 9 |
| GO ID | Tissue | Disease Stage | Description | Gene Ratio | Bg Ratio | pvalue | p.adjust | Count |
| GO:000640125 | Skin | AK | RNA catabolic process | 58/1910 | 278/18723 | 8.82e-08 | 4.08e-06 | 58 |
| GO:004348720 | Skin | AK | regulation of RNA stability | 40/1910 | 170/18723 | 3.43e-07 | 1.33e-05 | 40 |
| GO:190331317 | Skin | AK | positive regulation of mRNA metabolic process | 31/1910 | 118/18723 | 5.59e-07 | 1.99e-05 | 31 |
| GO:00309006 | Skin | AK | forebrain development | 66/1910 | 379/18723 | 1.02e-05 | 2.17e-04 | 66 |
| GO:00064799 | Skin | AK | protein methylation | 38/1910 | 181/18723 | 1.21e-05 | 2.46e-04 | 38 |
| GO:00082139 | Skin | AK | protein alkylation | 38/1910 | 181/18723 | 1.21e-05 | 2.46e-04 | 38 |
| GO:007099728 | Skin | AK | neuron death | 63/1910 | 361/18723 | 1.50e-05 | 2.94e-04 | 63 |
| GO:190121425 | Skin | AK | regulation of neuron death | 57/1910 | 319/18723 | 1.87e-05 | 3.52e-04 | 57 |
| GO:006053710 | Skin | AK | muscle tissue development | 68/1910 | 403/18723 | 2.18e-05 | 4.03e-04 | 68 |
| GO:004343425 | Skin | AK | response to peptide hormone | 69/1910 | 414/18723 | 2.87e-05 | 4.98e-04 | 69 |
| GO:000961217 | Skin | AK | response to mechanical stimulus | 42/1910 | 216/18723 | 3.07e-05 | 5.21e-04 | 42 |
| GO:00457866 | Skin | AK | negative regulation of cell cycle | 63/1910 | 385/18723 | 1.08e-04 | 1.40e-03 | 63 |
| GO:00171487 | Skin | AK | negative regulation of translation | 44/1910 | 245/18723 | 1.42e-04 | 1.71e-03 | 44 |
| GO:00147069 | Skin | AK | striated muscle tissue development | 62/1910 | 384/18723 | 1.79e-04 | 2.06e-03 | 62 |
| GO:00459306 | Skin | AK | negative regulation of mitotic cell cycle | 42/1910 | 235/18723 | 2.21e-04 | 2.46e-03 | 42 |
| GO:006115717 | Skin | AK | mRNA destabilization | 20/1910 | 84/18723 | 2.37e-04 | 2.61e-03 | 20 |
| GO:00342497 | Skin | AK | negative regulation of cellular amide metabolic process | 47/1910 | 273/18723 | 2.39e-04 | 2.62e-03 | 47 |
| GO:003465520 | Skin | AK | nucleobase-containing compound catabolic process | 64/1910 | 407/18723 | 3.01e-04 | 3.12e-03 | 64 |
| GO:000095619 | Skin | AK | nuclear-transcribed mRNA catabolic process | 24/1910 | 112/18723 | 3.34e-04 | 3.39e-03 | 24 |
| GO:006101417 | Skin | AK | positive regulation of mRNA catabolic process | 20/1910 | 87/18723 | 3.90e-04 | 3.74e-03 | 20 |
| Page: 1 2 3 4 5 6 7 8 9 10 11 12 13 14 15 16 17 18 19 20 21 22 23 24 25 26 27 28 29 30 31 32 33 34 35 36 37 38 39 40 41 |
| Pathway ID | Tissue | Disease Stage | Description | Gene Ratio | Bg Ratio | pvalue | p.adjust | qvalue | Count |
| hsa030186 | Breast | Precancer | RNA degradation | 14/684 | 79/8465 | 3.97e-03 | 2.37e-02 | 1.81e-02 | 14 |
| hsa0301811 | Breast | Precancer | RNA degradation | 14/684 | 79/8465 | 3.97e-03 | 2.37e-02 | 1.81e-02 | 14 |
| hsa0301821 | Breast | IDC | RNA degradation | 16/867 | 79/8465 | 5.65e-03 | 3.13e-02 | 2.34e-02 | 16 |
| hsa0301831 | Breast | IDC | RNA degradation | 16/867 | 79/8465 | 5.65e-03 | 3.13e-02 | 2.34e-02 | 16 |
| hsa030184 | Breast | DCIS | RNA degradation | 16/846 | 79/8465 | 4.45e-03 | 2.46e-02 | 1.82e-02 | 16 |
| hsa030185 | Breast | DCIS | RNA degradation | 16/846 | 79/8465 | 4.45e-03 | 2.46e-02 | 1.82e-02 | 16 |
| hsa030187 | Endometrium | EEC | RNA degradation | 20/1237 | 79/8465 | 8.36e-03 | 3.88e-02 | 2.89e-02 | 20 |
| hsa0301812 | Endometrium | EEC | RNA degradation | 20/1237 | 79/8465 | 8.36e-03 | 3.88e-02 | 2.89e-02 | 20 |
| hsa0301824 | Esophagus | ESCC | RNA degradation | 62/4205 | 79/8465 | 1.18e-07 | 9.39e-07 | 4.81e-07 | 62 |
| hsa0301834 | Esophagus | ESCC | RNA degradation | 62/4205 | 79/8465 | 1.18e-07 | 9.39e-07 | 4.81e-07 | 62 |
| hsa03018 | Liver | Cirrhotic | RNA degradation | 44/2530 | 79/8465 | 1.43e-06 | 1.65e-05 | 1.02e-05 | 44 |
| hsa030181 | Liver | Cirrhotic | RNA degradation | 44/2530 | 79/8465 | 1.43e-06 | 1.65e-05 | 1.02e-05 | 44 |
| hsa030182 | Liver | HCC | RNA degradation | 58/4020 | 79/8465 | 2.29e-06 | 2.19e-05 | 1.22e-05 | 58 |
| hsa030183 | Liver | HCC | RNA degradation | 58/4020 | 79/8465 | 2.29e-06 | 2.19e-05 | 1.22e-05 | 58 |
| hsa030189 | Oral cavity | OSCC | RNA degradation | 59/3704 | 79/8465 | 2.05e-08 | 1.91e-07 | 9.70e-08 | 59 |
| hsa0301814 | Oral cavity | OSCC | RNA degradation | 59/3704 | 79/8465 | 2.05e-08 | 1.91e-07 | 9.70e-08 | 59 |
| hsa0301823 | Oral cavity | LP | RNA degradation | 39/2418 | 79/8465 | 6.98e-05 | 4.38e-04 | 2.83e-04 | 39 |
| hsa0301833 | Oral cavity | LP | RNA degradation | 39/2418 | 79/8465 | 6.98e-05 | 4.38e-04 | 2.83e-04 | 39 |
| hsa0301861 | Oral cavity | NEOLP | RNA degradation | 18/1112 | 79/8465 | 1.25e-02 | 4.06e-02 | 2.56e-02 | 18 |
| hsa0301871 | Oral cavity | NEOLP | RNA degradation | 18/1112 | 79/8465 | 1.25e-02 | 4.06e-02 | 2.56e-02 | 18 |
| Page: 1 2 |
Top |
Cell-cell communication analysis |
| Identification of potential cell-cell interactions between two cell types and their ligand-receptor pairs for different disease states |
| Ligand | Receptor | LRpair | Pathway | Tissue | Disease Stage |
| Page: 1 |
Top |
Single-cell gene regulatory network inference analysis |
| Find out the significant the regulons (TFs) and the target genes of each regulon across cell types for different disease states |
| TF | Cell Type | Tissue | Disease Stage | Target Gene | RSS | Regulon Activity |
| ∗The dot plots of a searched regulon are shown for all cell subpopulations in each disease state of each tissue based on the regulon specific score inferred using pySCENIC and by calculating the average expression. |
| Page: 1 |
Top |
Somatic mutation of malignant transformation related genes |
| Annotation of somatic variants for genes involved in malignant transformation |
| Hugo Symbol | Variant Class | Variant Classification | dbSNP RS | HGVSc | HGVSp | HGVSp Short | SWISSPROT | BIOTYPE | SIFT | PolyPhen | Tumor Sample Barcode | Tissue | Histology | Sex | Age | Stage | Therapy Types | Drugs | Outcome |
| BTG2 | SNV | Missense_Mutation | rs752692832 | c.335N>A | p.Arg112His | p.R112H | P78543 | protein_coding | deleterious(0) | probably_damaging(1) | TCGA-AO-A128-01 | Breast | breast invasive carcinoma | Female | <65 | I/II | Chemotherapy | doxorubicin | SD |
| BTG2 | SNV | Missense_Mutation | novel | c.403C>A | p.Leu135Ile | p.L135I | P78543 | protein_coding | tolerated(1) | benign(0.001) | TCGA-2W-A8YY-01 | Cervix | cervical & endocervical cancer | Female | <65 | I/II | Chemotherapy | cisplatin | CR |
| BTG2 | SNV | Missense_Mutation | novel | c.206N>A | p.Arg69His | p.R69H | P78543 | protein_coding | deleterious(0.04) | probably_damaging(1) | TCGA-A5-A0G2-01 | Endometrium | uterine corpus endometrioid carcinoma | Female | <65 | III/IV | Unknown | Unknown | SD |
| BTG2 | SNV | Missense_Mutation | novel | c.450N>T | p.Lys150Asn | p.K150N | P78543 | protein_coding | tolerated(0.05) | benign(0.082) | TCGA-AJ-A5DW-01 | Endometrium | uterine corpus endometrioid carcinoma | Female | <65 | I/II | Unknown | Unknown | SD |
| BTG2 | SNV | Missense_Mutation | rs752692832 | c.335G>A | p.Arg112His | p.R112H | P78543 | protein_coding | deleterious(0) | probably_damaging(1) | TCGA-FI-A2D5-01 | Endometrium | uterine corpus endometrioid carcinoma | Female | <65 | III/IV | Chemotherapy | carboplatinum | PD |
| BTG2 | SNV | Missense_Mutation | c.205N>G | p.Arg69Gly | p.R69G | P78543 | protein_coding | deleterious(0) | probably_damaging(1) | TCGA-49-4488-01 | Lung | lung adenocarcinoma | Female | >=65 | I/II | Unknown | Unknown | PD | |
| BTG2 | SNV | Missense_Mutation | c.196C>G | p.Arg66Gly | p.R66G | P78543 | protein_coding | deleterious(0) | probably_damaging(0.998) | TCGA-86-6562-01 | Lung | lung adenocarcinoma | Male | <65 | I/II | Chemotherapy | vinblastine | PD | |
| BTG2 | SNV | Missense_Mutation | rs757308128 | c.337N>T | p.Ile113Phe | p.I113F | P78543 | protein_coding | deleterious(0.03) | probably_damaging(0.923) | TCGA-MP-A4TK-01 | Lung | lung adenocarcinoma | Female | <65 | I/II | Unknown | Unknown | PD |
| BTG2 | SNV | Missense_Mutation | novel | c.310N>A | p.Val104Met | p.V104M | P78543 | protein_coding | deleterious(0) | probably_damaging(0.998) | TCGA-CN-4730-01 | Oral cavity | head & neck squamous cell carcinoma | Male | <65 | I/II | Unknown | Unknown | SD |
| BTG2 | insertion | Frame_Shift_Ins | novel | c.18_19insCA | p.Thr7GlnfsTer19 | p.T7Qfs*19 | P78543 | protein_coding | TCGA-BA-6873-01 | Oral cavity | head & neck squamous cell carcinoma | Male | <65 | I/II | Chemotherapy | cisplatin | SD |
| Page: 1 |
Top |
Related drugs of malignant transformation related genes |
| Identification of chemicals and drugs interact with genes involved in malignant transfromation |
| (DGIdb 4.0) |
| Entrez ID | Symbol | Category | Interaction Types | Drug Claim Name | Drug Name | PMIDs |
| Page: 1 |

Copyright 2023-Present -The University of Texas Health Science Center at Houston |