| Tissue | Expression Dynamics | Abbreviation |
| Esophagus | 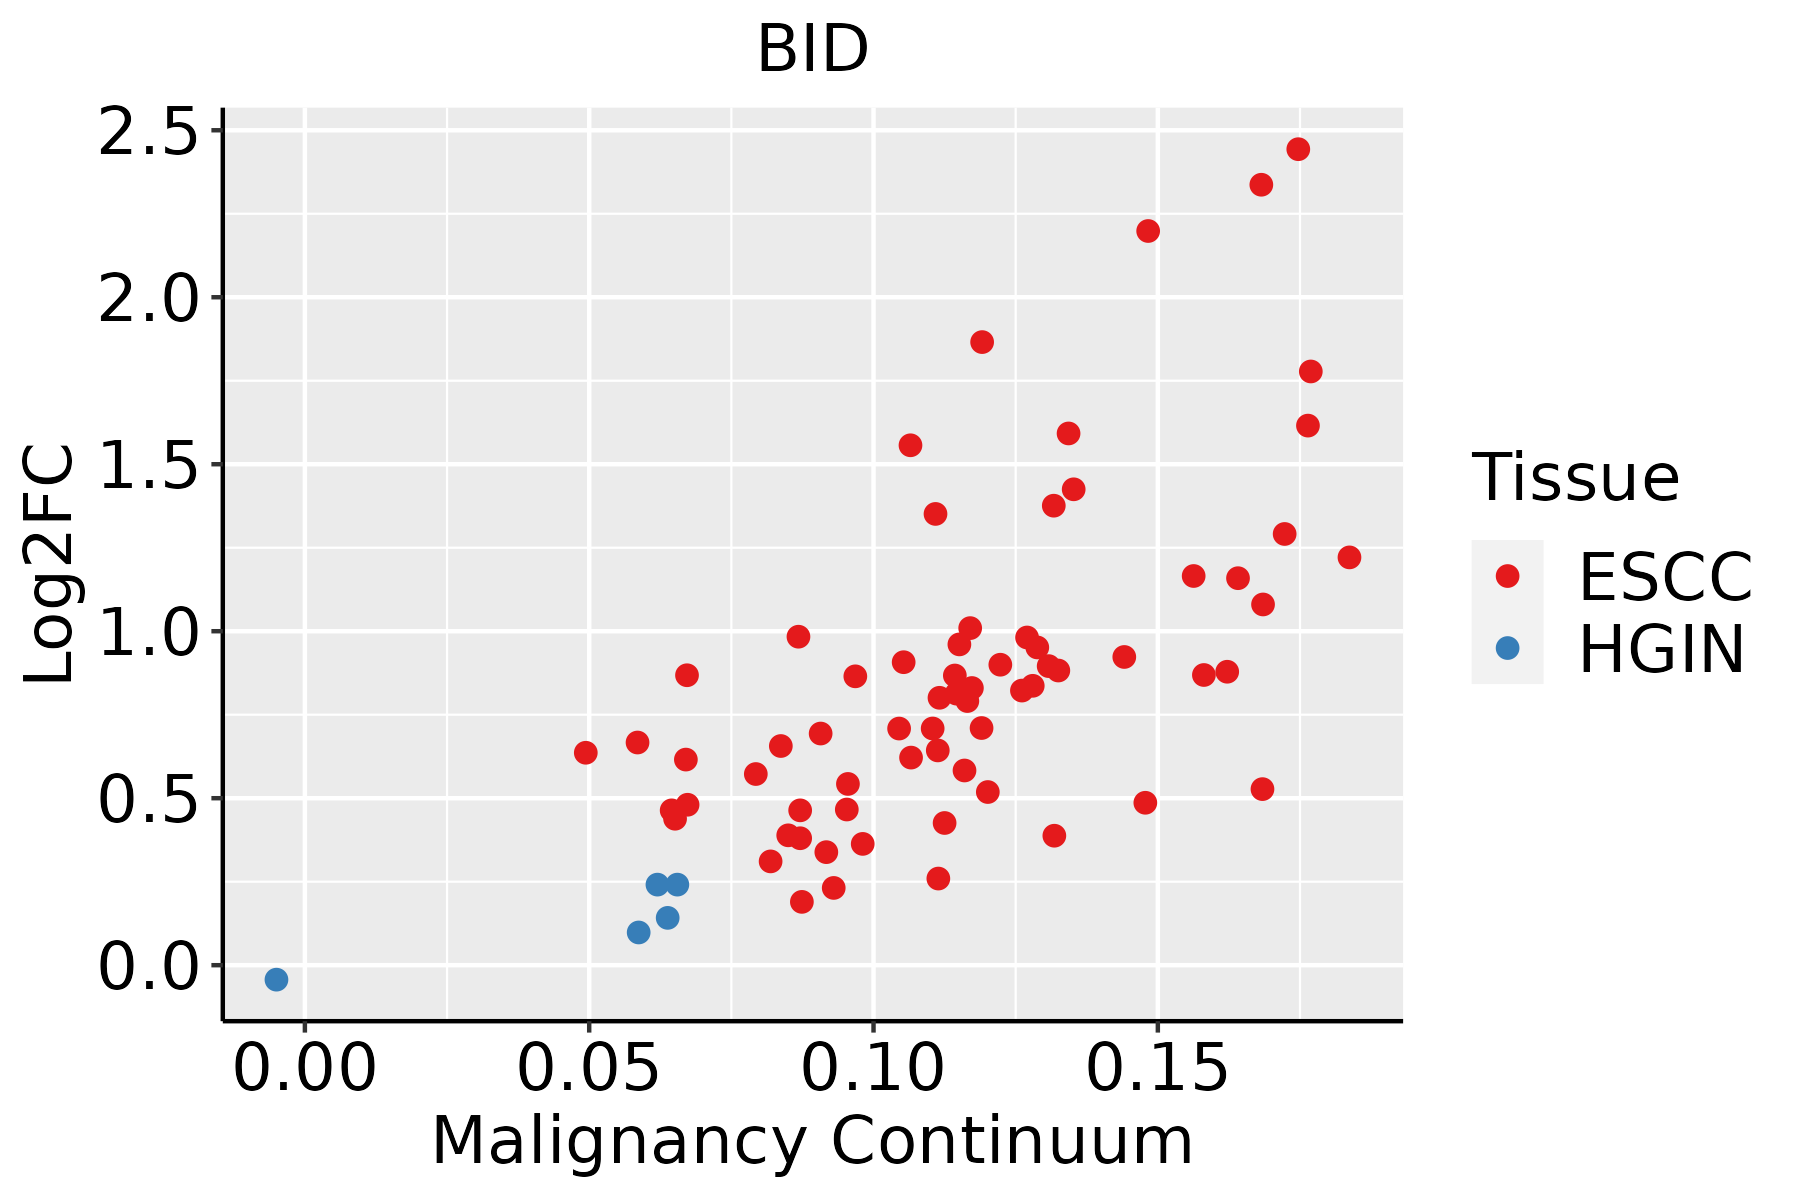 | ESCC: Esophageal squamous cell carcinoma |
| HGIN: High-grade intraepithelial neoplasias |
| LGIN: Low-grade intraepithelial neoplasias |
| Liver |  | HCC: Hepatocellular carcinoma |
| NAFLD: Non-alcoholic fatty liver disease |
| Oral Cavity | 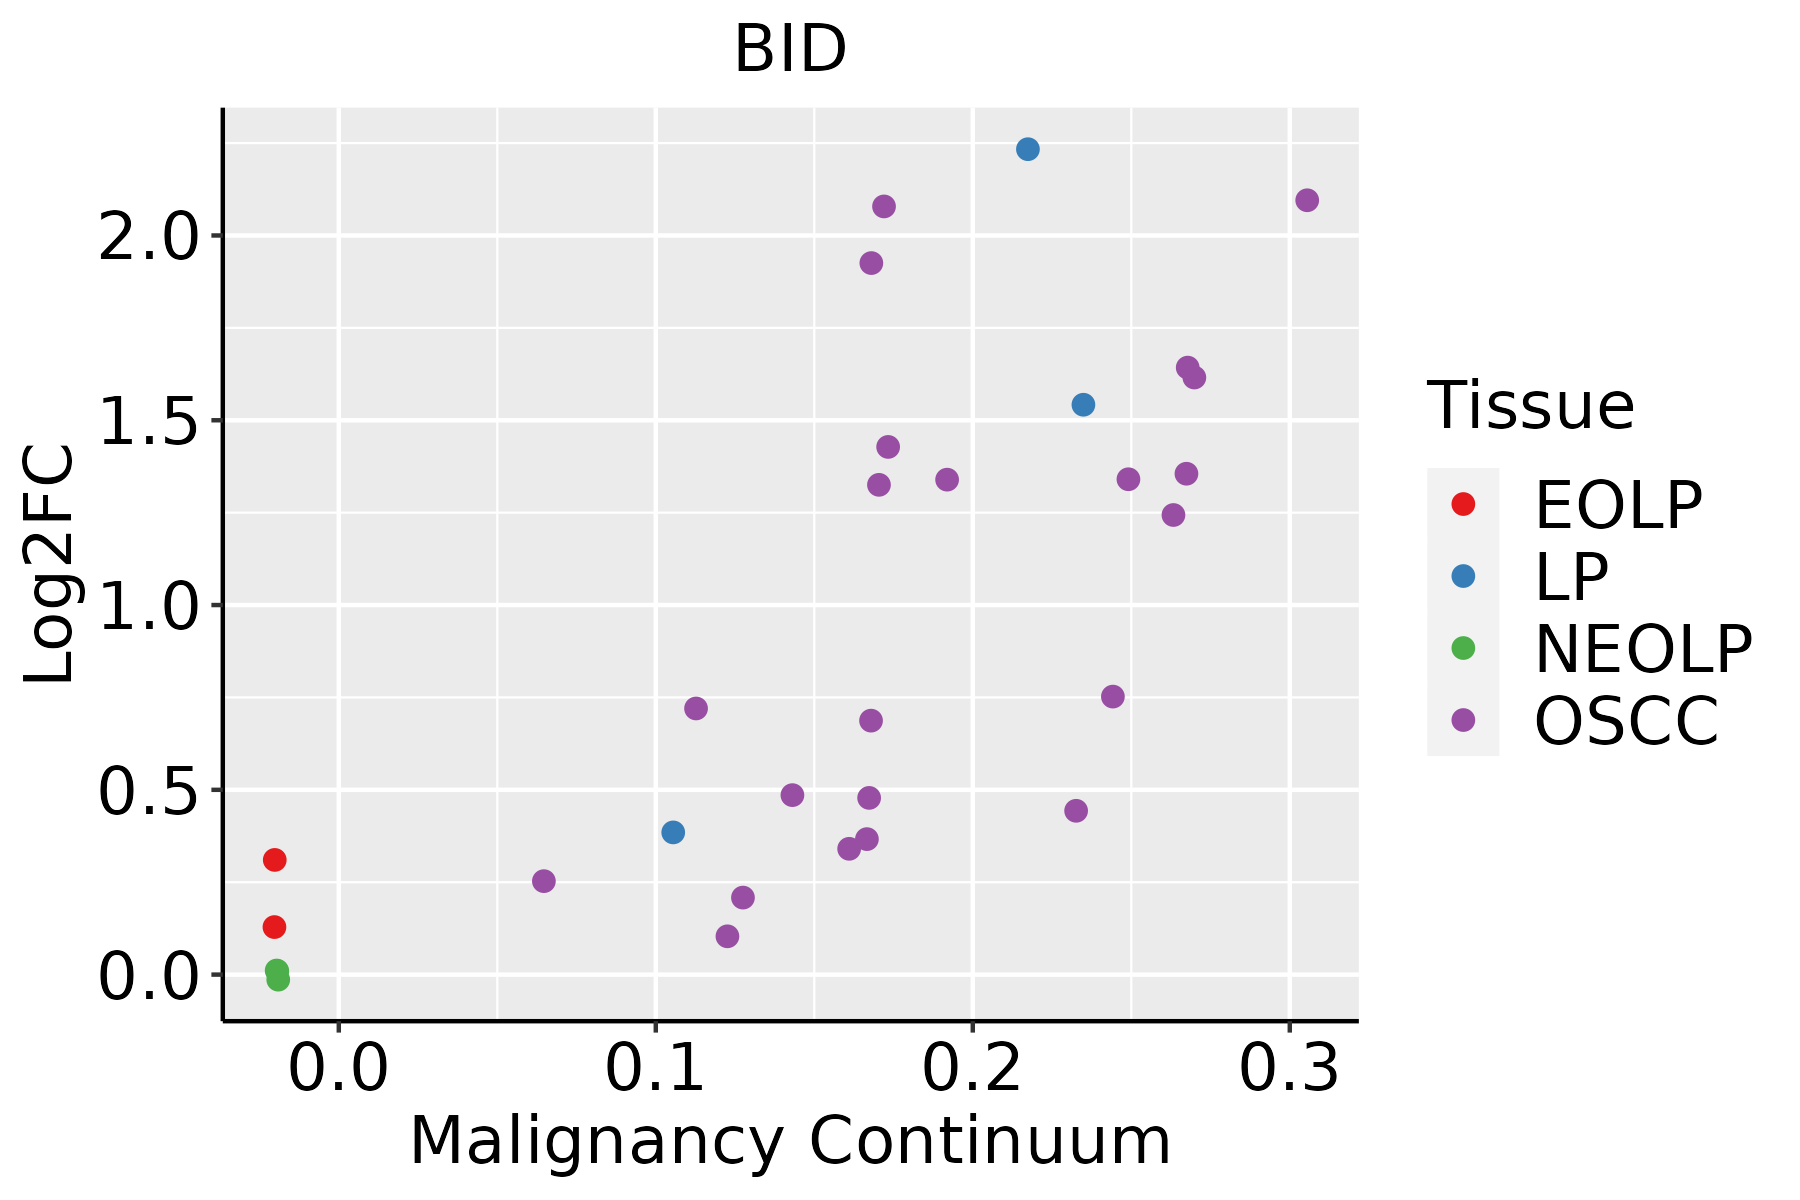 | EOLP: Erosive Oral lichen planus |
| LP: leukoplakia |
| NEOLP: Non-erosive oral lichen planus |
| OSCC: Oral squamous cell carcinoma |
| Thyroid | 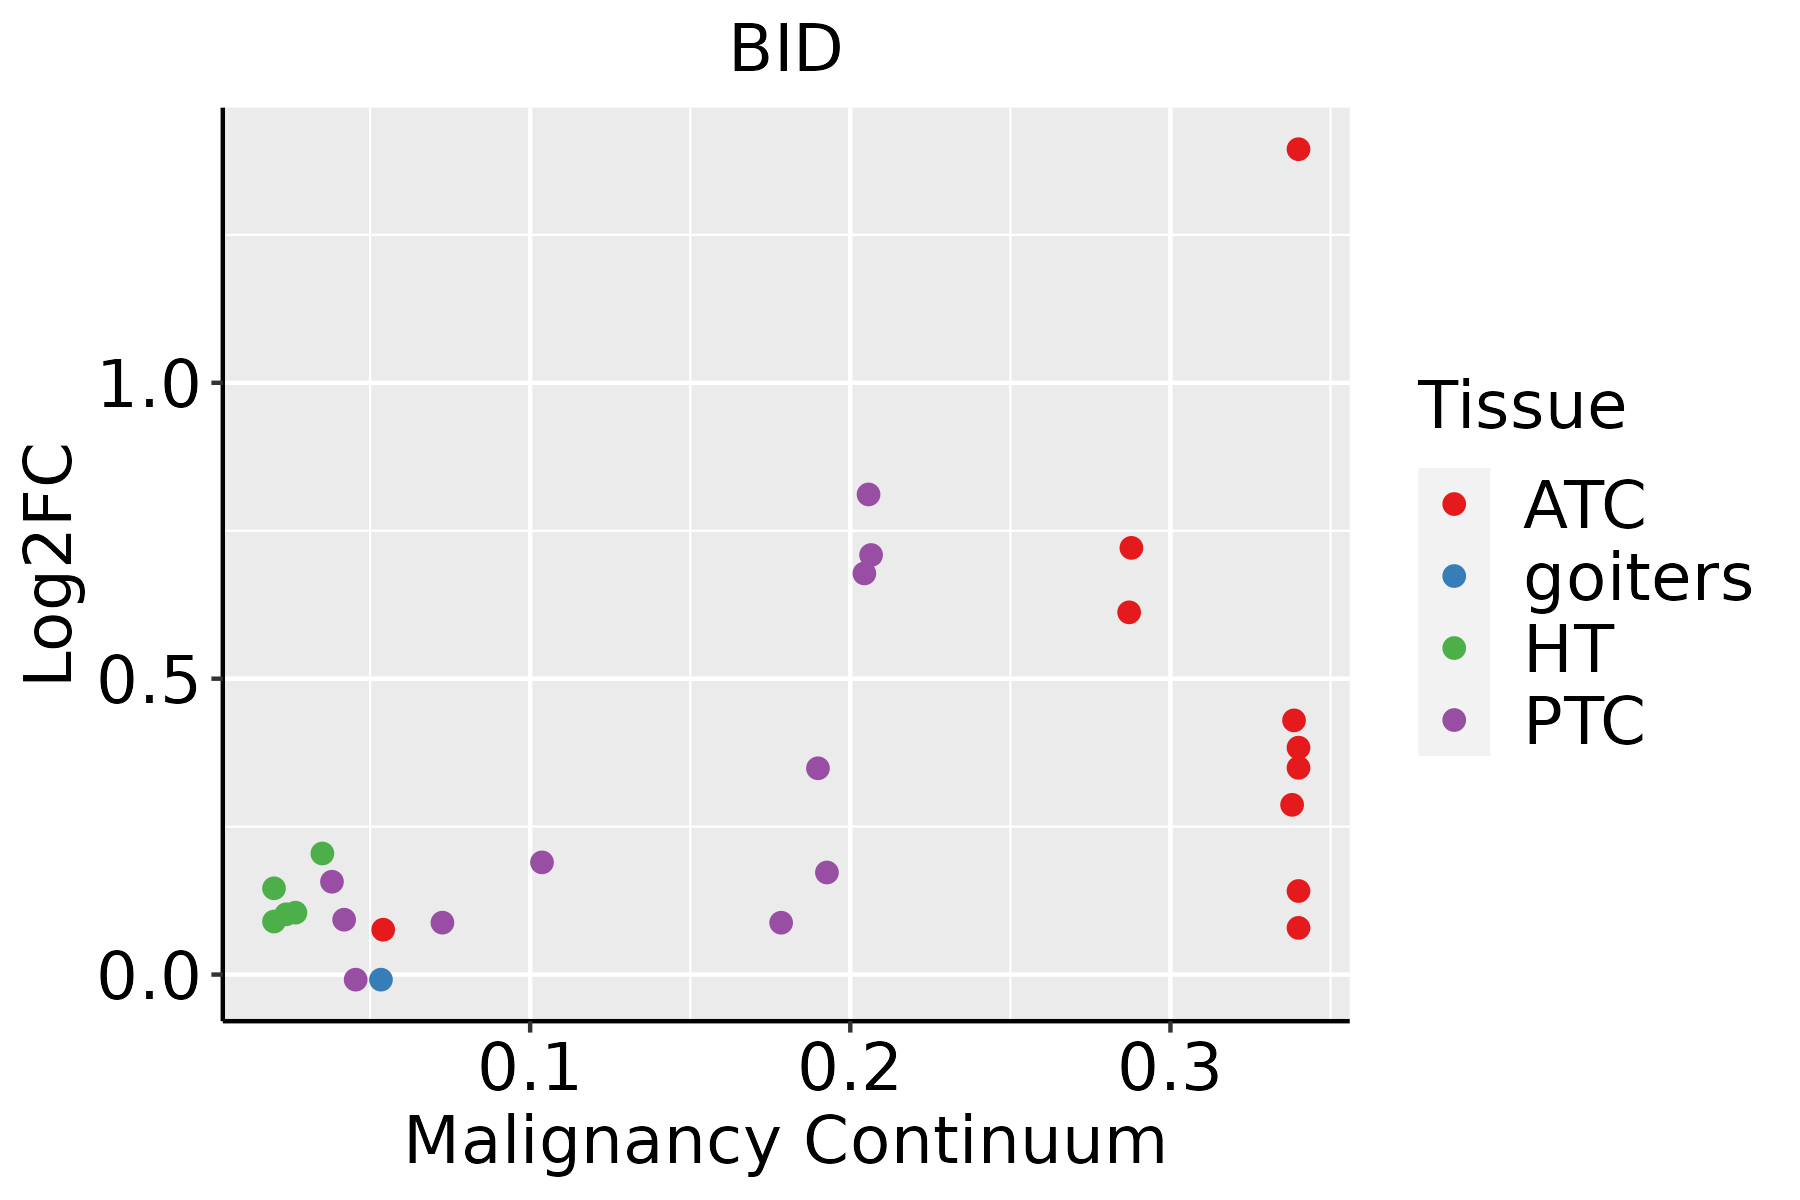 | ATC: Anaplastic thyroid cancer |
| HT: Hashimoto's thyroiditis |
| PTC: Papillary thyroid cancer |
| GO ID | Tissue | Disease Stage | Description | Gene Ratio | Bg Ratio | pvalue | p.adjust | Count |
| GO:000008221 | Oral cavity | EOLP | G1/S transition of mitotic cell cycle | 46/2218 | 214/18723 | 4.02e-05 | 5.51e-04 | 46 |
| GO:002240918 | Oral cavity | EOLP | positive regulation of cell-cell adhesion | 57/2218 | 284/18723 | 4.23e-05 | 5.77e-04 | 57 |
| GO:007058523 | Oral cavity | EOLP | protein localization to mitochondrion | 31/2218 | 125/18723 | 4.36e-05 | 5.88e-04 | 31 |
| GO:00022633 | Oral cavity | EOLP | cell activation involved in immune response | 56/2218 | 279/18723 | 4.91e-05 | 6.47e-04 | 56 |
| GO:001082123 | Oral cavity | EOLP | regulation of mitochondrion organization | 34/2218 | 144/18723 | 5.63e-05 | 7.18e-04 | 34 |
| GO:00023662 | Oral cavity | EOLP | leukocyte activation involved in immune response | 55/2218 | 275/18723 | 6.32e-05 | 7.90e-04 | 55 |
| GO:00022852 | Oral cavity | EOLP | lymphocyte activation involved in immune response | 42/2218 | 194/18723 | 7.17e-05 | 8.82e-04 | 42 |
| GO:000734621 | Oral cavity | EOLP | regulation of mitotic cell cycle | 82/2218 | 457/18723 | 7.50e-05 | 9.14e-04 | 82 |
| GO:0046637 | Oral cavity | EOLP | regulation of alpha-beta T cell differentiation | 20/2218 | 68/18723 | 7.88e-05 | 9.51e-04 | 20 |
| GO:000611925 | Oral cavity | EOLP | oxidative phosphorylation | 33/2218 | 141/18723 | 8.63e-05 | 1.02e-03 | 33 |
| GO:002290425 | Oral cavity | EOLP | respiratory electron transport chain | 28/2218 | 114/18723 | 1.20e-04 | 1.33e-03 | 28 |
| GO:007265523 | Oral cavity | EOLP | establishment of protein localization to mitochondrion | 29/2218 | 120/18723 | 1.24e-04 | 1.37e-03 | 29 |
| GO:000863023 | Oral cavity | EOLP | intrinsic apoptotic signaling pathway in response to DNA damage | 25/2218 | 99/18723 | 1.70e-04 | 1.78e-03 | 25 |
| GO:000698422 | Oral cavity | EOLP | ER-nucleus signaling pathway | 15/2218 | 46/18723 | 1.71e-04 | 1.78e-03 | 15 |
| GO:0043370 | Oral cavity | EOLP | regulation of CD4-positive, alpha-beta T cell differentiation | 16/2218 | 51/18723 | 1.75e-04 | 1.80e-03 | 16 |
| GO:00455803 | Oral cavity | EOLP | regulation of T cell differentiation | 33/2218 | 146/18723 | 1.75e-04 | 1.81e-03 | 33 |
| GO:000906025 | Oral cavity | EOLP | aerobic respiration | 40/2218 | 189/18723 | 1.76e-04 | 1.81e-03 | 40 |
| GO:00508514 | Oral cavity | EOLP | antigen receptor-mediated signaling pathway | 48/2218 | 240/18723 | 1.79e-04 | 1.84e-03 | 48 |
| GO:190210713 | Oral cavity | EOLP | positive regulation of leukocyte differentiation | 34/2218 | 157/18723 | 3.32e-04 | 3.08e-03 | 34 |
| GO:190370813 | Oral cavity | EOLP | positive regulation of hemopoiesis | 34/2218 | 157/18723 | 3.32e-04 | 3.08e-03 | 34 |
| Pathway ID | Tissue | Disease Stage | Description | Gene Ratio | Bg Ratio | pvalue | p.adjust | qvalue | Count |
| hsa0501430 | Esophagus | HGIN | Amyotrophic lateral sclerosis | 140/1383 | 364/8465 | 2.13e-25 | 1.16e-23 | 9.19e-24 | 140 |
| hsa0502230 | Esophagus | HGIN | Pathways of neurodegeneration - multiple diseases | 153/1383 | 476/8465 | 1.22e-18 | 4.41e-17 | 3.50e-17 | 153 |
| hsa0501030 | Esophagus | HGIN | Alzheimer disease | 130/1383 | 384/8465 | 5.26e-18 | 1.71e-16 | 1.36e-16 | 130 |
| hsa0493230 | Esophagus | HGIN | Non-alcoholic fatty liver disease | 66/1383 | 155/8465 | 5.21e-15 | 1.21e-13 | 9.64e-14 | 66 |
| hsa0516930 | Esophagus | HGIN | Epstein-Barr virus infection | 55/1383 | 202/8465 | 5.13e-05 | 6.19e-04 | 4.92e-04 | 55 |
| hsa0516730 | Esophagus | HGIN | Kaposi sarcoma-associated herpesvirus infection | 51/1383 | 194/8465 | 2.46e-04 | 2.69e-03 | 2.14e-03 | 51 |
| hsa0421020 | Esophagus | HGIN | Apoptosis | 36/1383 | 136/8465 | 1.67e-03 | 1.52e-02 | 1.20e-02 | 36 |
| hsa0517029 | Esophagus | HGIN | Human immunodeficiency virus 1 infection | 51/1383 | 212/8465 | 2.16e-03 | 1.90e-02 | 1.51e-02 | 51 |
| hsa0541739 | Esophagus | HGIN | Lipid and atherosclerosis | 51/1383 | 215/8465 | 2.95e-03 | 2.41e-02 | 1.91e-02 | 51 |
| hsa0516420 | Esophagus | HGIN | Influenza A | 42/1383 | 171/8465 | 3.41e-03 | 2.54e-02 | 2.02e-02 | 42 |
| hsa0411510 | Esophagus | HGIN | p53 signaling pathway | 21/1383 | 74/8465 | 6.25e-03 | 4.25e-02 | 3.37e-02 | 21 |
| hsa0516330 | Esophagus | HGIN | Human cytomegalovirus infection | 51/1383 | 225/8465 | 7.67e-03 | 4.63e-02 | 3.68e-02 | 51 |
| hsa05014113 | Esophagus | HGIN | Amyotrophic lateral sclerosis | 140/1383 | 364/8465 | 2.13e-25 | 1.16e-23 | 9.19e-24 | 140 |
| hsa05022113 | Esophagus | HGIN | Pathways of neurodegeneration - multiple diseases | 153/1383 | 476/8465 | 1.22e-18 | 4.41e-17 | 3.50e-17 | 153 |
| hsa05010113 | Esophagus | HGIN | Alzheimer disease | 130/1383 | 384/8465 | 5.26e-18 | 1.71e-16 | 1.36e-16 | 130 |
| hsa04932113 | Esophagus | HGIN | Non-alcoholic fatty liver disease | 66/1383 | 155/8465 | 5.21e-15 | 1.21e-13 | 9.64e-14 | 66 |
| hsa05169114 | Esophagus | HGIN | Epstein-Barr virus infection | 55/1383 | 202/8465 | 5.13e-05 | 6.19e-04 | 4.92e-04 | 55 |
| hsa05167114 | Esophagus | HGIN | Kaposi sarcoma-associated herpesvirus infection | 51/1383 | 194/8465 | 2.46e-04 | 2.69e-03 | 2.14e-03 | 51 |
| hsa04210110 | Esophagus | HGIN | Apoptosis | 36/1383 | 136/8465 | 1.67e-03 | 1.52e-02 | 1.20e-02 | 36 |
| hsa05170112 | Esophagus | HGIN | Human immunodeficiency virus 1 infection | 51/1383 | 212/8465 | 2.16e-03 | 1.90e-02 | 1.51e-02 | 51 |
| Hugo Symbol | Variant Class | Variant Classification | dbSNP RS | HGVSc | HGVSp | HGVSp Short | SWISSPROT | BIOTYPE | SIFT | PolyPhen | Tumor Sample Barcode | Tissue | Histology | Sex | Age | Stage | Therapy Types | Drugs | Outcome |
| BID | SNV | Missense_Mutation | | c.710N>A | p.Arg237Lys | p.R237K | P55957 | protein_coding | deleterious(0.01) | benign(0.368) | TCGA-A2-A0CX-01 | Breast | breast invasive carcinoma | Female | <65 | I/II | Chemotherapy | adriamycin | SD |
| BID | SNV | Missense_Mutation | | c.641N>A | p.Arg214His | p.R214H | P55957 | protein_coding | tolerated(0.26) | benign(0.141) | TCGA-AO-A124-01 | Breast | breast invasive carcinoma | Female | <65 | I/II | Chemotherapy | doxorubicin | SD |
| BID | SNV | Missense_Mutation | | c.178N>A | p.Glu60Lys | p.E60K | P55957 | protein_coding | deleterious(0) | probably_damaging(0.931) | TCGA-BH-A18G-01 | Breast | breast invasive carcinoma | Female | >=65 | I/II | Unknown | Unknown | SD |
| BID | insertion | Frame_Shift_Ins | novel | c.385_386insGAATCGGATTAAGGACATCA | p.Ile129ArgfsTer31 | p.I129Rfs*31 | P55957 | protein_coding | | | TCGA-AR-A1AQ-01 | Breast | breast invasive carcinoma | Female | <65 | I/II | Chemotherapy | doxorubicin | SD |
| BID | deletion | In_Frame_Del | rs759487323 | c.608_619delAGAAGGTGGCCA | p.Lys203_Ala206del | p.K203_A206del | P55957 | protein_coding | | | TCGA-B6-A0X1-01 | Breast | breast invasive carcinoma | Female | <65 | I/II | Unknown | Unknown | PD |
| BID | SNV | Missense_Mutation | | c.146N>A | p.Cys49Tyr | p.C49Y | P55957 | protein_coding | deleterious(0.03) | benign(0.001) | TCGA-AA-3492-01 | Colorectum | colon adenocarcinoma | Female | >=65 | I/II | Unknown | Unknown | SD |
| BID | SNV | Missense_Mutation | rs747016844 | c.265G>A | p.Glu89Lys | p.E89K | P55957 | protein_coding | tolerated(0.09) | benign(0.134) | TCGA-EI-6917-01 | Colorectum | rectum adenocarcinoma | Male | <65 | III/IV | Chemotherapy | 5fluorouracil+oxaciplatina+l-folinian | SD |
| BID | SNV | Missense_Mutation | rs547322681 | c.626C>T | p.Thr209Met | p.T209M | P55957 | protein_coding | tolerated(0.35) | benign(0.23) | TCGA-A5-A0G2-01 | Endometrium | uterine corpus endometrioid carcinoma | Female | <65 | III/IV | Unknown | Unknown | SD |
| BID | SNV | Missense_Mutation | novel | c.350G>T | p.Arg117Ile | p.R117I | P55957 | protein_coding | tolerated(0.12) | benign(0.26) | TCGA-AP-A059-01 | Endometrium | uterine corpus endometrioid carcinoma | Female | >=65 | I/II | Unknown | Unknown | SD |
| BID | SNV | Missense_Mutation | rs575351241 | c.446N>T | p.Pro149Leu | p.P149L | P55957 | protein_coding | tolerated(0.17) | benign(0.068) | TCGA-AP-A1DK-01 | Endometrium | uterine corpus endometrioid carcinoma | Female | <65 | I/II | Unknown | Unknown | SD |


