
|
|||||
|
 | |
| |
| |
| |
| |
| |
|
Gene: AREG |
Gene summary for AREG |
| Gene information | Species | Human | Gene symbol | AREG | Gene ID | 374 |
| Gene name | amphiregulin | |
| Gene Alias | AR | |
| Cytomap | 4q13.3 | |
| Gene Type | protein-coding | GO ID | GO:0000003 | UniProtAcc | P15514 |
Top |
Malignant transformation analysis |
| Identification of the aberrant gene expression in precancerous and cancerous lesions by comparing the gene expression of stem-like cells in diseased tissues with normal stem cells |
| Entrez ID | Symbol | Replicates | Species | Organ | Tissue | Adj P-value | Log2FC | Malignancy |
| 374 | AREG | GSM4909281 | Human | Breast | IDC | 4.37e-32 | -9.23e-01 | 0.21 |
| 374 | AREG | GSM4909282 | Human | Breast | IDC | 3.23e-15 | -6.25e-01 | -0.0288 |
| 374 | AREG | GSM4909285 | Human | Breast | IDC | 2.25e-23 | -7.41e-01 | 0.21 |
| 374 | AREG | GSM4909286 | Human | Breast | IDC | 8.45e-21 | -5.77e-01 | 0.1081 |
| 374 | AREG | GSM4909287 | Human | Breast | IDC | 1.21e-17 | -7.83e-01 | 0.2057 |
| 374 | AREG | GSM4909288 | Human | Breast | IDC | 1.09e-02 | -7.10e-01 | 0.0988 |
| 374 | AREG | GSM4909290 | Human | Breast | IDC | 4.28e-25 | -9.63e-01 | 0.2096 |
| 374 | AREG | GSM4909291 | Human | Breast | IDC | 5.64e-17 | -9.13e-01 | 0.1753 |
| 374 | AREG | GSM4909293 | Human | Breast | IDC | 1.87e-20 | -7.73e-01 | 0.1581 |
| 374 | AREG | GSM4909294 | Human | Breast | IDC | 1.05e-32 | -9.14e-01 | 0.2022 |
| 374 | AREG | GSM4909295 | Human | Breast | IDC | 7.63e-05 | -6.76e-01 | 0.0898 |
| 374 | AREG | GSM4909296 | Human | Breast | IDC | 3.91e-27 | -8.34e-01 | 0.1524 |
| 374 | AREG | GSM4909297 | Human | Breast | IDC | 1.88e-07 | 3.19e-01 | 0.1517 |
| 374 | AREG | GSM4909298 | Human | Breast | IDC | 3.15e-20 | -7.28e-01 | 0.1551 |
| 374 | AREG | GSM4909299 | Human | Breast | IDC | 3.15e-06 | -4.39e-01 | 0.035 |
| 374 | AREG | GSM4909301 | Human | Breast | IDC | 4.83e-22 | -8.15e-01 | 0.1577 |
| 374 | AREG | GSM4909302 | Human | Breast | IDC | 6.65e-18 | -7.88e-01 | 0.1545 |
| 374 | AREG | GSM4909304 | Human | Breast | IDC | 5.32e-12 | -5.04e-01 | 0.1636 |
| 374 | AREG | GSM4909305 | Human | Breast | IDC | 1.49e-04 | -2.58e-01 | 0.0436 |
| 374 | AREG | GSM4909306 | Human | Breast | IDC | 8.55e-10 | -5.75e-01 | 0.1564 |
| Page: 1 2 3 4 5 6 7 8 9 10 11 |
| Tissue | Expression Dynamics | Abbreviation |
| Breast |  | IDC: Invasive ductal carcinoma |
| DCIS: Ductal carcinoma in situ | ||
| Precancer(BRCA1-mut): Precancerous lesion from BRCA1 mutation carriers | ||
| Cervix |  | CC: Cervix cancer |
| HSIL_HPV: HPV-infected high-grade squamous intraepithelial lesions | ||
| N_HPV: HPV-infected normal cervix | ||
| Colorectum (GSE201348) |  | FAP: Familial adenomatous polyposis |
| CRC: Colorectal cancer | ||
| Colorectum (HTA11) |  | AD: Adenomas |
| SER: Sessile serrated lesions | ||
| MSI-H: Microsatellite-high colorectal cancer | ||
| MSS: Microsatellite stable colorectal cancer | ||
| Esophagus |  | ESCC: Esophageal squamous cell carcinoma |
| HGIN: High-grade intraepithelial neoplasias | ||
| LGIN: Low-grade intraepithelial neoplasias | ||
| GC | 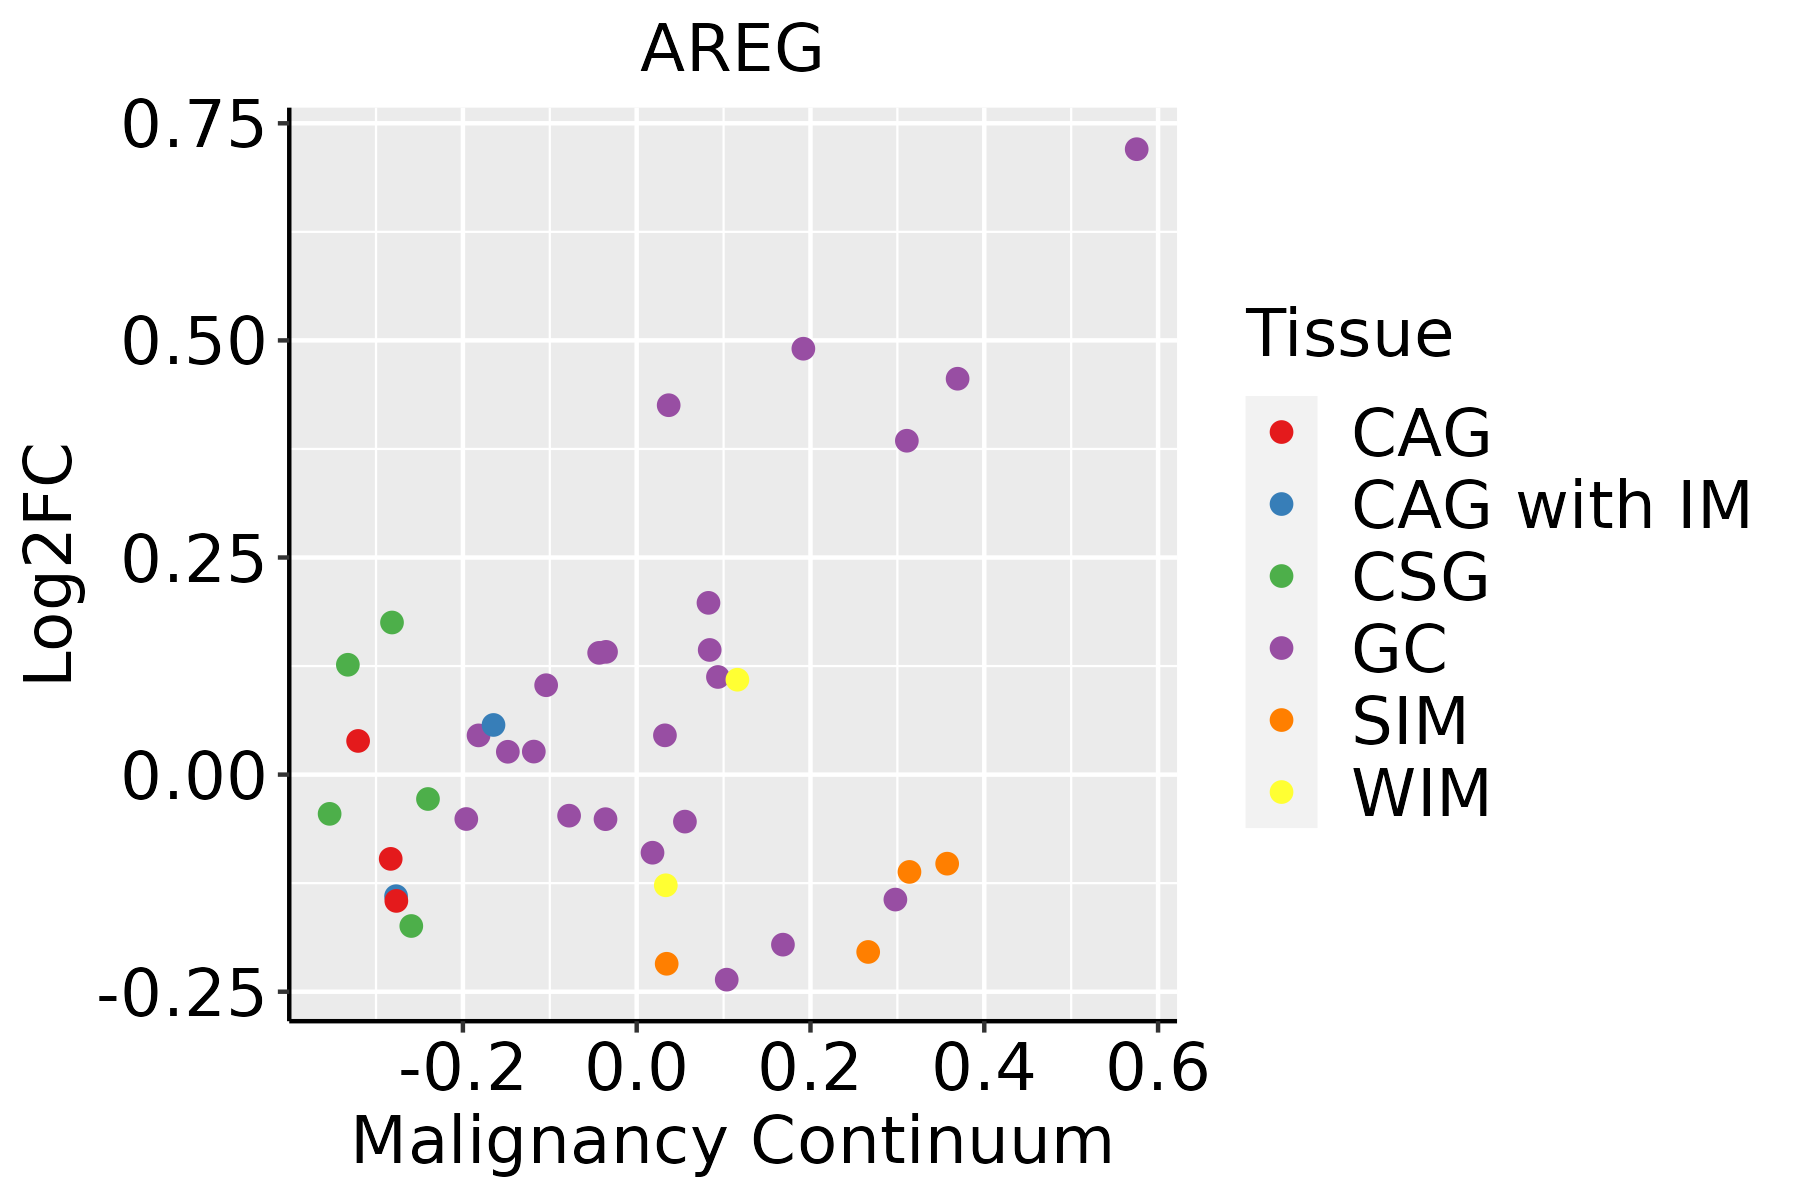 | CAG: Chronic atrophic gastritis |
| CAG with IM: Chronic atrophic gastritis with intestinal metaplasia | ||
| CSG: Chronic superficial gastritis | ||
| GC: Gastric cancer | ||
| SIM: Severe intestinal metaplasia | ||
| WIM: Wild intestinal metaplasia | ||
| Liver | 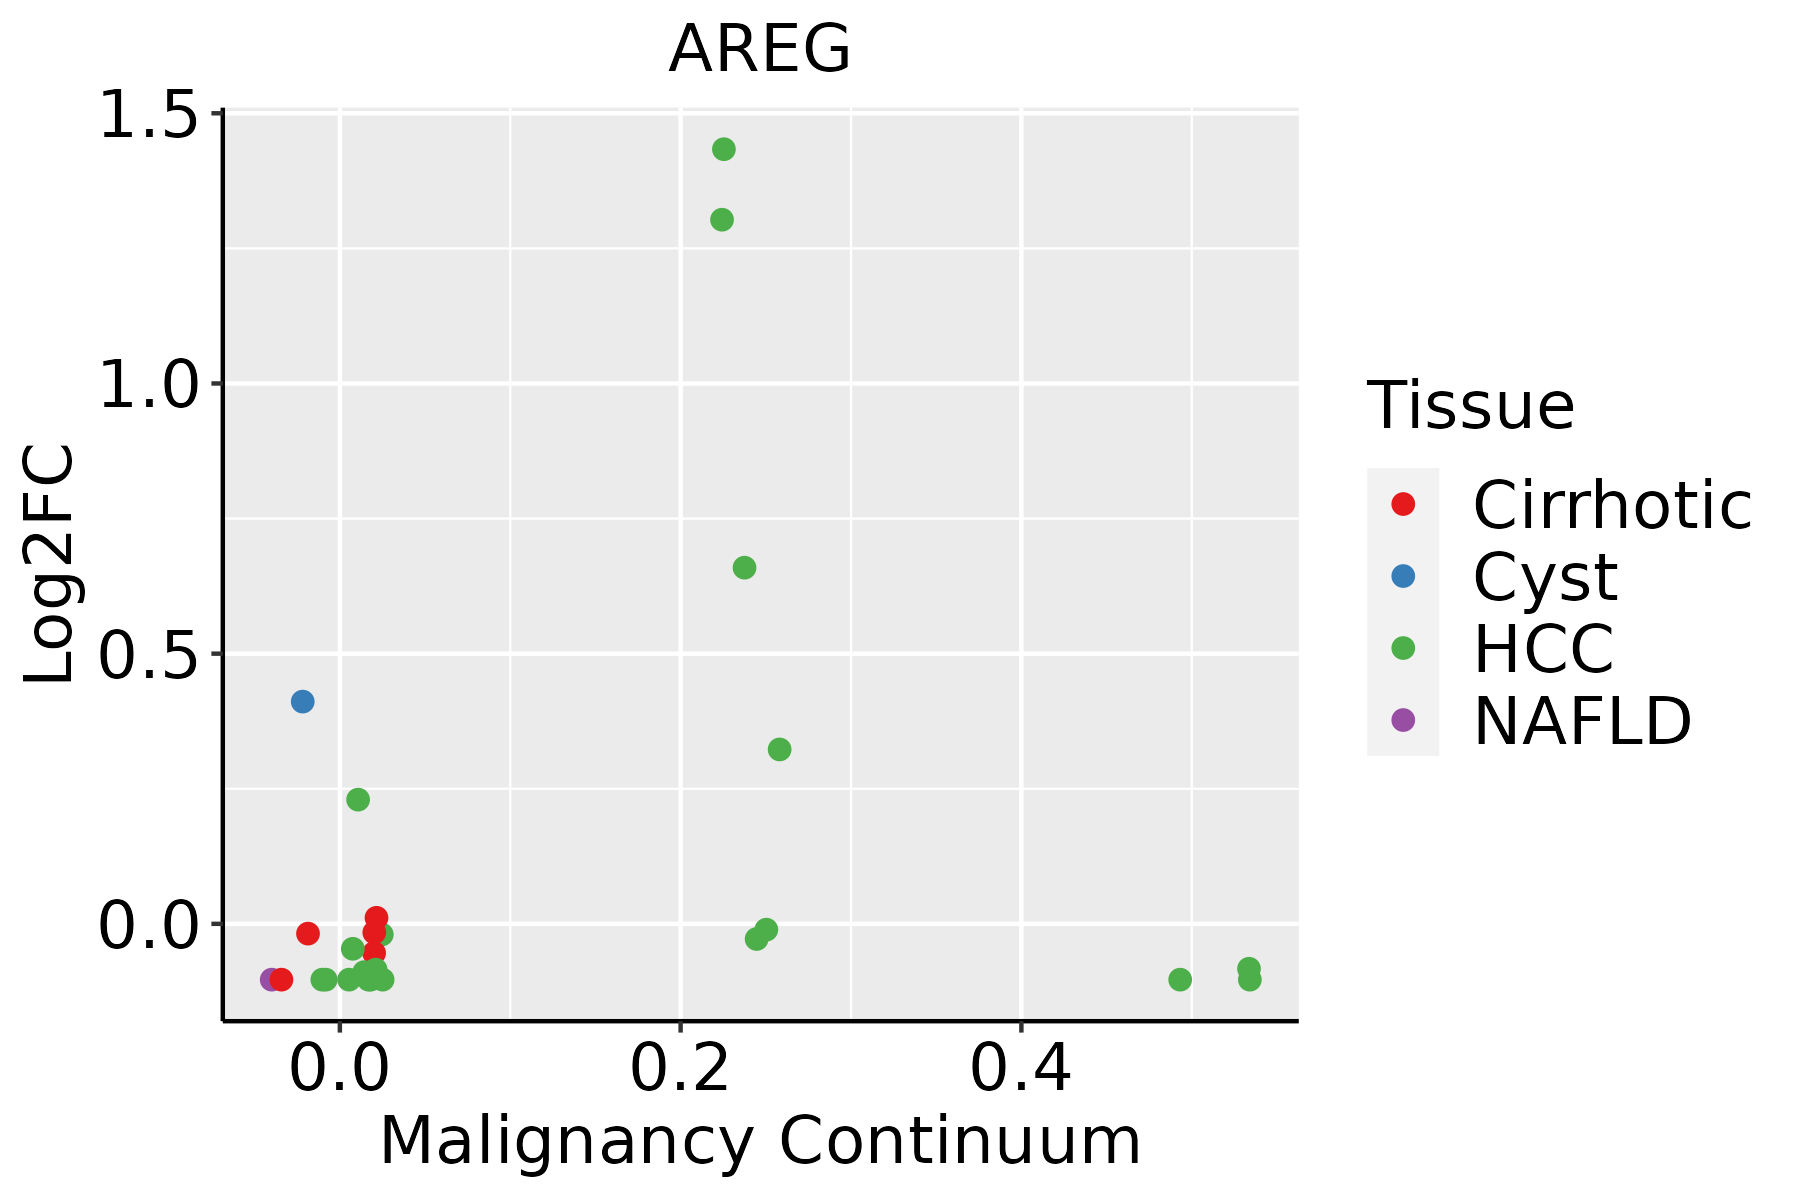 | HCC: Hepatocellular carcinoma |
| NAFLD: Non-alcoholic fatty liver disease | ||
| Lung |  | AAH: Atypical adenomatous hyperplasia |
| AIS: Adenocarcinoma in situ | ||
| IAC: Invasive lung adenocarcinoma | ||
| MIA: Minimally invasive adenocarcinoma | ||
| Oral Cavity | 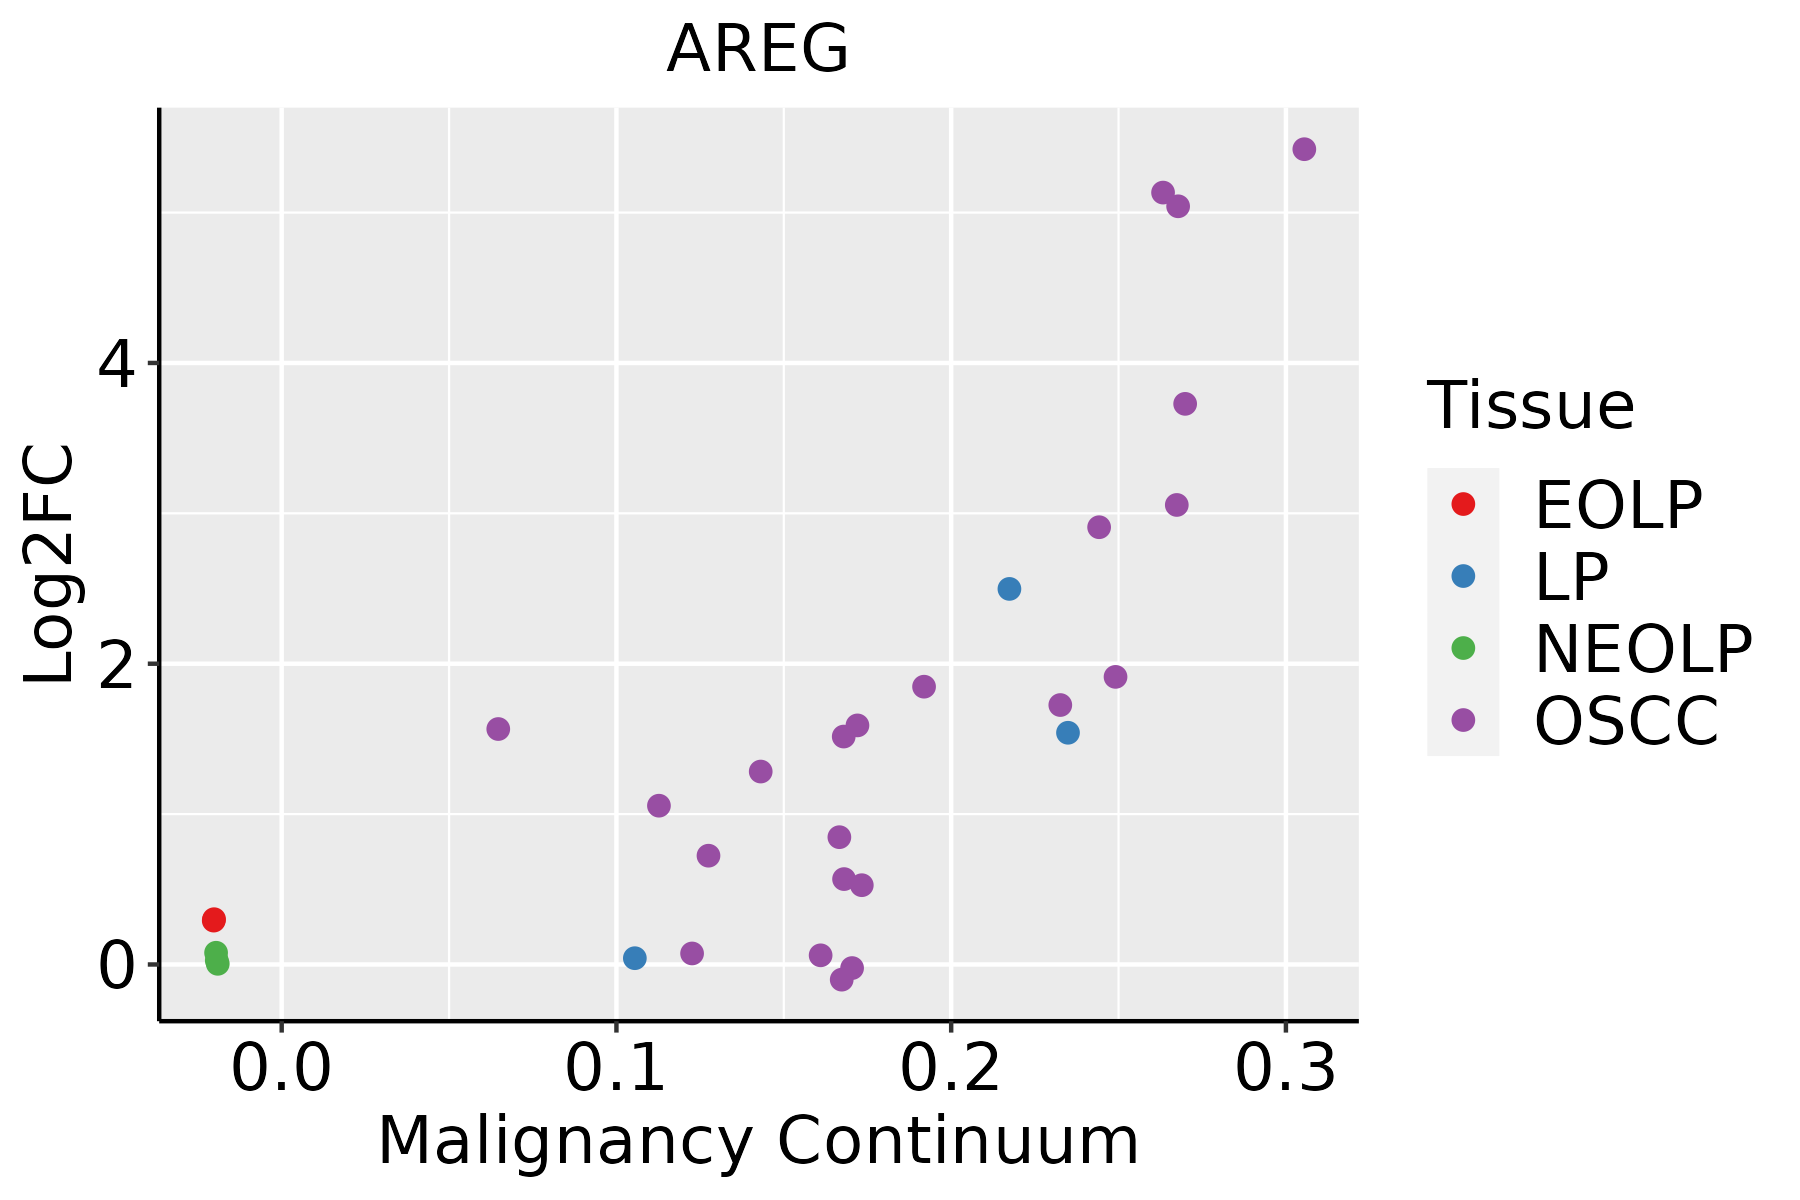 | EOLP: Erosive Oral lichen planus |
| LP: leukoplakia | ||
| NEOLP: Non-erosive oral lichen planus | ||
| OSCC: Oral squamous cell carcinoma | ||
| Prostate | 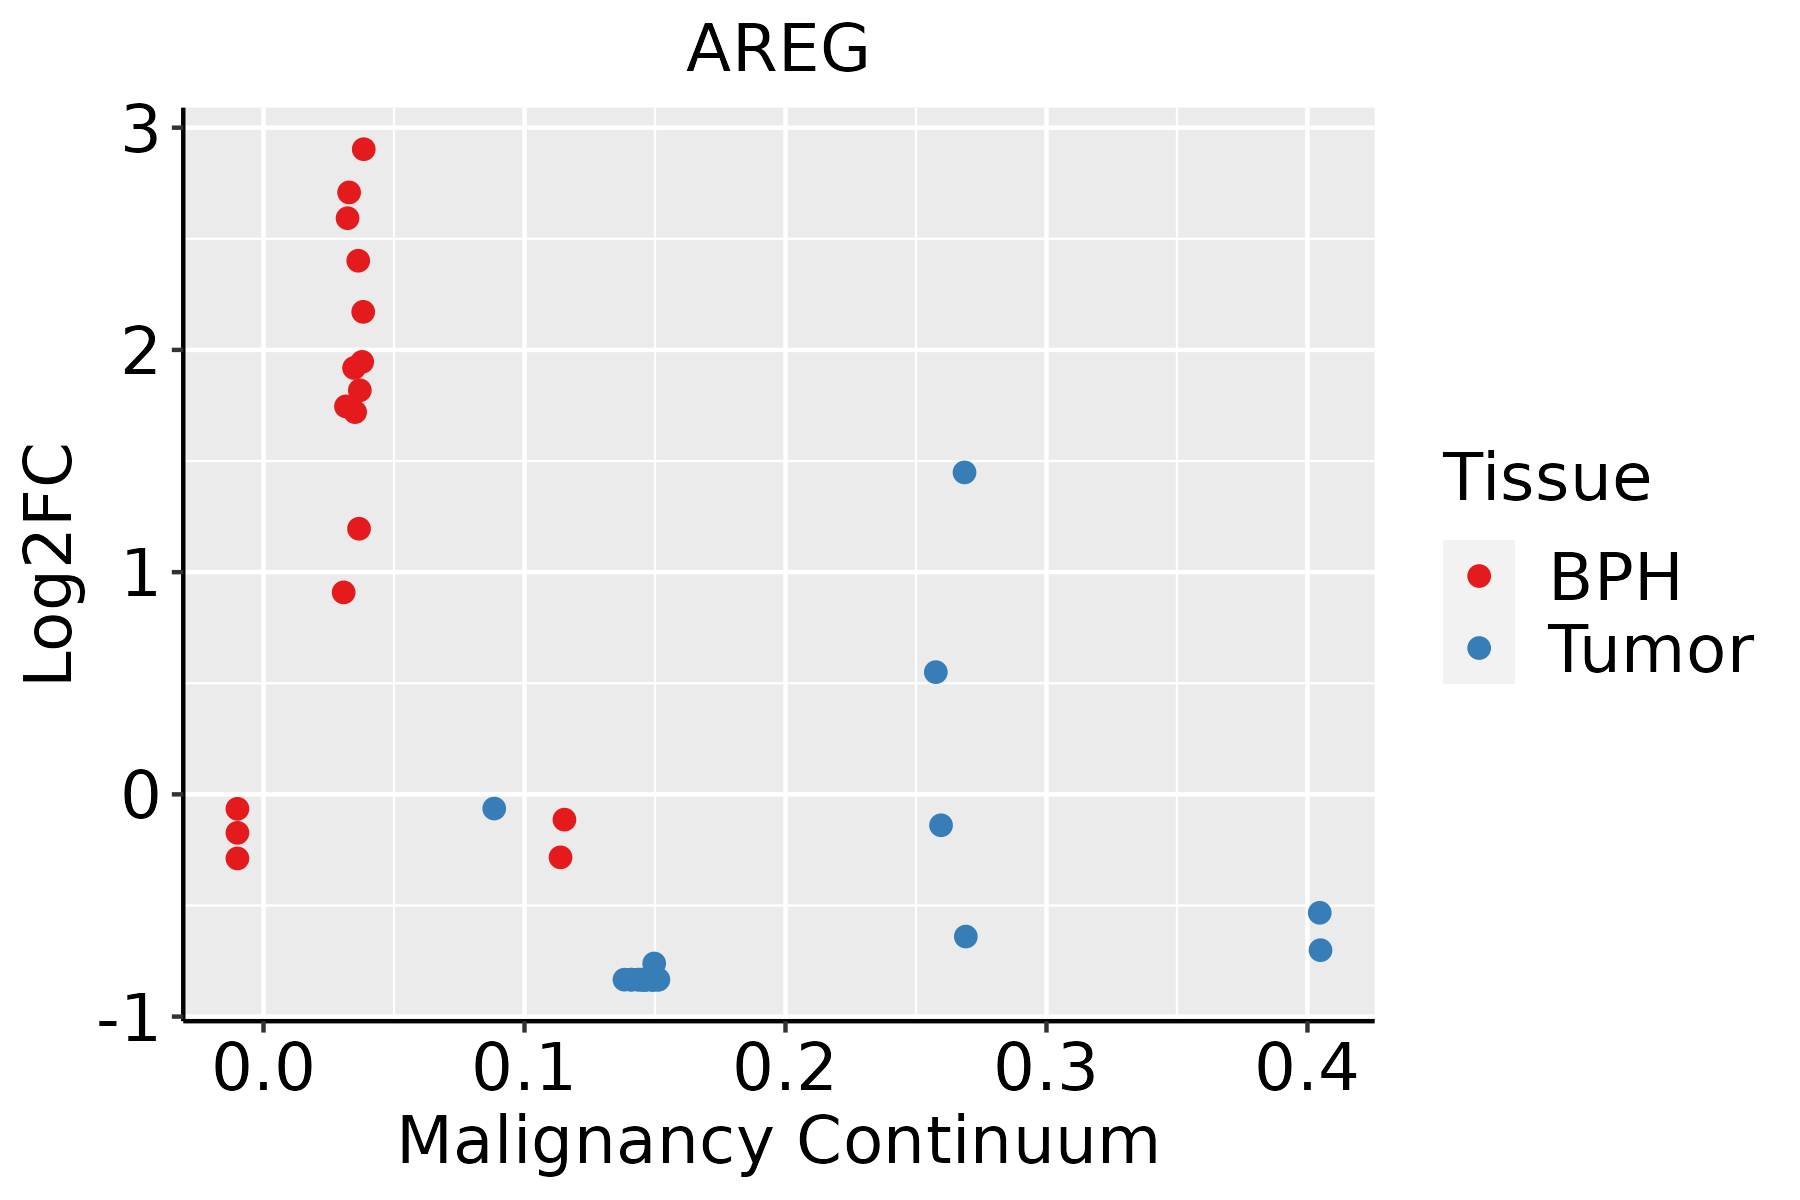 | BPH: Benign Prostatic Hyperplasia |
| Skin |  | AK: Actinic keratosis |
| cSCC: Cutaneous squamous cell carcinoma | ||
| SCCIS:squamous cell carcinoma in situ | ||
| Thyroid | 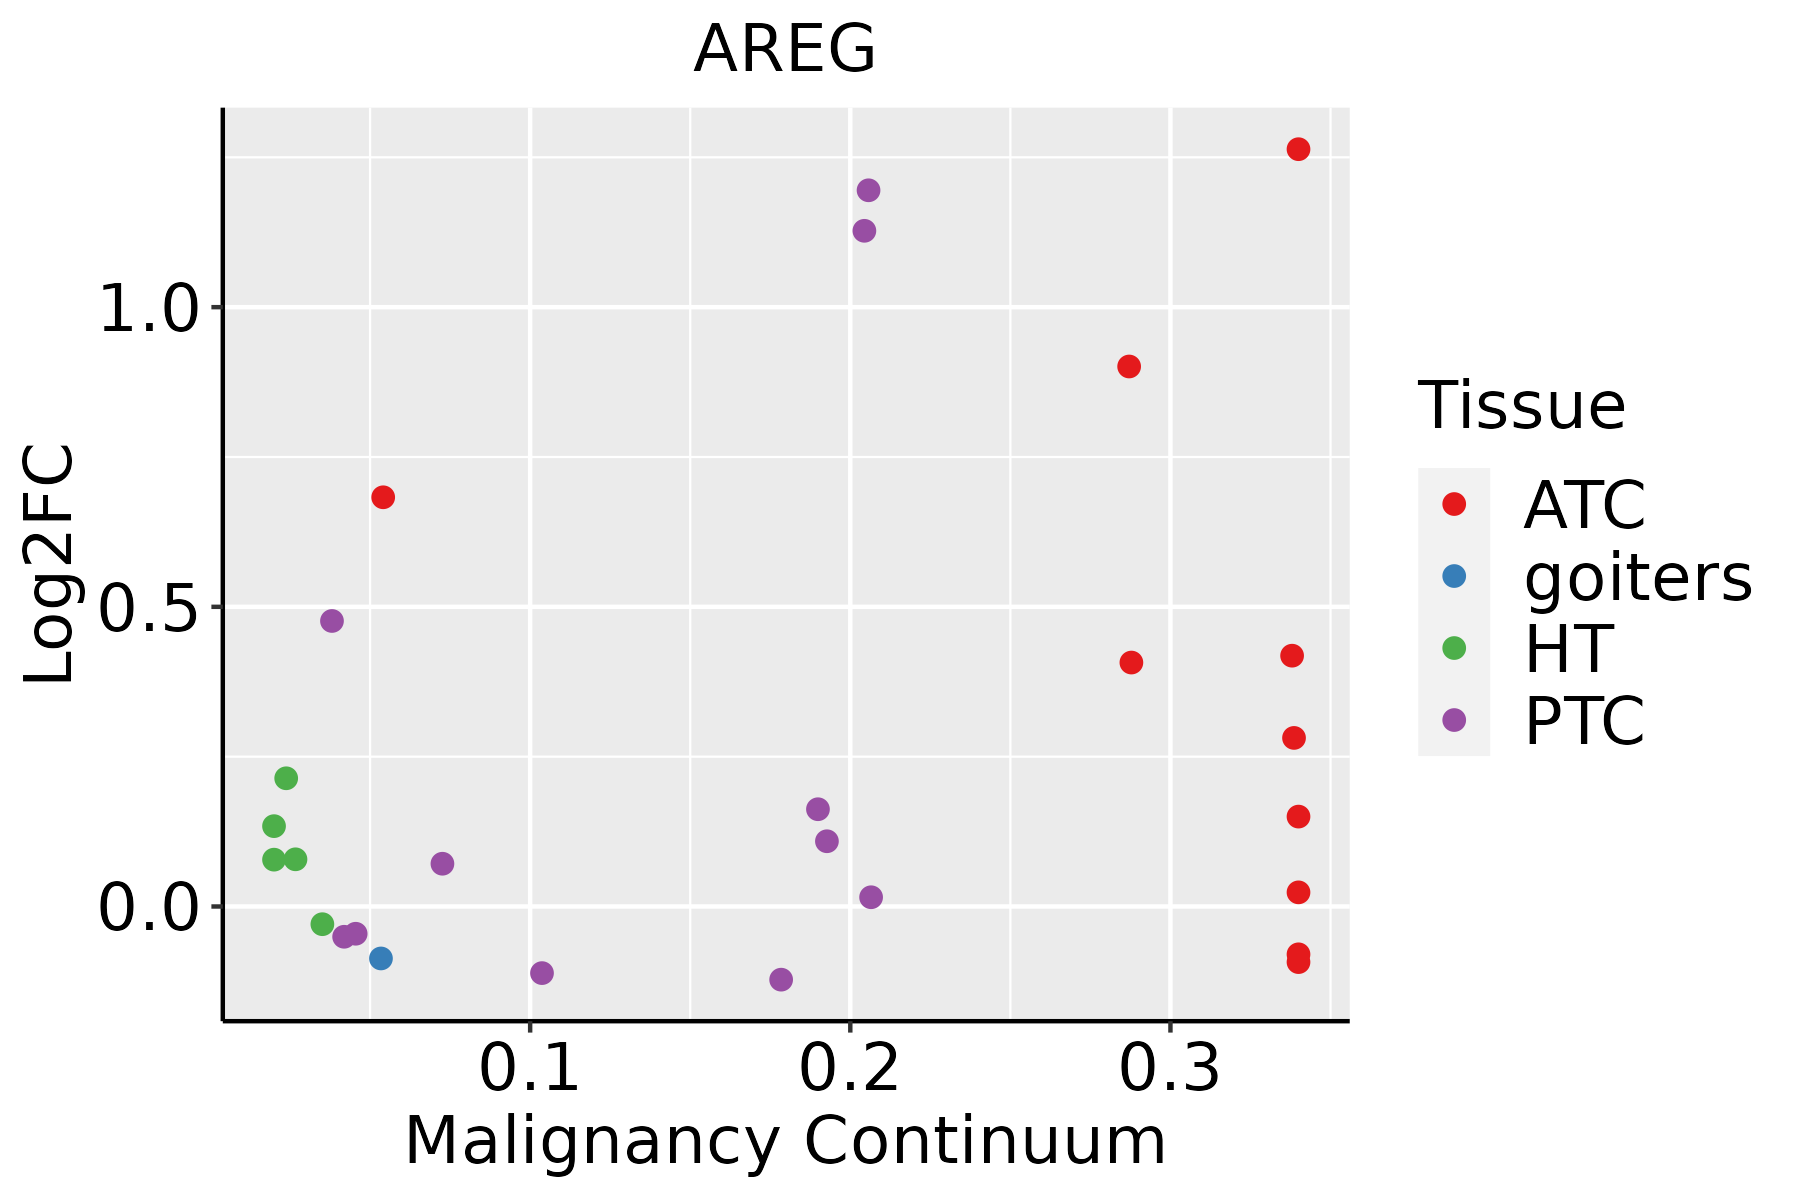 | ATC: Anaplastic thyroid cancer |
| HT: Hashimoto's thyroiditis | ||
| PTC: Papillary thyroid cancer |
| ∗log2FC in expression of this searched gene in stem-like cells from each diseased tissue sample relative to stem-like cells in normal samples in each tissue plotted against the malignancy continuum. Samples are colored based on if they are from different disease stage. |
Top |
Malignant transformation related pathway analysis |
| Find out the enriched GO biological processes and KEGG pathways involved in transition from healthy to precancer to cancer |
| Tissue | Disease Stage | Enriched GO biological Processes |
| Colorectum | AD |  |
| Colorectum | SER |  |
| Colorectum | MSS |  |
| Colorectum | MSI-H |  |
| Colorectum | FAP |  |
| ∗Top 15 enriched GO BP terms are showed in the bar plot of each disease state in each tissue. Each row represents a significant GO biological process which is colored according to the -log10(p.adjust). |
| Page: 1 2 3 4 5 6 7 8 9 |
| GO ID | Tissue | Disease Stage | Description | Gene Ratio | Bg Ratio | pvalue | p.adjust | Count |
| GO:00513842 | Stomach | CSG | response to glucocorticoid | 24/1034 | 148/18723 | 1.91e-06 | 8.78e-05 | 24 |
| GO:004854521 | Stomach | CSG | response to steroid hormone | 40/1034 | 339/18723 | 4.99e-06 | 1.94e-04 | 40 |
| GO:000030221 | Stomach | CSG | response to reactive oxygen species | 30/1034 | 222/18723 | 5.30e-06 | 2.03e-04 | 30 |
| GO:004254221 | Stomach | CSG | response to hydrogen peroxide | 21/1034 | 146/18723 | 5.27e-05 | 1.35e-03 | 21 |
| GO:004873221 | Stomach | CSG | gland development | 43/1034 | 436/18723 | 1.70e-04 | 3.33e-03 | 43 |
| GO:00506782 | Stomach | CSG | regulation of epithelial cell proliferation | 38/1034 | 381/18723 | 3.18e-04 | 5.42e-03 | 38 |
| GO:00515912 | Stomach | CSG | response to cAMP | 14/1034 | 93/18723 | 5.62e-04 | 8.29e-03 | 14 |
| GO:00466832 | Stomach | CSG | response to organophosphorus | 17/1034 | 131/18723 | 8.87e-04 | 1.18e-02 | 17 |
| GO:005067321 | Stomach | CSG | epithelial cell proliferation | 40/1034 | 437/18723 | 1.22e-03 | 1.48e-02 | 40 |
| GO:00506791 | Stomach | CSG | positive regulation of epithelial cell proliferation | 22/1034 | 207/18723 | 2.51e-03 | 2.46e-02 | 22 |
| GO:001083721 | Stomach | CSG | regulation of keratinocyte proliferation | 7/1034 | 35/18723 | 2.65e-03 | 2.55e-02 | 7 |
| GO:004343421 | Stomach | CSG | response to peptide hormone | 37/1034 | 414/18723 | 2.75e-03 | 2.62e-02 | 37 |
| GO:00140742 | Stomach | CSG | response to purine-containing compound | 17/1034 | 148/18723 | 3.35e-03 | 3.04e-02 | 17 |
| GO:0006979113 | Thyroid | PTC | response to oxidative stress | 234/5968 | 446/18723 | 6.97e-20 | 9.77e-18 | 234 |
| GO:0000302113 | Thyroid | PTC | response to reactive oxygen species | 121/5968 | 222/18723 | 2.10e-12 | 9.26e-11 | 121 |
| GO:0042542113 | Thyroid | PTC | response to hydrogen peroxide | 86/5968 | 146/18723 | 1.39e-11 | 5.60e-10 | 86 |
| GO:0043434113 | Thyroid | PTC | response to peptide hormone | 188/5968 | 414/18723 | 4.13e-09 | 1.09e-07 | 188 |
| GO:0048545113 | Thyroid | PTC | response to steroid hormone | 158/5968 | 339/18723 | 8.10e-09 | 2.00e-07 | 158 |
| GO:0045860111 | Thyroid | PTC | positive regulation of protein kinase activity | 176/5968 | 386/18723 | 8.89e-09 | 2.17e-07 | 176 |
| GO:0048732113 | Thyroid | PTC | gland development | 193/5968 | 436/18723 | 2.88e-08 | 6.42e-07 | 193 |
| Page: 1 2 3 4 5 6 7 8 9 10 11 12 13 14 15 16 17 18 19 20 21 22 23 24 25 26 27 28 29 30 31 32 33 |
| Pathway ID | Tissue | Disease Stage | Description | Gene Ratio | Bg Ratio | pvalue | p.adjust | qvalue | Count |
| hsa0521024 | Breast | DCIS | Colorectal cancer | 16/846 | 86/8465 | 1.03e-02 | 4.50e-02 | 3.32e-02 | 16 |
| hsa0521034 | Breast | DCIS | Colorectal cancer | 16/846 | 86/8465 | 1.03e-02 | 4.50e-02 | 3.32e-02 | 16 |
| hsa0401210 | Cervix | CC | ErbB signaling pathway | 28/1267 | 85/8465 | 2.40e-05 | 1.82e-04 | 1.08e-04 | 28 |
| hsa0521010 | Cervix | CC | Colorectal cancer | 27/1267 | 86/8465 | 8.60e-05 | 5.57e-04 | 3.30e-04 | 27 |
| hsa043908 | Cervix | CC | Hippo signaling pathway | 40/1267 | 157/8465 | 3.64e-04 | 1.82e-03 | 1.07e-03 | 40 |
| hsa040109 | Cervix | CC | MAPK signaling pathway | 62/1267 | 302/8465 | 4.89e-03 | 1.67e-02 | 9.86e-03 | 62 |
| hsa0401213 | Cervix | CC | ErbB signaling pathway | 28/1267 | 85/8465 | 2.40e-05 | 1.82e-04 | 1.08e-04 | 28 |
| hsa0521015 | Cervix | CC | Colorectal cancer | 27/1267 | 86/8465 | 8.60e-05 | 5.57e-04 | 3.30e-04 | 27 |
| hsa0439013 | Cervix | CC | Hippo signaling pathway | 40/1267 | 157/8465 | 3.64e-04 | 1.82e-03 | 1.07e-03 | 40 |
| hsa0401012 | Cervix | CC | MAPK signaling pathway | 62/1267 | 302/8465 | 4.89e-03 | 1.67e-02 | 9.86e-03 | 62 |
| hsa052102 | Colorectum | MSS | Colorectal cancer | 36/1875 | 86/8465 | 3.08e-05 | 3.22e-04 | 1.97e-04 | 36 |
| hsa040122 | Colorectum | MSS | ErbB signaling pathway | 30/1875 | 85/8465 | 3.73e-03 | 1.67e-02 | 1.02e-02 | 30 |
| hsa04390 | Colorectum | MSS | Hippo signaling pathway | 48/1875 | 157/8465 | 8.32e-03 | 3.10e-02 | 1.90e-02 | 48 |
| hsa052103 | Colorectum | MSS | Colorectal cancer | 36/1875 | 86/8465 | 3.08e-05 | 3.22e-04 | 1.97e-04 | 36 |
| hsa040123 | Colorectum | MSS | ErbB signaling pathway | 30/1875 | 85/8465 | 3.73e-03 | 1.67e-02 | 1.02e-02 | 30 |
| hsa043901 | Colorectum | MSS | Hippo signaling pathway | 48/1875 | 157/8465 | 8.32e-03 | 3.10e-02 | 1.90e-02 | 48 |
| hsa052104 | Colorectum | FAP | Colorectal cancer | 25/1404 | 86/8465 | 2.60e-03 | 1.19e-02 | 7.23e-03 | 25 |
| hsa04010 | Colorectum | FAP | MAPK signaling pathway | 68/1404 | 302/8465 | 4.00e-03 | 1.67e-02 | 1.02e-02 | 68 |
| hsa04151 | Colorectum | FAP | PI3K-Akt signaling pathway | 75/1404 | 354/8465 | 1.23e-02 | 4.19e-02 | 2.55e-02 | 75 |
| hsa052105 | Colorectum | FAP | Colorectal cancer | 25/1404 | 86/8465 | 2.60e-03 | 1.19e-02 | 7.23e-03 | 25 |
| Page: 1 2 3 4 |
Top |
Cell-cell communication analysis |
| Identification of potential cell-cell interactions between two cell types and their ligand-receptor pairs for different disease states |
| Ligand | Receptor | LRpair | Pathway | Tissue | Disease Stage |
| AREG | EGFR | AREG_EGFR | EGF | Breast | ADJ |
| AREG | EGFR | AREG_EGFR | EGF | Breast | DCIS |
| AREG | EGFR_ERBB2 | AREG_EGFR_ERBB2 | EGF | Breast | DCIS |
| AREG | EGFR | AREG_EGFR | EGF | Breast | Healthy |
| AREG | EGFR | AREG_EGFR | EGF | Breast | Precancer |
| AREG | EGFR | AREG_EGFR | EGF | Cervix | ADJ |
| AREG | EGFR | AREG_EGFR | EGF | Cervix | CC |
| AREG | EGFR_ERBB2 | AREG_EGFR_ERBB2 | EGF | Cervix | CC |
| AREG | EGFR | AREG_EGFR | EGF | Cervix | Healthy |
| AREG | EGFR | AREG_EGFR | EGF | Cervix | Precancer |
| AREG | EGFR | AREG_EGFR | EGF | CRC | ADJ |
| AREG | EGFR_ERBB2 | AREG_EGFR_ERBB2 | EGF | CRC | ADJ |
| AREG | EGFR | AREG_EGFR | EGF | CRC | FAP |
| AREG | EGFR_ERBB2 | AREG_EGFR_ERBB2 | EGF | CRC | FAP |
| AREG | EGFR | AREG_EGFR | EGF | CRC | MSI-H |
| AREG | EGFR_ERBB2 | AREG_EGFR_ERBB2 | EGF | CRC | MSI-H |
| AREG | EGFR | AREG_EGFR | EGF | Endometrium | ADJ |
| AREG | EGFR | AREG_EGFR | EGF | Endometrium | AEH |
| AREG | EGFR | AREG_EGFR | EGF | Endometrium | Healthy |
| AREG | EGFR | AREG_EGFR | EGF | Esophagus | ADJ |
| Page: 1 2 3 |
Top |
Single-cell gene regulatory network inference analysis |
| Find out the significant the regulons (TFs) and the target genes of each regulon across cell types for different disease states |
| TF | Cell Type | Tissue | Disease Stage | Target Gene | RSS | Regulon Activity |
| ∗The dot plots of a searched regulon are shown for all cell subpopulations in each disease state of each tissue based on the regulon specific score inferred using pySCENIC and by calculating the average expression. |
| Page: 1 |
Top |
Somatic mutation of malignant transformation related genes |
| Annotation of somatic variants for genes involved in malignant transformation |
| Hugo Symbol | Variant Class | Variant Classification | dbSNP RS | HGVSc | HGVSp | HGVSp Short | SWISSPROT | BIOTYPE | SIFT | PolyPhen | Tumor Sample Barcode | Tissue | Histology | Sex | Age | Stage | Therapy Types | Drugs | Outcome |
| AREG | SNV | Missense_Mutation | c.41N>G | p.Ser14Trp | p.S14W | P15514 | protein_coding | tolerated_low_confidence(0.11) | benign(0.003) | TCGA-AR-A24Q-01 | Breast | breast invasive carcinoma | Female | <65 | I/II | Chemotherapy | doxorubicin | SD | |
| AREG | SNV | Missense_Mutation | novel | c.474N>T | p.Glu158Asp | p.E158D | P15514 | protein_coding | deleterious(0.03) | benign(0.009) | TCGA-D8-A1JK-01 | Breast | breast invasive carcinoma | Female | >=65 | I/II | Unknown | Unknown | SD |
| AREG | insertion | Frame_Shift_Ins | rs757742243 | c.327_328insC | p.Gln112ProfsTer7 | p.Q112Pfs*7 | P15514 | protein_coding | TCGA-A2-A0T2-01 | Breast | breast invasive carcinoma | Female | >=65 | III/IV | Chemotherapy | xeloda | PD | ||
| AREG | insertion | Frame_Shift_Ins | rs757742243 | c.334dupC | p.Gln112ProfsTer7 | p.Q112Pfs*7 | P15514 | protein_coding | TCGA-AN-A0FY-01 | Breast | breast invasive carcinoma | Female | <65 | I/II | Unknown | Unknown | SD | ||
| AREG | insertion | Nonsense_Mutation | novel | c.398_399insCTAGTTGACCTTCACTATGTTTCTAATGTTTTGTATTGAATGGG | p.Gly134Ter | p.G134* | P15514 | protein_coding | TCGA-B6-A0IN-01 | Breast | breast invasive carcinoma | Female | <65 | I/II | Unknown | Unknown | PD | ||
| AREG | deletion | Frame_Shift_Del | c.398delA | p.Asn133MetfsTer30 | p.N133Mfs*30 | P15514 | protein_coding | TCGA-BH-A18G-01 | Breast | breast invasive carcinoma | Female | >=65 | I/II | Unknown | Unknown | SD | |||
| AREG | deletion | Frame_Shift_Del | novel | c.290delN | p.Ile97MetfsTer11 | p.I97Mfs*11 | P15514 | protein_coding | TCGA-D8-A27V-01 | Breast | breast invasive carcinoma | Female | <65 | I/II | Hormone Therapy | tamoxiphen | SD | ||
| AREG | SNV | Missense_Mutation | novel | c.236C>T | p.Ala79Val | p.A79V | P15514 | protein_coding | tolerated(0.37) | benign(0.006) | TCGA-2W-A8YY-01 | Cervix | cervical & endocervical cancer | Female | <65 | I/II | Chemotherapy | cisplatin | CR |
| AREG | SNV | Missense_Mutation | novel | c.405A>C | p.Lys135Asn | p.K135N | P15514 | protein_coding | tolerated(0.07) | probably_damaging(0.998) | TCGA-CA-6718-01 | Colorectum | colon adenocarcinoma | Male | <65 | I/II | Unknown | Unknown | PD |
| AREG | SNV | Missense_Mutation | novel | c.671N>T | p.Arg224Ile | p.R224I | P15514 | protein_coding | deleterious(0.04) | possibly_damaging(0.829) | TCGA-AG-A002-01 | Colorectum | rectum adenocarcinoma | Male | <65 | I/II | Unknown | Unknown | SD |
| Page: 1 2 3 4 |
Top |
Related drugs of malignant transformation related genes |
| Identification of chemicals and drugs interact with genes involved in malignant transfromation |
| (DGIdb 4.0) |
| Entrez ID | Symbol | Category | Interaction Types | Drug Claim Name | Drug Name | PMIDs |
| 374 | AREG | CELL SURFACE, GROWTH FACTOR, DRUGGABLE GENOME, DRUG RESISTANCE | panitumumab | PANITUMUMAB | 23959273 | |
| 374 | AREG | CELL SURFACE, GROWTH FACTOR, DRUGGABLE GENOME, DRUG RESISTANCE | capecitabine | CAPECITABINE | 25026457 | |
| 374 | AREG | CELL SURFACE, GROWTH FACTOR, DRUGGABLE GENOME, DRUG RESISTANCE | CETUXIMAB | CETUXIMAB | 23374602 | |
| 374 | AREG | CELL SURFACE, GROWTH FACTOR, DRUGGABLE GENOME, DRUG RESISTANCE | cetuximab | CETUXIMAB | 23959273 | |
| 374 | AREG | CELL SURFACE, GROWTH FACTOR, DRUGGABLE GENOME, DRUG RESISTANCE | CRIZOTINIB | CRIZOTINIB | 21791641 | |
| 374 | AREG | CELL SURFACE, GROWTH FACTOR, DRUGGABLE GENOME, DRUG RESISTANCE | irinotecan | IRINOTECAN | 23959273 | |
| 374 | AREG | CELL SURFACE, GROWTH FACTOR, DRUGGABLE GENOME, DRUG RESISTANCE | PANITUMUMAB | PANITUMUMAB | 26867820 | |
| 374 | AREG | CELL SURFACE, GROWTH FACTOR, DRUGGABLE GENOME, DRUG RESISTANCE | radiotherapy | 25026457 |
| Page: 1 |

Copyright 2023-Present -The University of Texas Health Science Center at Houston |