
|
|||||
|
 | |
| |
| |
| |
| |
| |
|
Gene: ZNF639 |
Gene summary for ZNF639 |
| Gene information | Species | Human | Gene symbol | ZNF639 | Gene ID | 51193 |
| Gene name | zinc finger protein 639 | |
| Gene Alias | ANC-2H01 | |
| Cytomap | 3q26.33 | |
| Gene Type | protein-coding | GO ID | GO:0001558 | UniProtAcc | Q9UID6 |
Top |
Malignant transformation analysis |
| Identification of the aberrant gene expression in precancerous and cancerous lesions by comparing the gene expression of stem-like cells in diseased tissues with normal stem cells |
| Entrez ID | Symbol | Replicates | Species | Organ | Tissue | Adj P-value | Log2FC | Malignancy |
| 51193 | ZNF639 | LZE4T | Human | Esophagus | ESCC | 4.12e-05 | 1.91e-01 | 0.0811 |
| 51193 | ZNF639 | LZE24T | Human | Esophagus | ESCC | 1.75e-09 | 3.21e-01 | 0.0596 |
| 51193 | ZNF639 | P1T-E | Human | Esophagus | ESCC | 2.25e-06 | 3.61e-01 | 0.0875 |
| 51193 | ZNF639 | P2T-E | Human | Esophagus | ESCC | 9.35e-49 | 1.01e+00 | 0.1177 |
| 51193 | ZNF639 | P4T-E | Human | Esophagus | ESCC | 1.42e-34 | 8.92e-01 | 0.1323 |
| 51193 | ZNF639 | P5T-E | Human | Esophagus | ESCC | 5.67e-35 | 7.75e-01 | 0.1327 |
| 51193 | ZNF639 | P8T-E | Human | Esophagus | ESCC | 4.67e-26 | 3.74e-01 | 0.0889 |
| 51193 | ZNF639 | P9T-E | Human | Esophagus | ESCC | 5.87e-11 | 3.32e-01 | 0.1131 |
| 51193 | ZNF639 | P10T-E | Human | Esophagus | ESCC | 6.30e-30 | 4.66e-01 | 0.116 |
| 51193 | ZNF639 | P11T-E | Human | Esophagus | ESCC | 6.82e-08 | 4.32e-01 | 0.1426 |
| 51193 | ZNF639 | P12T-E | Human | Esophagus | ESCC | 1.93e-23 | 4.97e-01 | 0.1122 |
| 51193 | ZNF639 | P15T-E | Human | Esophagus | ESCC | 1.03e-19 | 4.91e-01 | 0.1149 |
| 51193 | ZNF639 | P16T-E | Human | Esophagus | ESCC | 2.66e-25 | 3.36e-01 | 0.1153 |
| 51193 | ZNF639 | P20T-E | Human | Esophagus | ESCC | 1.81e-10 | 2.21e-01 | 0.1124 |
| 51193 | ZNF639 | P21T-E | Human | Esophagus | ESCC | 2.99e-15 | 2.71e-01 | 0.1617 |
| 51193 | ZNF639 | P22T-E | Human | Esophagus | ESCC | 1.45e-17 | 3.88e-01 | 0.1236 |
| 51193 | ZNF639 | P23T-E | Human | Esophagus | ESCC | 5.20e-18 | 5.97e-01 | 0.108 |
| 51193 | ZNF639 | P24T-E | Human | Esophagus | ESCC | 1.87e-16 | 1.87e-01 | 0.1287 |
| 51193 | ZNF639 | P26T-E | Human | Esophagus | ESCC | 1.63e-78 | 1.39e+00 | 0.1276 |
| 51193 | ZNF639 | P27T-E | Human | Esophagus | ESCC | 5.78e-27 | 6.30e-01 | 0.1055 |
| Page: 1 2 3 4 5 |
| Tissue | Expression Dynamics | Abbreviation |
| Esophagus |  | ESCC: Esophageal squamous cell carcinoma |
| HGIN: High-grade intraepithelial neoplasias | ||
| LGIN: Low-grade intraepithelial neoplasias | ||
| Liver | 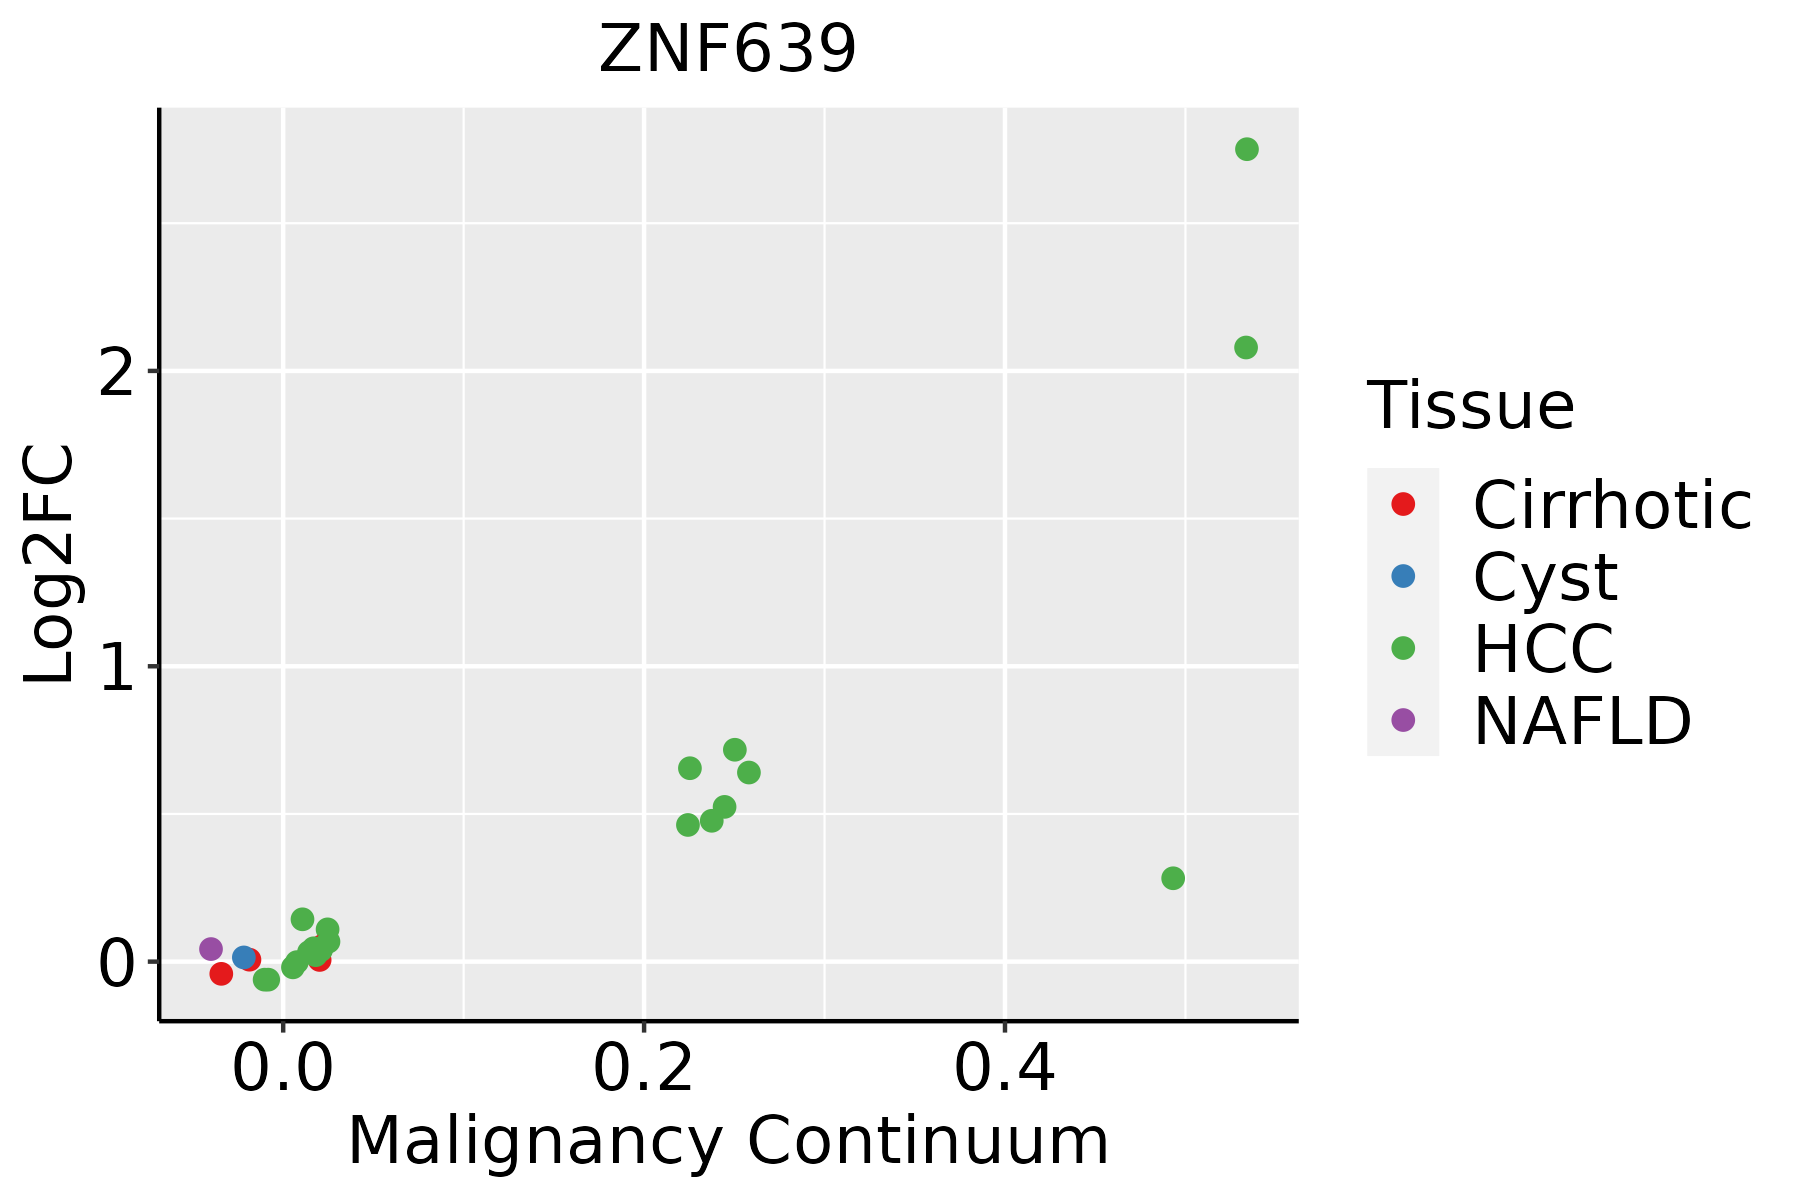 | HCC: Hepatocellular carcinoma |
| NAFLD: Non-alcoholic fatty liver disease | ||
| Oral Cavity | 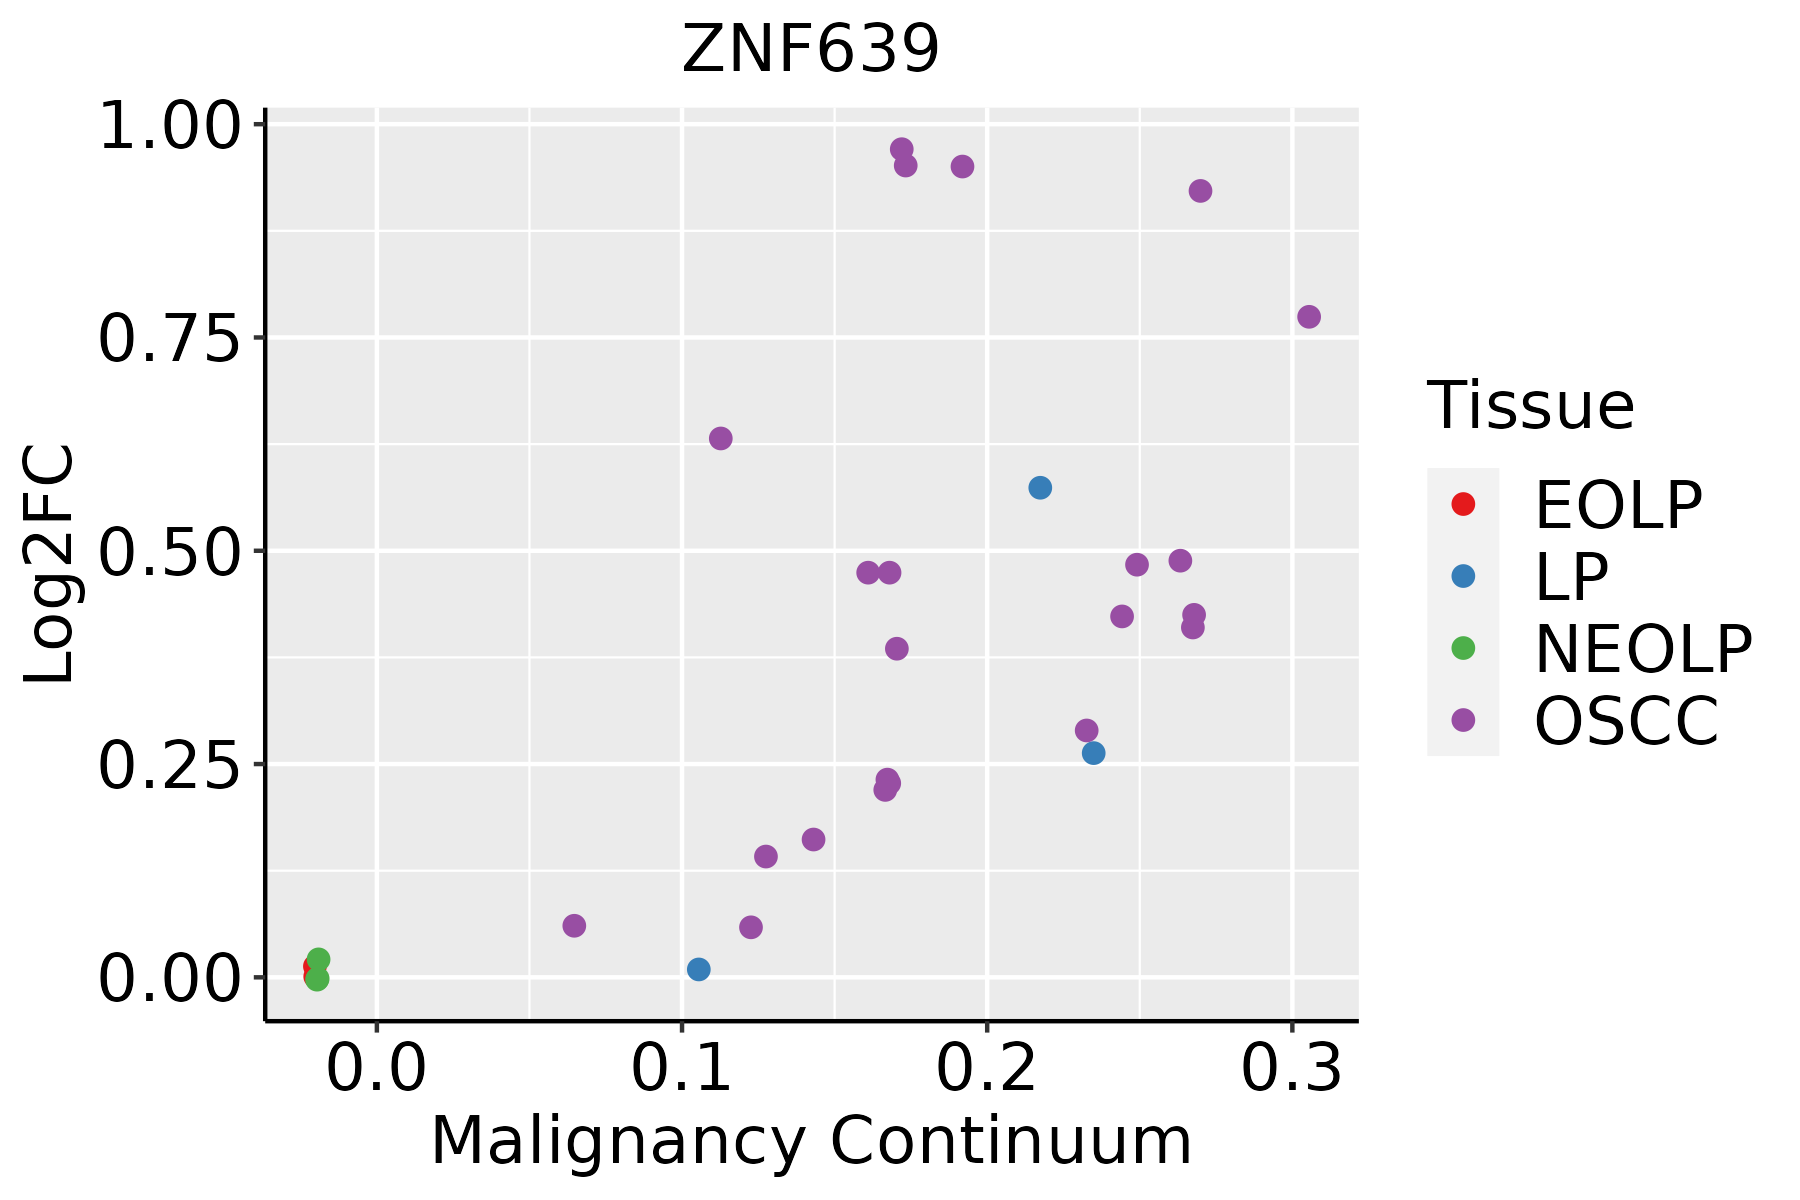 | EOLP: Erosive Oral lichen planus |
| LP: leukoplakia | ||
| NEOLP: Non-erosive oral lichen planus | ||
| OSCC: Oral squamous cell carcinoma |
| ∗log2FC in expression of this searched gene in stem-like cells from each diseased tissue sample relative to stem-like cells in normal samples in each tissue plotted against the malignancy continuum. Samples are colored based on if they are from different disease stage. |
Top |
Malignant transformation related pathway analysis |
| Find out the enriched GO biological processes and KEGG pathways involved in transition from healthy to precancer to cancer |
| Tissue | Disease Stage | Enriched GO biological Processes |
| Colorectum | AD |  |
| Colorectum | SER |  |
| Colorectum | MSS |  |
| Colorectum | MSI-H |  |
| Colorectum | FAP |  |
| ∗Top 15 enriched GO BP terms are showed in the bar plot of each disease state in each tissue. Each row represents a significant GO biological process which is colored according to the -log10(p.adjust). |
| Page: 1 2 3 4 5 6 7 8 9 |
| GO ID | Tissue | Disease Stage | Description | Gene Ratio | Bg Ratio | pvalue | p.adjust | Count |
| GO:004440320 | Oral cavity | OSCC | biological process involved in symbiotic interaction | 173/7305 | 290/18723 | 6.80e-13 | 3.19e-11 | 173 |
| GO:001908010 | Oral cavity | OSCC | viral gene expression | 69/7305 | 94/18723 | 1.26e-11 | 4.44e-10 | 69 |
| GO:000155816 | Oral cavity | OSCC | regulation of cell growth | 228/7305 | 414/18723 | 1.74e-11 | 6.09e-10 | 228 |
| GO:005170120 | Oral cavity | OSCC | biological process involved in interaction with host | 125/7305 | 203/18723 | 5.60e-11 | 1.74e-09 | 125 |
| GO:005212620 | Oral cavity | OSCC | movement in host environment | 106/7305 | 175/18723 | 5.84e-09 | 1.26e-07 | 106 |
| GO:00518176 | Oral cavity | OSCC | modulation of process of other organism involved in symbiotic interaction | 54/7305 | 81/18723 | 4.22e-07 | 6.25e-06 | 54 |
| GO:00190833 | Oral cavity | OSCC | viral transcription | 36/7305 | 50/18723 | 2.26e-06 | 2.87e-05 | 36 |
| GO:004440920 | Oral cavity | OSCC | entry into host | 86/7305 | 151/18723 | 5.74e-06 | 6.37e-05 | 86 |
| GO:00358218 | Oral cavity | OSCC | modulation of process of other organism | 64/7305 | 106/18723 | 6.70e-06 | 7.36e-05 | 64 |
| GO:00303079 | Oral cavity | OSCC | positive regulation of cell growth | 92/7305 | 166/18723 | 1.27e-05 | 1.29e-04 | 92 |
| GO:00518517 | Oral cavity | OSCC | modulation by host of symbiont process | 40/7305 | 60/18723 | 1.32e-05 | 1.33e-04 | 40 |
| GO:004671820 | Oral cavity | OSCC | viral entry into host cell | 81/7305 | 144/18723 | 1.98e-05 | 1.89e-04 | 81 |
| GO:00517029 | Oral cavity | OSCC | biological process involved in interaction with symbiont | 54/7305 | 94/18723 | 2.20e-04 | 1.44e-03 | 54 |
| GO:00439223 | Oral cavity | OSCC | negative regulation by host of viral transcription | 12/7305 | 14/18723 | 4.62e-04 | 2.76e-03 | 12 |
| GO:004592710 | Oral cavity | OSCC | positive regulation of growth | 125/7305 | 259/18723 | 1.44e-03 | 6.97e-03 | 125 |
| GO:00439232 | Oral cavity | OSCC | positive regulation by host of viral transcription | 12/7305 | 16/18723 | 3.83e-03 | 1.57e-02 | 12 |
| GO:0016032110 | Oral cavity | LP | viral process | 211/4623 | 415/18723 | 4.06e-31 | 3.18e-28 | 211 |
| GO:0019058110 | Oral cavity | LP | viral life cycle | 161/4623 | 317/18723 | 5.99e-24 | 2.21e-21 | 161 |
| GO:0051701110 | Oral cavity | LP | biological process involved in interaction with host | 100/4623 | 203/18723 | 2.72e-14 | 3.10e-12 | 100 |
| GO:0044403110 | Oral cavity | LP | biological process involved in symbiotic interaction | 130/4623 | 290/18723 | 4.23e-14 | 4.64e-12 | 130 |
| Page: 1 2 3 4 |
| Pathway ID | Tissue | Disease Stage | Description | Gene Ratio | Bg Ratio | pvalue | p.adjust | qvalue | Count |
| Page: 1 |
Top |
Cell-cell communication analysis |
| Identification of potential cell-cell interactions between two cell types and their ligand-receptor pairs for different disease states |
| Ligand | Receptor | LRpair | Pathway | Tissue | Disease Stage |
| Page: 1 |
Top |
Single-cell gene regulatory network inference analysis |
| Find out the significant the regulons (TFs) and the target genes of each regulon across cell types for different disease states |
| TF | Cell Type | Tissue | Disease Stage | Target Gene | RSS | Regulon Activity |
| ZNF639 | BAS | Breast | DCIS | CCK,FAM84B,ZNF668, etc. | 1.17e-01 |  |
| ZNF639 | PERI | Lung | AAH | COPS4,PTPRD,HIST1H2BJ, etc. | 2.38e-01 |  |
| ∗The dot plots of a searched regulon are shown for all cell subpopulations in each disease state of each tissue based on the regulon specific score inferred using pySCENIC and by calculating the average expression. |
| Page: 1 |
Top |
Somatic mutation of malignant transformation related genes |
| Annotation of somatic variants for genes involved in malignant transformation |
| Hugo Symbol | Variant Class | Variant Classification | dbSNP RS | HGVSc | HGVSp | HGVSp Short | SWISSPROT | BIOTYPE | SIFT | PolyPhen | Tumor Sample Barcode | Tissue | Histology | Sex | Age | Stage | Therapy Types | Drugs | Outcome |
| ZNF639 | SNV | Missense_Mutation | c.879N>T | p.Gln293His | p.Q293H | Q9UID6 | protein_coding | deleterious(0.01) | probably_damaging(0.992) | TCGA-A8-A08T-01 | Breast | breast invasive carcinoma | Female | <65 | III/IV | Unknown | Unknown | PD | |
| ZNF639 | SNV | Missense_Mutation | novel | c.894N>G | p.Phe298Leu | p.F298L | Q9UID6 | protein_coding | deleterious(0.03) | probably_damaging(0.973) | TCGA-OL-A5RW-01 | Breast | breast invasive carcinoma | Female | <65 | I/II | Chemotherapy | adriamycin | CR |
| ZNF639 | SNV | Missense_Mutation | c.445G>A | p.Glu149Lys | p.E149K | Q9UID6 | protein_coding | tolerated(0.05) | probably_damaging(0.971) | TCGA-IR-A3LK-01 | Cervix | cervical & endocervical cancer | Female | >=65 | I/II | Chemotherapy | cisplatin | PD | |
| ZNF639 | SNV | Missense_Mutation | c.407A>G | p.Glu136Gly | p.E136G | Q9UID6 | protein_coding | deleterious(0) | probably_damaging(0.979) | TCGA-AA-3672-01 | Colorectum | colon adenocarcinoma | Female | >=65 | III/IV | Unknown | Unknown | SD | |
| ZNF639 | SNV | Missense_Mutation | novel | c.475N>A | p.Ser159Thr | p.S159T | Q9UID6 | protein_coding | tolerated(0.35) | probably_damaging(0.931) | TCGA-AM-5820-01 | Colorectum | colon adenocarcinoma | Female | <65 | I/II | Unknown | Unknown | SD |
| ZNF639 | SNV | Missense_Mutation | rs767153760 | c.1144N>T | p.Arg382Trp | p.R382W | Q9UID6 | protein_coding | deleterious(0.03) | possibly_damaging(0.825) | TCGA-CA-6717-01 | Colorectum | colon adenocarcinoma | Male | <65 | I/II | Chemotherapy | oxaliplatin | CR |
| ZNF639 | SNV | Missense_Mutation | c.47N>T | p.Ser16Phe | p.S16F | Q9UID6 | protein_coding | deleterious_low_confidence(0) | benign(0.003) | TCGA-CM-4747-01 | Colorectum | colon adenocarcinoma | Male | <65 | I/II | Chemotherapy | fluorouracil | SD | |
| ZNF639 | SNV | Missense_Mutation | c.1243A>G | p.Met415Val | p.M415V | Q9UID6 | protein_coding | tolerated(0.12) | possibly_damaging(0.678) | TCGA-DM-A285-01 | Colorectum | colon adenocarcinoma | Female | >=65 | III/IV | Unknown | Unknown | SD | |
| ZNF639 | SNV | Missense_Mutation | c.1246N>A | p.Leu416Ile | p.L416I | Q9UID6 | protein_coding | tolerated(0.41) | probably_damaging(0.952) | TCGA-G4-6304-01 | Colorectum | colon adenocarcinoma | Female | >=65 | I/II | Chemotherapy | fluorouracil | PD | |
| ZNF639 | insertion | In_Frame_Ins | novel | c.158_159insCAAGTACAG | p.Phe53_Asp54insLysTyrSer | p.F53_D54insKYS | Q9UID6 | protein_coding | TCGA-AM-5820-01 | Colorectum | colon adenocarcinoma | Female | <65 | I/II | Unknown | Unknown | SD |
| Page: 1 2 3 4 5 6 |
Top |
Related drugs of malignant transformation related genes |
| Identification of chemicals and drugs interact with genes involved in malignant transfromation |
| (DGIdb 4.0) |
| Entrez ID | Symbol | Category | Interaction Types | Drug Claim Name | Drug Name | PMIDs |
| Page: 1 |

Copyright 2023-Present -The University of Texas Health Science Center at Houston |