Schematic overview of the cellular and molecular mechanisms involved in the cancer progression, including the proposed cellular and molecular mechanisms in cancer cells trajectory. AT1: alveolar type 1 cells; AT2: alveolar type 2 cells; AAH: atypical adenomatous hyperplasia; AIS: adenocarcinoma in situ; MIA: minimally invasive adenocarcinoma; IA: invasive adenocarcinoma; EMT: epithelial-mesenchymal transition

Home

Download

Statistics

Help

Contact

Center for Computational Systems Medicine
leaf

Gene summary

leaf

Malignant transformation analysis

leaf

Malignant transformation related pathway analysis

leaf

Cell-cell communication analysis

leaf

Single-cell gene regulatory network inference analysis

leaf

Somatic mutation of malignant transformation related genes

leaf

Related drugs of malignant transformation related genes

Gene: ZNF451

Gene summary for ZNF451

check button Gene summary.

Gene informationSpeciesHuman
Gene symbol

ZNF451

Gene ID

26036

Gene namezinc finger protein 451
Gene AliasCOASTER
Cytomap6p12.1
Gene Typeprotein-coding
GO ID

GO:0000122

UniProtAcc

Q96JY2


Top

Malignant transformation analysis

check button Identification of the aberrant gene expression in precancerous and cancerous lesions by comparing the gene expression of stem-like cells in diseased tissues with normal stem cells
check button Malignant transformation involving gene list.
Entrez IDSymbolReplicatesSpeciesOrganTissueAdj P-valueLog2FCMalignancy
26036ZNF451LZE2THumanEsophagusESCC9.68e-065.80e-010.082
26036ZNF451LZE4THumanEsophagusESCC7.60e-153.42e-010.0811
26036ZNF451LZE7THumanEsophagusESCC3.13e-201.11e+000.0667
26036ZNF451LZE20THumanEsophagusESCC5.76e-072.17e-010.0662
26036ZNF451LZE22THumanEsophagusESCC3.16e-021.65e-010.068
26036ZNF451LZE24THumanEsophagusESCC1.00e-092.70e-010.0596
26036ZNF451LZE6THumanEsophagusESCC4.05e-021.96e-010.0845
26036ZNF451P1T-EHumanEsophagusESCC4.05e-083.48e-010.0875
26036ZNF451P2T-EHumanEsophagusESCC1.31e-202.55e-010.1177
26036ZNF451P4T-EHumanEsophagusESCC5.30e-163.87e-010.1323
26036ZNF451P5T-EHumanEsophagusESCC4.64e-162.05e-010.1327
26036ZNF451P8T-EHumanEsophagusESCC2.81e-182.91e-010.0889
26036ZNF451P9T-EHumanEsophagusESCC1.98e-183.04e-010.1131
26036ZNF451P10T-EHumanEsophagusESCC1.07e-223.38e-010.116
26036ZNF451P11T-EHumanEsophagusESCC1.43e-074.81e-010.1426
26036ZNF451P12T-EHumanEsophagusESCC6.51e-264.31e-010.1122
26036ZNF451P15T-EHumanEsophagusESCC1.89e-181.80e-010.1149
26036ZNF451P16T-EHumanEsophagusESCC6.39e-273.59e-010.1153
26036ZNF451P17T-EHumanEsophagusESCC4.01e-083.68e-010.1278
26036ZNF451P19T-EHumanEsophagusESCC8.68e-033.19e-010.1662
Page: 1 2 3 4 5 6 7 

check button Transcriptomic changes along malignancy continuum.
TissueExpression DynamicsAbbreviation
EsophagusThe image shows the transcriptomic changes along malignancy continuum.log2FC in expression of this searched gene in stem-like cells from each diseased tissue sample relative to stem-like cells in normal samples in each tissue plotted against the malignancy continuum. Samples are colored based on if they are from different disease stage.
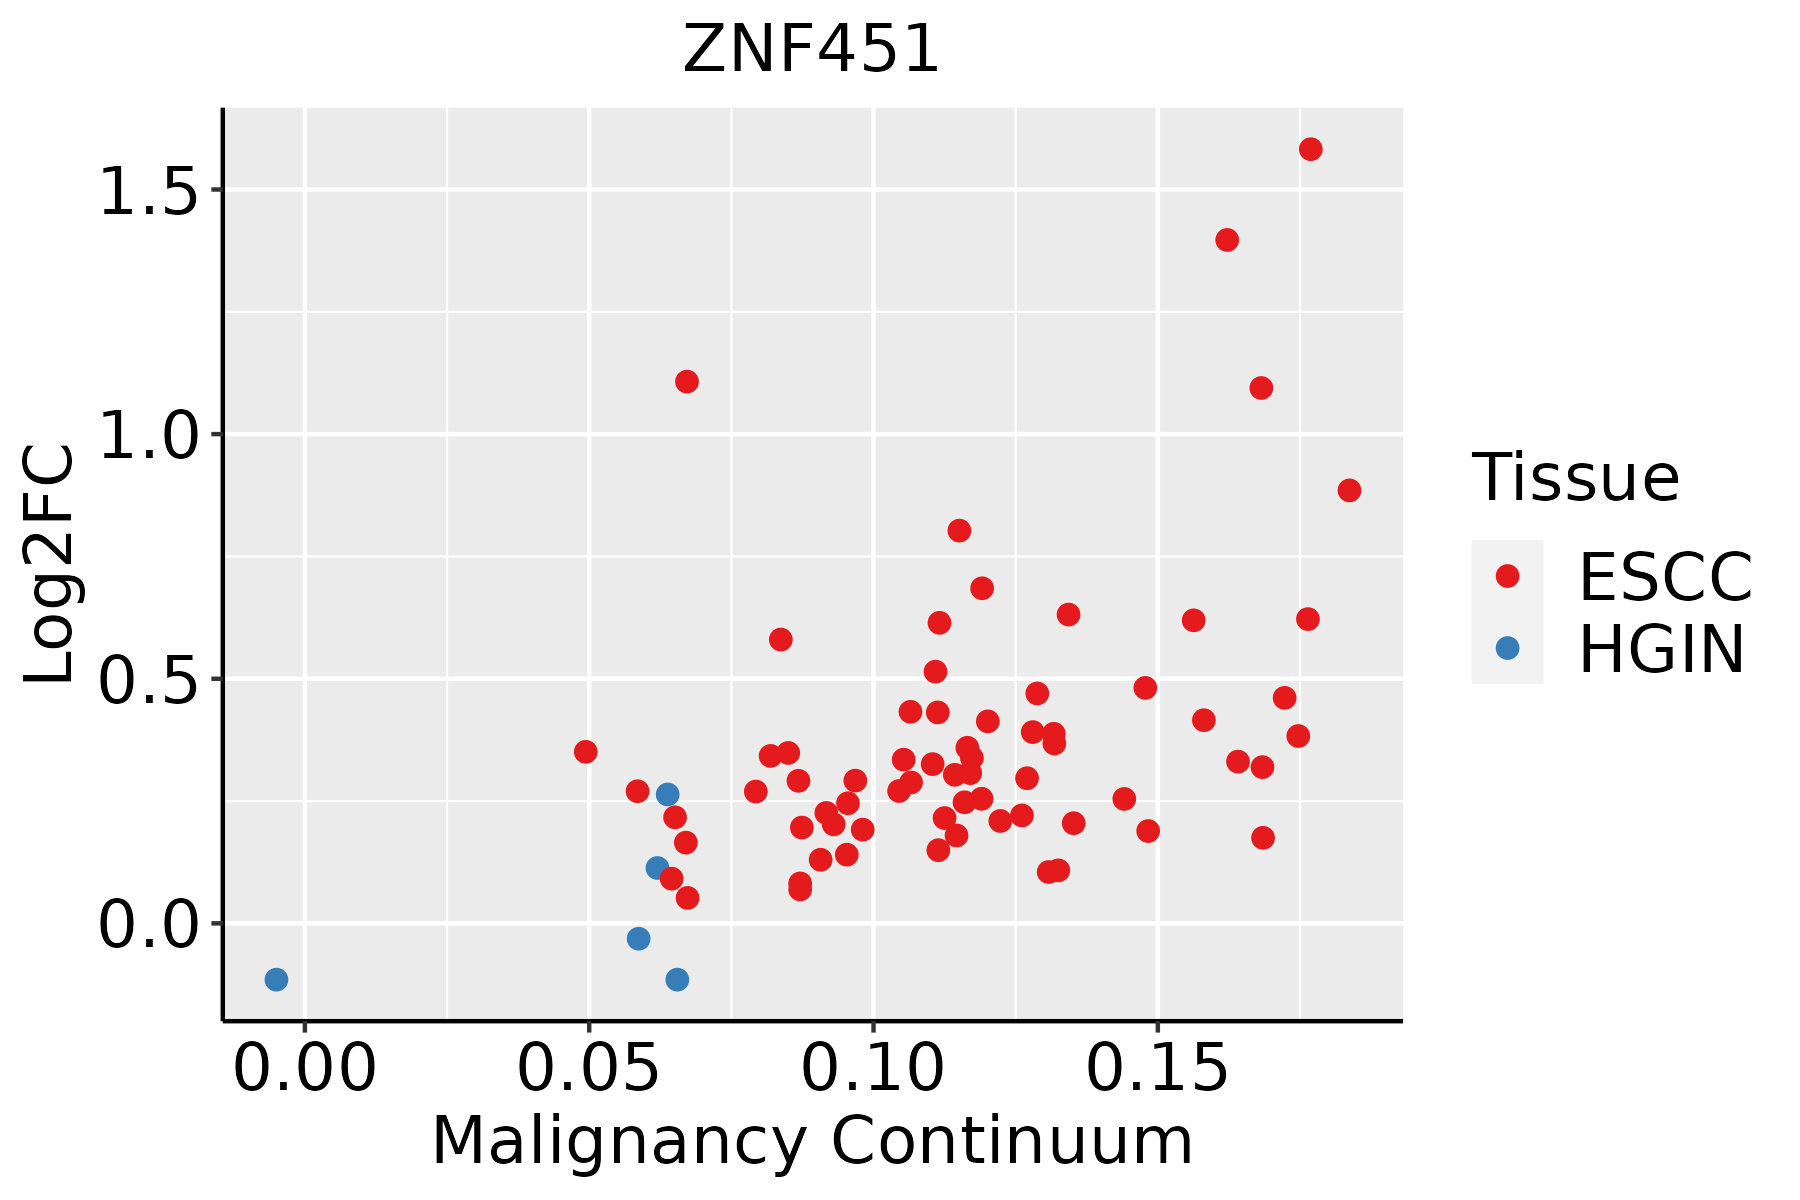
ESCC: Esophageal squamous cell carcinoma
HGIN: High-grade intraepithelial neoplasias
LGIN: Low-grade intraepithelial neoplasias
LiverThe image shows the transcriptomic changes along malignancy continuum.log2FC in expression of this searched gene in stem-like cells from each diseased tissue sample relative to stem-like cells in normal samples in each tissue plotted against the malignancy continuum. Samples are colored based on if they are from different disease stage.
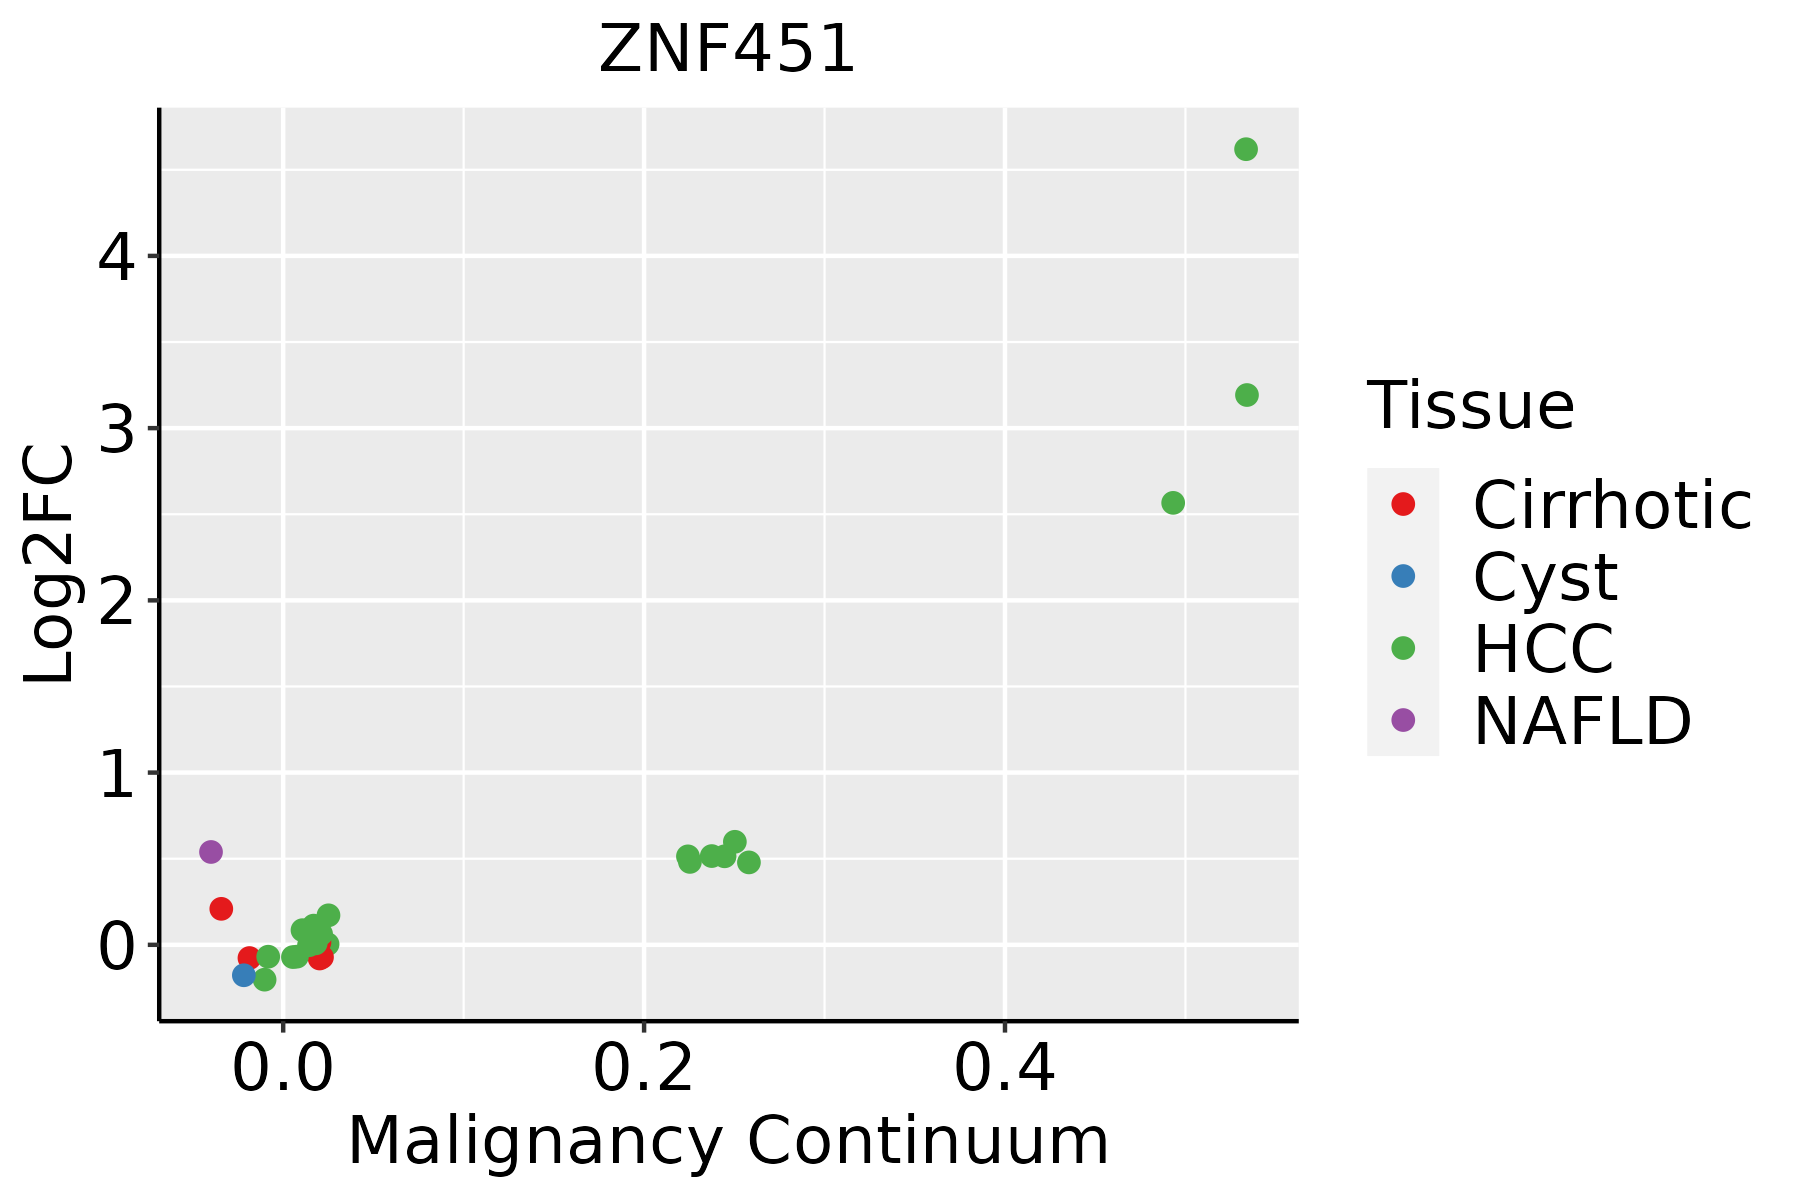
HCC: Hepatocellular carcinoma
NAFLD: Non-alcoholic fatty liver disease
LungThe image shows the transcriptomic changes along malignancy continuum.log2FC in expression of this searched gene in stem-like cells from each diseased tissue sample relative to stem-like cells in normal samples in each tissue plotted against the malignancy continuum. Samples are colored based on if they are from different disease stage.AAH: Atypical adenomatous hyperplasia
AIS: Adenocarcinoma in situ
IAC: Invasive lung adenocarcinoma
MIA: Minimally invasive adenocarcinoma
Oral CavityThe image shows the transcriptomic changes along malignancy continuum.log2FC in expression of this searched gene in stem-like cells from each diseased tissue sample relative to stem-like cells in normal samples in each tissue plotted against the malignancy continuum. Samples are colored based on if they are from different disease stage.
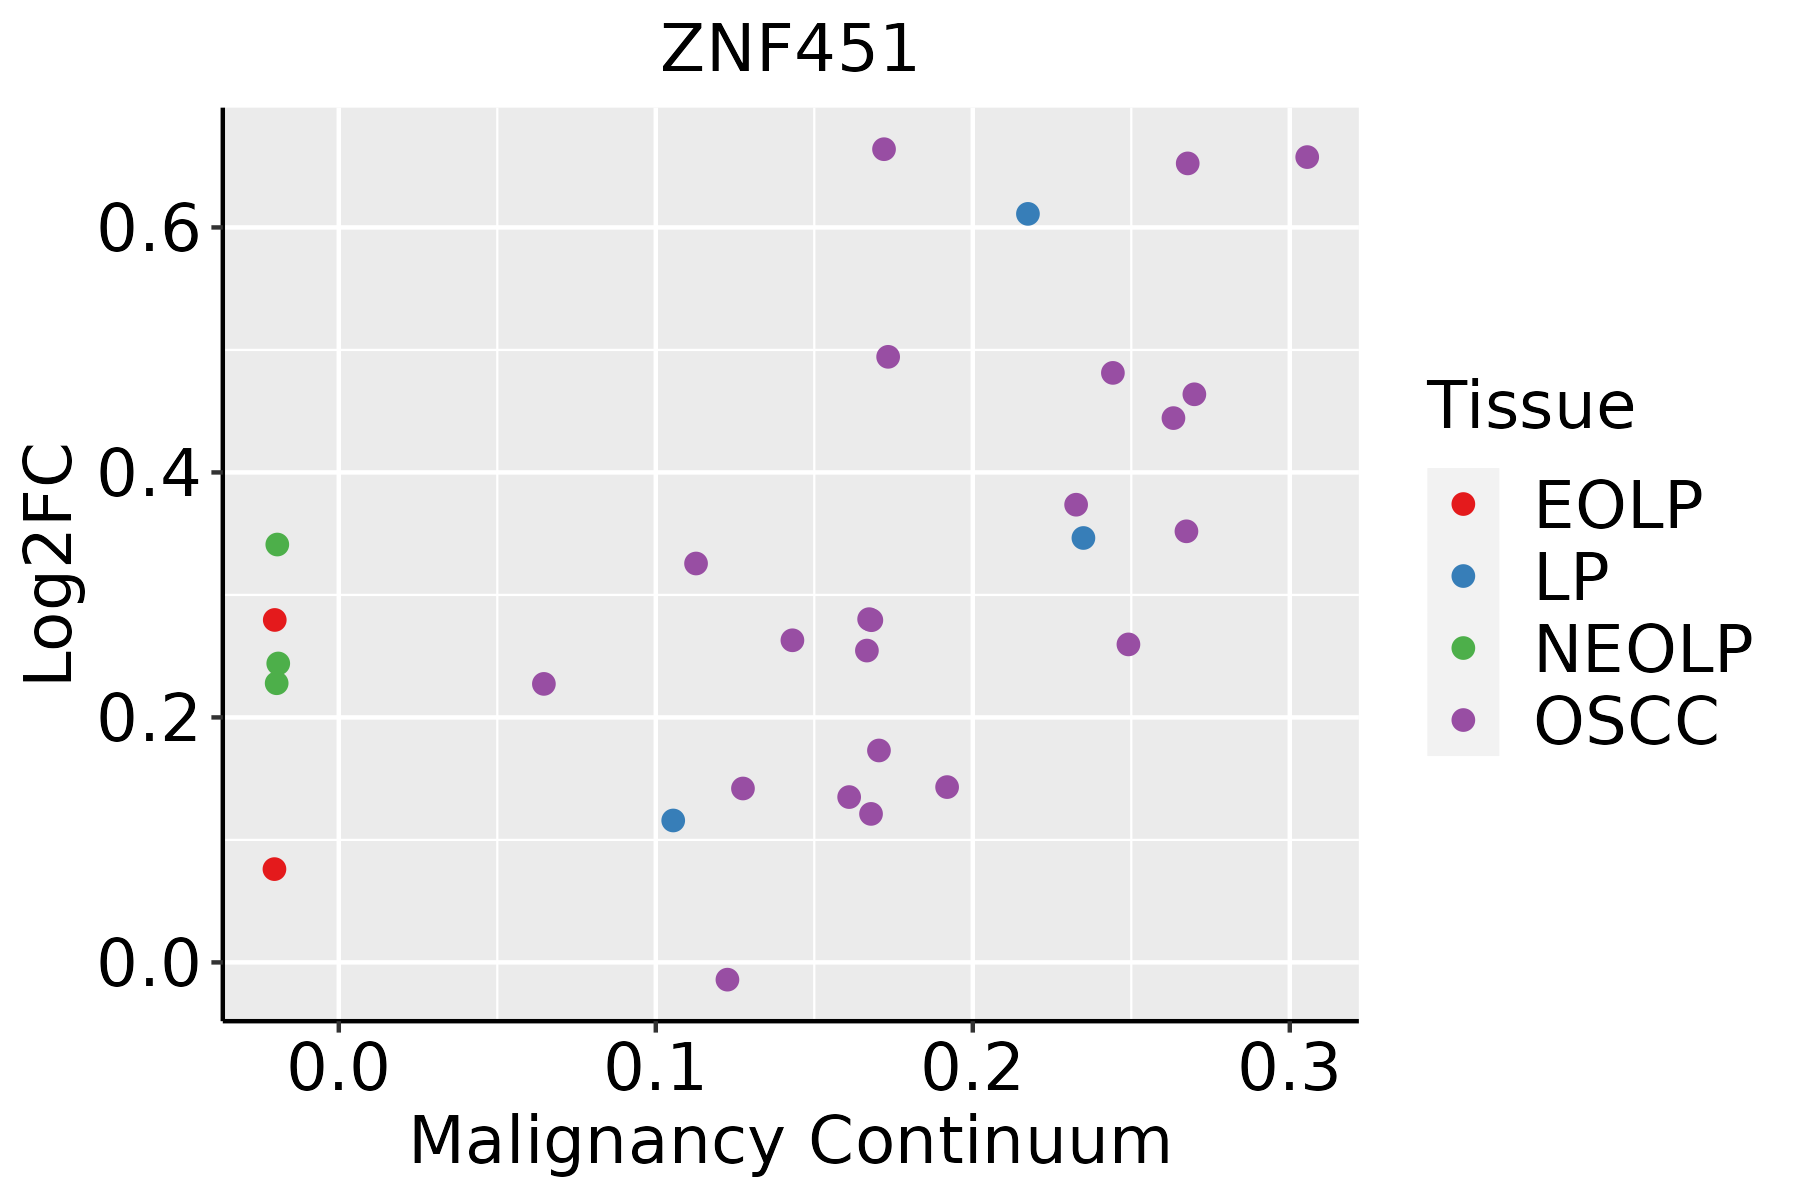
EOLP: Erosive Oral lichen planus
LP: leukoplakia
NEOLP: Non-erosive oral lichen planus
OSCC: Oral squamous cell carcinoma
ProstateThe image shows the transcriptomic changes along malignancy continuum.log2FC in expression of this searched gene in stem-like cells from each diseased tissue sample relative to stem-like cells in normal samples in each tissue plotted against the malignancy continuum. Samples are colored based on if they are from different disease stage.BPH: Benign Prostatic Hyperplasia
ThyroidThe image shows the transcriptomic changes along malignancy continuum.log2FC in expression of this searched gene in stem-like cells from each diseased tissue sample relative to stem-like cells in normal samples in each tissue plotted against the malignancy continuum. Samples are colored based on if they are from different disease stage.
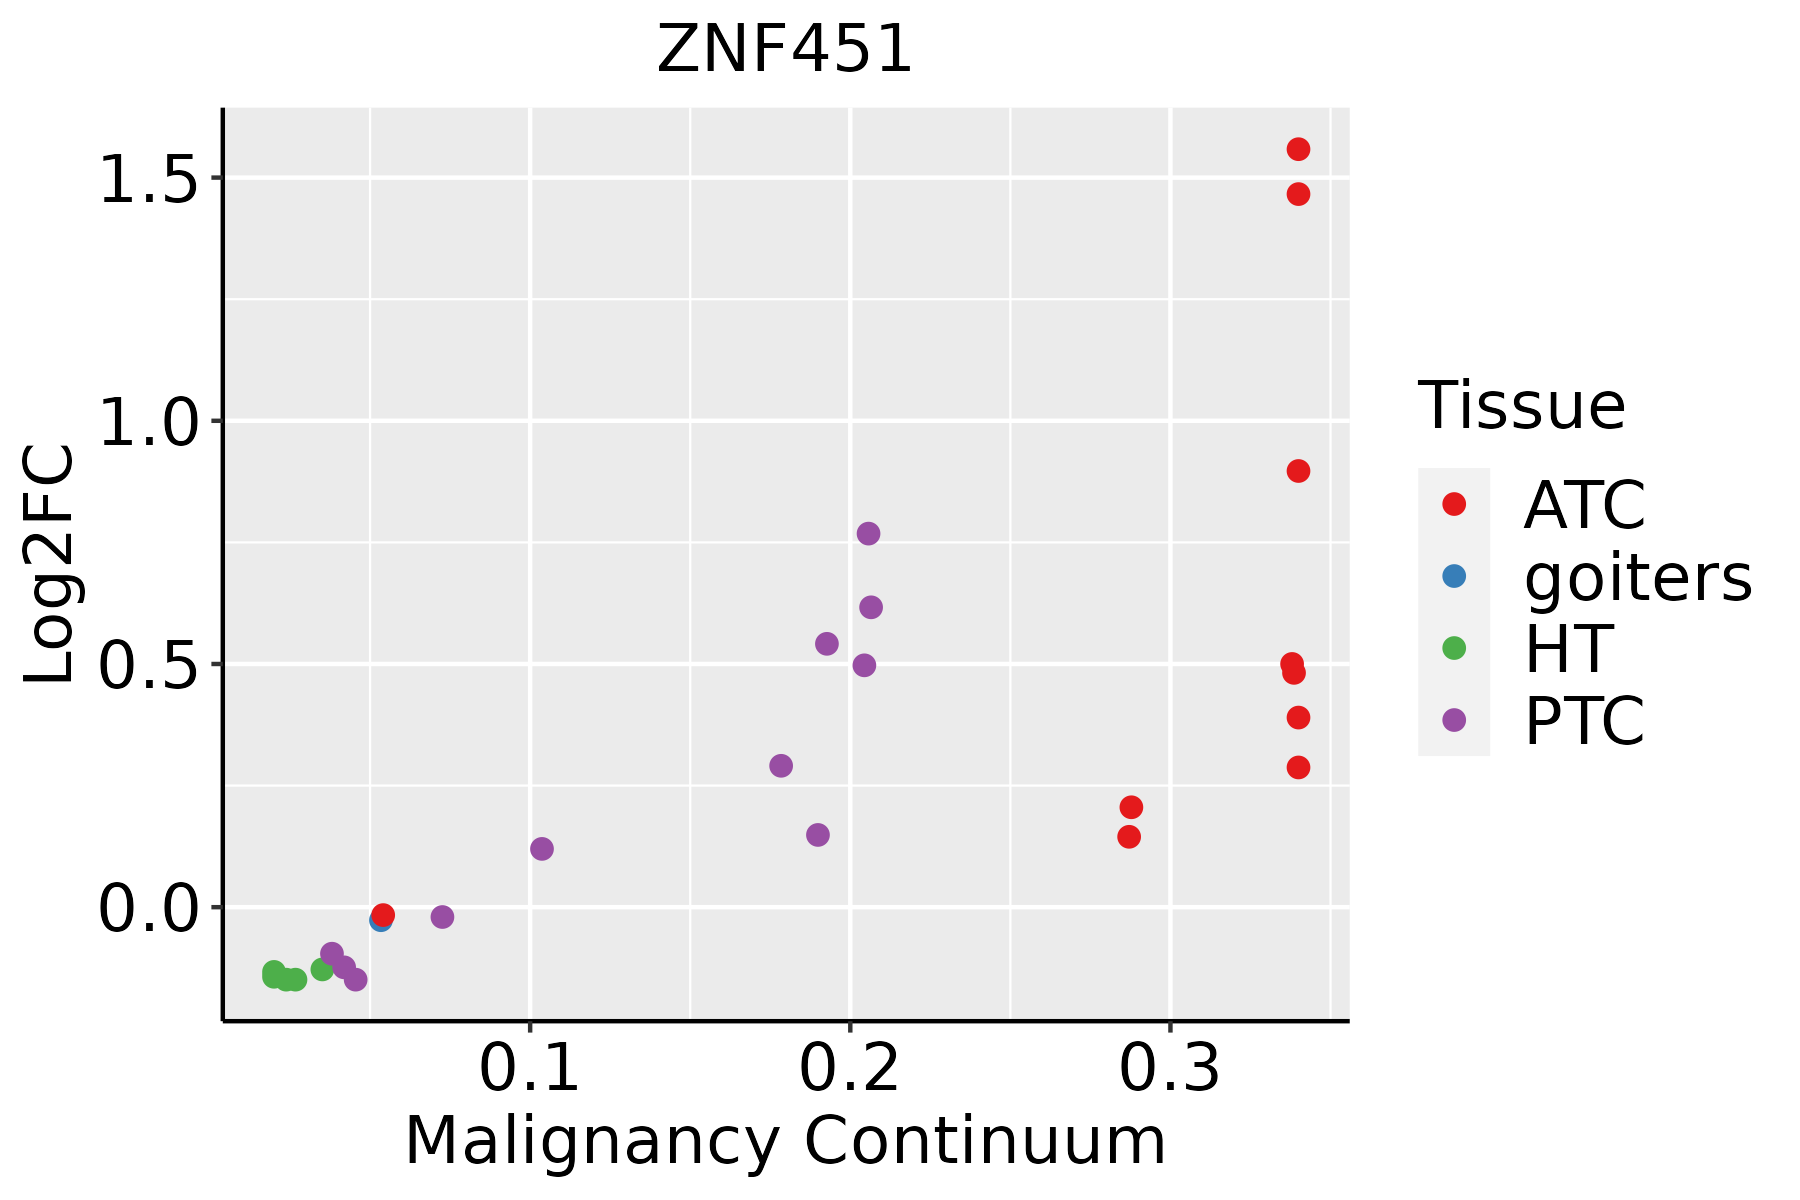
ATC: Anaplastic thyroid cancer
HT: Hashimoto's thyroiditis
PTC: Papillary thyroid cancer
∗log2FC in expression of this searched gene in stem-like cells from each diseased tissue sample relative to stem-like cells in normal samples in each tissue plotted against the malignancy continuum. Samples are colored based on if they are from different disease stage.

Top

Malignant transformation related pathway analysis

check buttonFind out the enriched GO biological processes and KEGG pathways involved in transition from healthy to precancer to cancer
check button Figure of enriched GO biological processes.
TissueDisease StageEnriched GO biological Processes
ColorectumADGO analysis - Figure of enriched GO biological processes: Top 15 enriched GO BP terms are showed in the bar plot of each disease state in each tissue. Each row represents a significant GO biological process which is colored according to the -log10(p.adjust).
ColorectumSERGO analysis - Figure of enriched GO biological processes: Top 15 enriched GO BP terms are showed in the bar plot of each disease state in each tissue. Each row represents a significant GO biological process which is colored according to the -log10(p.adjust).
ColorectumMSSGO analysis - Figure of enriched GO biological processes: Top 15 enriched GO BP terms are showed in the bar plot of each disease state in each tissue. Each row represents a significant GO biological process which is colored according to the -log10(p.adjust).
ColorectumMSI-HGO analysis - Figure of enriched GO biological processes: Top 15 enriched GO BP terms are showed in the bar plot of each disease state in each tissue. Each row represents a significant GO biological process which is colored according to the -log10(p.adjust).
ColorectumFAPGO analysis - Figure of enriched GO biological processes: Top 15 enriched GO BP terms are showed in the bar plot of each disease state in each tissue. Each row represents a significant GO biological process which is colored according to the -log10(p.adjust).
∗Top 15 enriched GO BP terms are showed in the bar plot of each disease state in each tissue. Each row represents a significant GO biological process which is colored according to the -log10(p.adjust).
Page: 1 2 3 4 5 6 7 8 9 

check button Enriched GO biological processes.
GO IDTissueDisease StageDescriptionGene RatioBg Ratiopvaluep.adjustCount
GO:19038443LiverNAFLDregulation of cellular response to transforming growth factor beta stimulus23/1882131/187235.62e-034.29e-0223
GO:00064731LiverCirrhoticprotein acetylation84/4634201/187237.50e-082.25e-0684
GO:00183941LiverCirrhoticpeptidyl-lysine acetylation73/4634169/187231.08e-073.07e-0673
GO:00435431LiverCirrhoticprotein acylation95/4634243/187234.73e-071.07e-0595
GO:00182051LiverCirrhoticpeptidyl-lysine modification134/4634376/187231.29e-062.59e-05134
GO:007155911LiverCirrhoticresponse to transforming growth factor beta96/4634256/187233.55e-066.09e-0596
GO:00064751LiverCirrhoticinternal protein amino acid acetylation65/4634160/187236.66e-061.04e-0465
GO:007156011LiverCirrhoticcellular response to transforming growth factor beta stimulus93/4634250/187237.34e-061.13e-0493
GO:00183931LiverCirrhoticinternal peptidyl-lysine acetylation64/4634158/187238.75e-061.29e-0464
GO:001657011LiverCirrhotichistone modification154/4634463/187231.92e-052.57e-04154
GO:00165731LiverCirrhotichistone acetylation61/4634152/187231.97e-052.62e-0461
GO:2000756LiverCirrhoticregulation of peptidyl-lysine acetylation30/463463/187236.83e-057.74e-0430
GO:003105611LiverCirrhoticregulation of histone modification59/4634152/187238.28e-059.02e-0459
GO:1901983LiverCirrhoticregulation of protein acetylation34/463477/187231.53e-041.46e-0334
GO:000717911LiverCirrhotictransforming growth factor beta receptor signaling pathway71/4634198/187233.02e-042.65e-0371
GO:19019841LiverCirrhoticnegative regulation of protein acetylation13/463424/187231.89e-031.19e-0213
GO:0006367LiverCirrhotictranscription initiation from RNA polymerase II promoter31/463477/187231.91e-031.20e-0231
GO:190384411LiverCirrhoticregulation of cellular response to transforming growth factor beta stimulus47/4634131/187232.87e-031.65e-0247
GO:000717811LiverCirrhotictransmembrane receptor protein serine/threonine kinase signaling pathway111/4634355/187232.98e-031.70e-02111
GO:0035065LiverCirrhoticregulation of histone acetylation23/463454/187233.02e-031.72e-0223
Page: 1 2 3 4 5 6 7 8 9 10 11 12 13 14 15 

check button Enriched KEGG pathways.
Pathway IDTissueDisease StageDescriptionGene RatioBg Ratiopvaluep.adjustqvalueCount
Page: 1 

Top

Cell-cell communication analysis

check buttonIdentification of potential cell-cell interactions between two cell types and their ligand-receptor pairs for different disease states
LigandReceptorLRpairPathwayTissueDisease Stage
Page: 1 

Top

Single-cell gene regulatory network inference analysis

check buttonFind out the significant the regulons (TFs) and the target genes of each regulon across cell types for different disease states
TFCell TypeTissueDisease StageTarget GeneRSSRegulon Activity
∗The dot plots of a searched regulon are shown for all cell subpopulations in each disease state of each tissue based on the regulon specific score inferred using pySCENIC and by calculating the average expression.
Page: 1 

Top

Somatic mutation of malignant transformation related genes

check buttonAnnotation of somatic variants for genes involved in malignant transformation
Hugo SymbolVariant ClassVariant ClassificationdbSNP RSHGVScHGVSpHGVSp ShortSWISSPROTBIOTYPESIFTPolyPhenTumor Sample BarcodeTissueHistologySexAgeStageTherapy TypesDrugsOutcome
ZNF451SNVMissense_Mutationrs750718545c.2891N>Ap.Arg964Hisp.R964HQ9Y4E5protein_codingdeleterious(0)probably_damaging(0.997)TCGA-B6-A1KI-01Breastbreast invasive carcinomaFemale<65I/IIUnknownUnknownSD
ZNF451SNVMissense_Mutationnovelc.992N>Tp.Thr331Ilep.T331IQ9Y4E5protein_codingdeleterious(0)possibly_damaging(0.845)TCGA-BH-A0HF-01Breastbreast invasive carcinomaFemale>=65I/IIHormone TherapyarimidexSD
ZNF451SNVMissense_Mutationnovelc.1715N>Tp.Pro572Leup.P572LQ9Y4E5protein_codingdeleterious(0.02)benign(0.322)TCGA-BH-A0HF-01Breastbreast invasive carcinomaFemale>=65I/IIHormone TherapyarimidexSD
ZNF451SNVMissense_Mutationc.2824N>Cp.Phe942Leup.F942LQ9Y4E5protein_codingdeleterious(0)probably_damaging(0.971)TCGA-BH-A18G-01Breastbreast invasive carcinomaFemale>=65I/IIUnknownUnknownSD
ZNF451SNVMissense_Mutationc.1215N>Ap.Ser405Argp.S405RQ9Y4E5protein_codingtolerated(0.14)benign(0.06)TCGA-D8-A1JE-01Breastbreast invasive carcinomaFemale<65I/IIChemotherapyadriamicinSD
ZNF451SNVMissense_Mutationc.877N>Tp.Pro293Serp.P293SQ9Y4E5protein_codingdeleterious(0)probably_damaging(0.998)TCGA-E9-A1RH-01Breastbreast invasive carcinomaFemale<65I/IIChemotherapy5-fluorouracilSD
ZNF451insertionFrame_Shift_Insnovelc.1829_1830insAGGCAGAAGAGCCp.Cys611GlyfsTer6p.C611Gfs*6Q9Y4E5protein_codingTCGA-B6-A0IA-01Breastbreast invasive carcinomaFemale<65I/IIUnknownUnknownSD
ZNF451SNVMissense_Mutationnovelc.2642A>Gp.Tyr881Cysp.Y881CQ9Y4E5protein_codingdeleterious_low_confidence(0)possibly_damaging(0.635)TCGA-5M-AAT6-01Colorectumcolon adenocarcinomaFemale<65III/IVUnknownUnknownPD
ZNF451SNVMissense_Mutationc.899N>Tp.Ala300Valp.A300VQ9Y4E5protein_codingtolerated(0.12)probably_damaging(0.971)TCGA-A6-6141-01Colorectumcolon adenocarcinomaMale<65I/IIChemotherapy5-fuSD
ZNF451SNVMissense_Mutationnovelc.1910N>Cp.Ser637Thrp.S637TQ9Y4E5protein_codingtolerated(0.31)benign(0.084)TCGA-AA-3845-01Colorectumcolon adenocarcinomaFemale>=65I/IIUnknownUnknownPD
Page: 1 2 3 4 5 6 7 8 9 10 11 12 

Top

Related drugs of malignant transformation related genes

check buttonIdentification of chemicals and drugs interact with genes involved in malignant transfromation
(DGIdb 4.0)
Entrez IDSymbolCategoryInteraction TypesDrug Claim NameDrug NamePMIDs
Page: 1