Schematic overview of the cellular and molecular mechanisms involved in the cancer progression, including the proposed cellular and molecular mechanisms in cancer cells trajectory. AT1: alveolar type 1 cells; AT2: alveolar type 2 cells; AAH: atypical adenomatous hyperplasia; AIS: adenocarcinoma in situ; MIA: minimally invasive adenocarcinoma; IA: invasive adenocarcinoma; EMT: epithelial-mesenchymal transition

Home

Download

Statistics

Help

Contact

Center for Computational Systems Medicine
leaf

Gene summary

leaf

Malignant transformation analysis

leaf

Malignant transformation related pathway analysis

leaf

Cell-cell communication analysis

leaf

Single-cell gene regulatory network inference analysis

leaf

Somatic mutation of malignant transformation related genes

leaf

Related drugs of malignant transformation related genes

Gene: ZC3H18

Gene summary for ZC3H18

check button Gene summary.

Gene informationSpeciesHuman
Gene symbol

ZC3H18

Gene ID

124245

Gene namezinc finger CCCH-type containing 18
Gene AliasNHN1
Cytomap16q24.2
Gene Typeprotein-coding
GO ID

GO:0006139

UniProtAcc

B4DTK7


Top

Malignant transformation analysis

check button Identification of the aberrant gene expression in precancerous and cancerous lesions by comparing the gene expression of stem-like cells in diseased tissues with normal stem cells
check button Malignant transformation involving gene list.
Entrez IDSymbolReplicatesSpeciesOrganTissueAdj P-valueLog2FCMalignancy
124245ZC3H18LZE4THumanEsophagusESCC2.67e-062.97e-010.0811
124245ZC3H18LZE7THumanEsophagusESCC1.49e-063.78e-010.0667
124245ZC3H18LZE8THumanEsophagusESCC7.56e-041.28e-010.067
124245ZC3H18LZE22THumanEsophagusESCC2.08e-053.31e-010.068
124245ZC3H18LZE24THumanEsophagusESCC2.90e-152.52e-010.0596
124245ZC3H18LZE21THumanEsophagusESCC3.19e-031.93e-010.0655
124245ZC3H18P1T-EHumanEsophagusESCC1.83e-106.13e-010.0875
124245ZC3H18P2T-EHumanEsophagusESCC4.07e-224.64e-010.1177
124245ZC3H18P4T-EHumanEsophagusESCC6.44e-102.56e-010.1323
124245ZC3H18P5T-EHumanEsophagusESCC2.49e-122.19e-010.1327
124245ZC3H18P8T-EHumanEsophagusESCC3.10e-173.68e-010.0889
124245ZC3H18P9T-EHumanEsophagusESCC2.35e-061.57e-010.1131
124245ZC3H18P10T-EHumanEsophagusESCC1.46e-203.85e-010.116
124245ZC3H18P11T-EHumanEsophagusESCC7.78e-093.31e-010.1426
124245ZC3H18P12T-EHumanEsophagusESCC2.45e-204.59e-010.1122
124245ZC3H18P15T-EHumanEsophagusESCC2.36e-194.20e-010.1149
124245ZC3H18P16T-EHumanEsophagusESCC1.20e-132.39e-010.1153
124245ZC3H18P17T-EHumanEsophagusESCC2.20e-042.60e-010.1278
124245ZC3H18P19T-EHumanEsophagusESCC1.57e-022.31e-010.1662
124245ZC3H18P20T-EHumanEsophagusESCC2.16e-123.23e-010.1124
Page: 1 2 3 4 5 

check button Transcriptomic changes along malignancy continuum.
TissueExpression DynamicsAbbreviation
EsophagusThe image shows the transcriptomic changes along malignancy continuum.log2FC in expression of this searched gene in stem-like cells from each diseased tissue sample relative to stem-like cells in normal samples in each tissue plotted against the malignancy continuum. Samples are colored based on if they are from different disease stage.
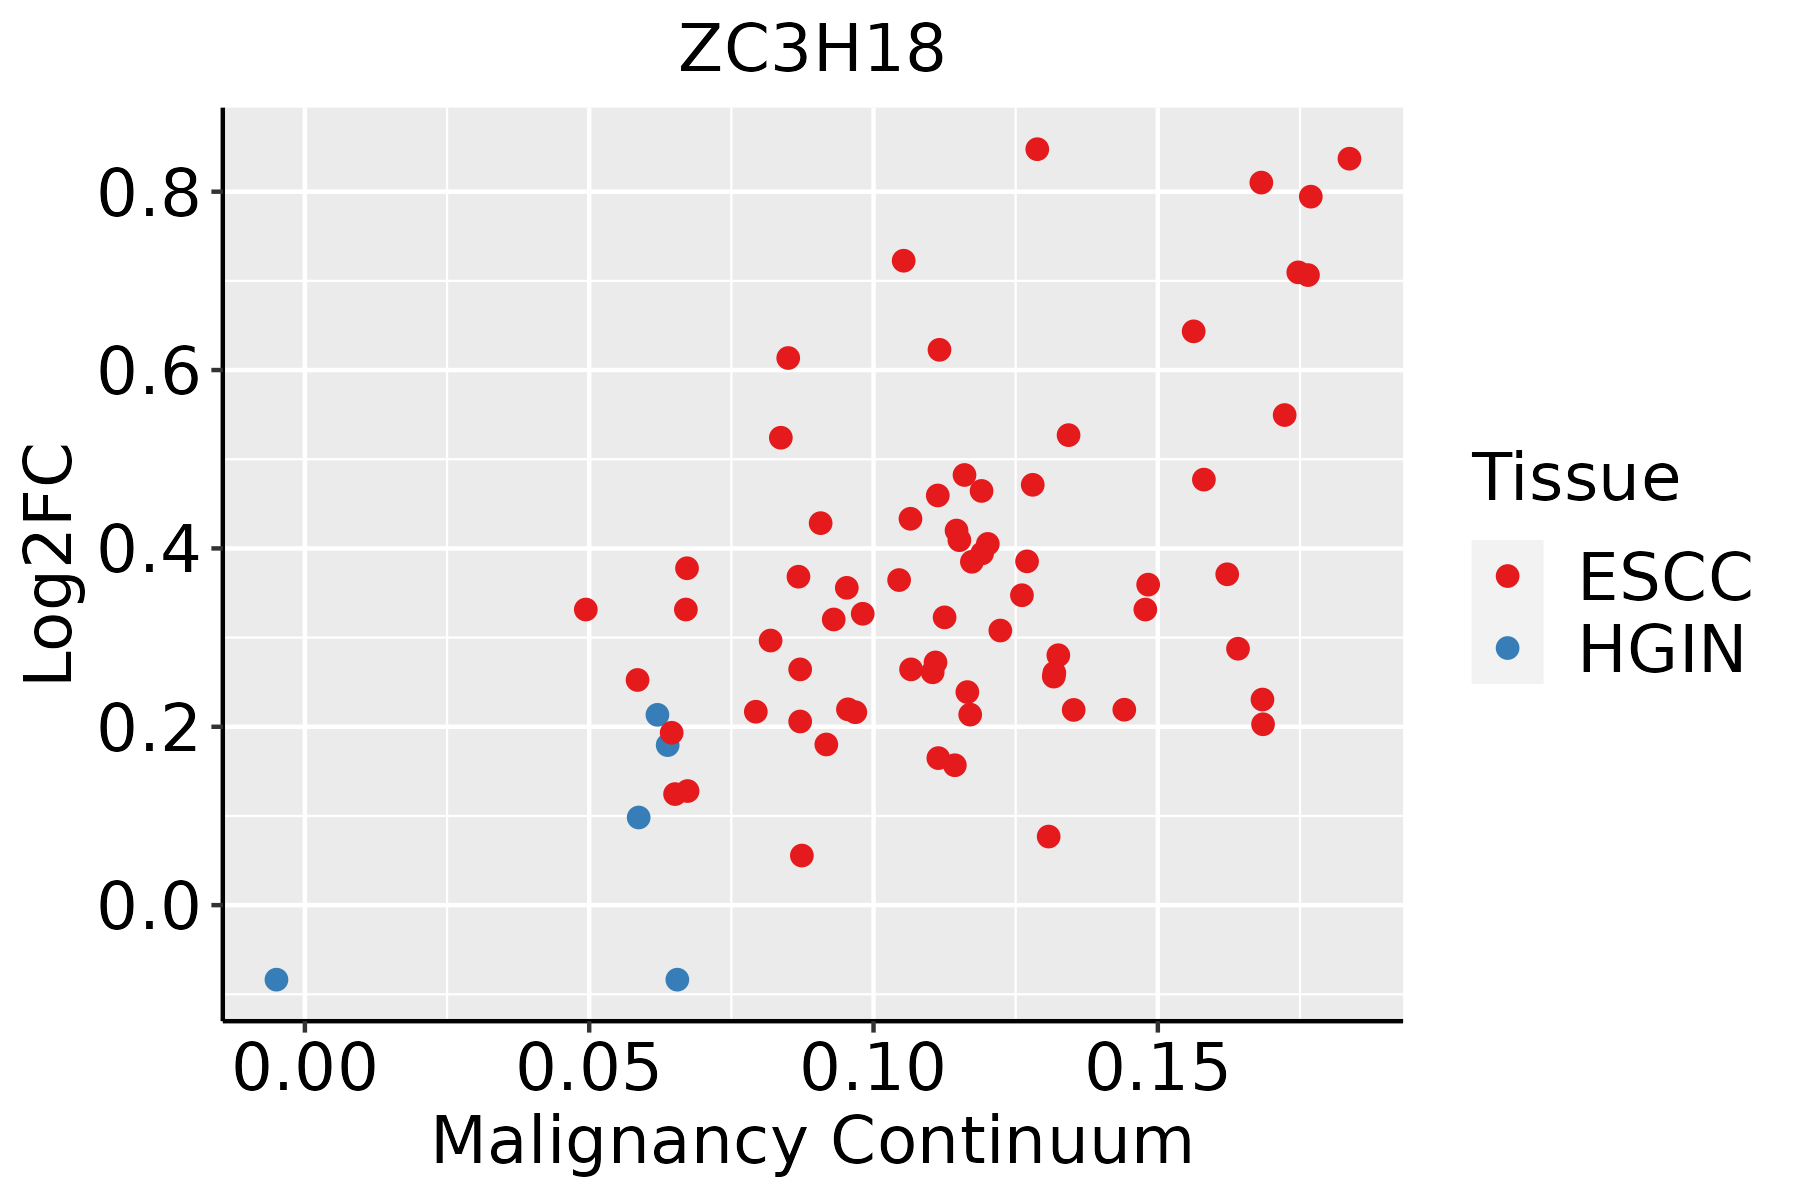
ESCC: Esophageal squamous cell carcinoma
HGIN: High-grade intraepithelial neoplasias
LGIN: Low-grade intraepithelial neoplasias
LiverThe image shows the transcriptomic changes along malignancy continuum.log2FC in expression of this searched gene in stem-like cells from each diseased tissue sample relative to stem-like cells in normal samples in each tissue plotted against the malignancy continuum. Samples are colored based on if they are from different disease stage.
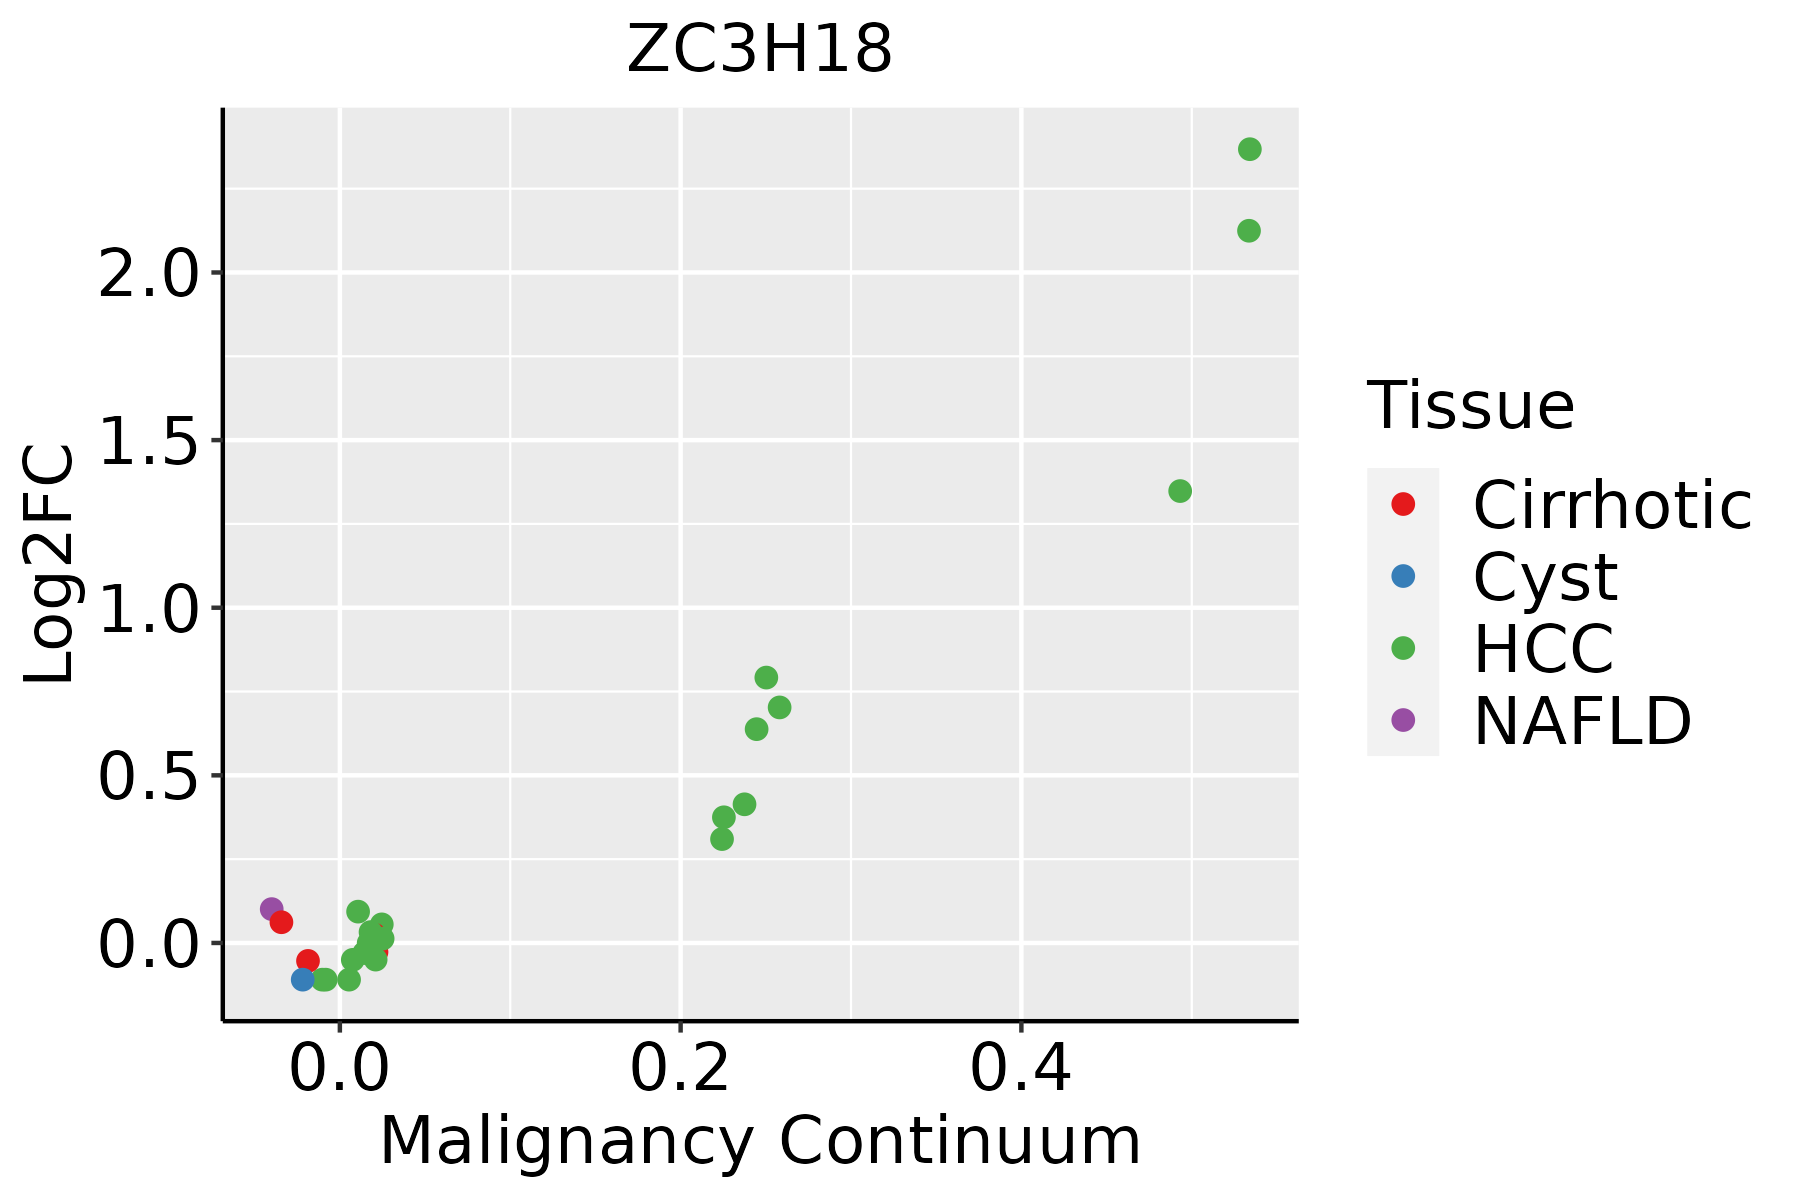
HCC: Hepatocellular carcinoma
NAFLD: Non-alcoholic fatty liver disease
Oral CavityThe image shows the transcriptomic changes along malignancy continuum.log2FC in expression of this searched gene in stem-like cells from each diseased tissue sample relative to stem-like cells in normal samples in each tissue plotted against the malignancy continuum. Samples are colored based on if they are from different disease stage.EOLP: Erosive Oral lichen planus
LP: leukoplakia
NEOLP: Non-erosive oral lichen planus
OSCC: Oral squamous cell carcinoma
ThyroidThe image shows the transcriptomic changes along malignancy continuum.log2FC in expression of this searched gene in stem-like cells from each diseased tissue sample relative to stem-like cells in normal samples in each tissue plotted against the malignancy continuum. Samples are colored based on if they are from different disease stage.
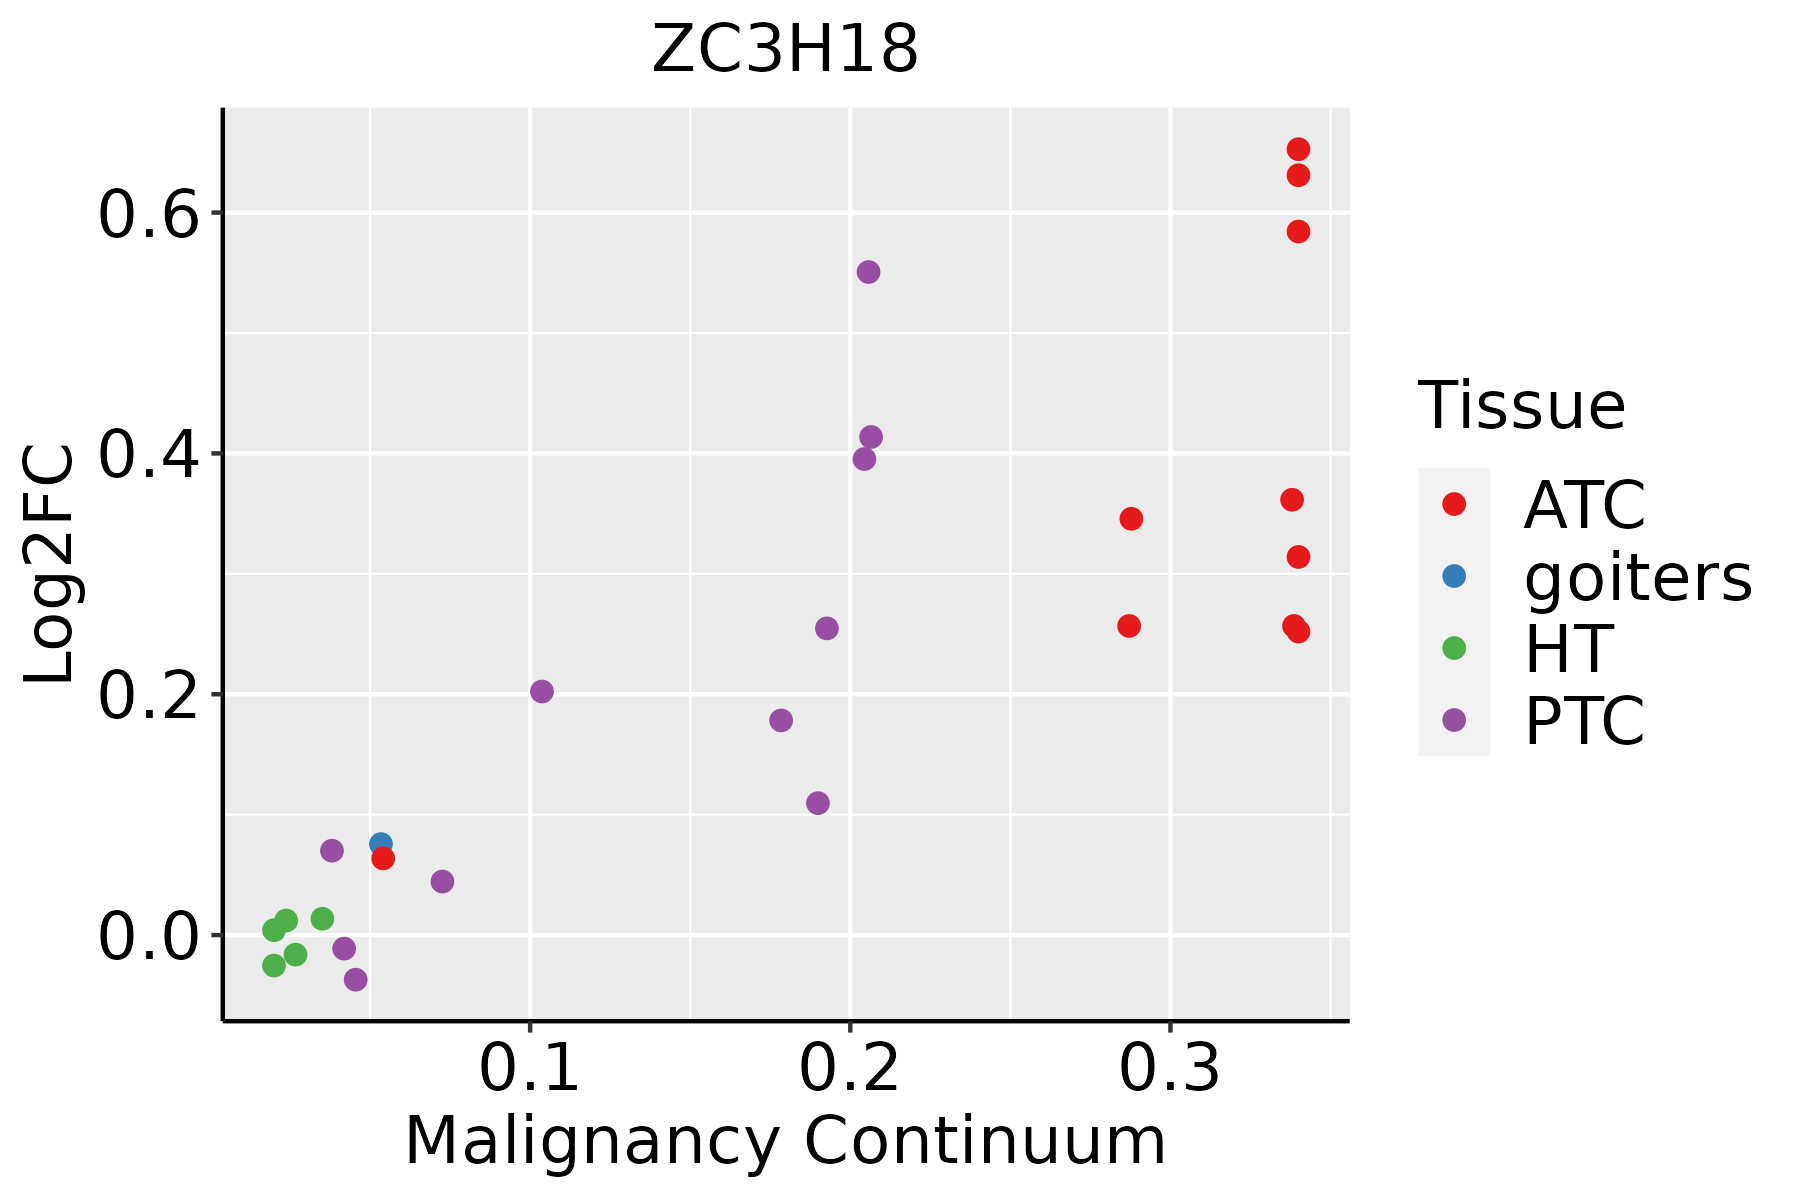
ATC: Anaplastic thyroid cancer
HT: Hashimoto's thyroiditis
PTC: Papillary thyroid cancer
∗log2FC in expression of this searched gene in stem-like cells from each diseased tissue sample relative to stem-like cells in normal samples in each tissue plotted against the malignancy continuum. Samples are colored based on if they are from different disease stage.

Top

Malignant transformation related pathway analysis

check buttonFind out the enriched GO biological processes and KEGG pathways involved in transition from healthy to precancer to cancer
check button Figure of enriched GO biological processes.
TissueDisease StageEnriched GO biological Processes
ColorectumADGO analysis - Figure of enriched GO biological processes: Top 15 enriched GO BP terms are showed in the bar plot of each disease state in each tissue. Each row represents a significant GO biological process which is colored according to the -log10(p.adjust).
ColorectumSERGO analysis - Figure of enriched GO biological processes: Top 15 enriched GO BP terms are showed in the bar plot of each disease state in each tissue. Each row represents a significant GO biological process which is colored according to the -log10(p.adjust).
ColorectumMSSGO analysis - Figure of enriched GO biological processes: Top 15 enriched GO BP terms are showed in the bar plot of each disease state in each tissue. Each row represents a significant GO biological process which is colored according to the -log10(p.adjust).
ColorectumMSI-HGO analysis - Figure of enriched GO biological processes: Top 15 enriched GO BP terms are showed in the bar plot of each disease state in each tissue. Each row represents a significant GO biological process which is colored according to the -log10(p.adjust).
ColorectumFAPGO analysis - Figure of enriched GO biological processes: Top 15 enriched GO BP terms are showed in the bar plot of each disease state in each tissue. Each row represents a significant GO biological process which is colored according to the -log10(p.adjust).
∗Top 15 enriched GO BP terms are showed in the bar plot of each disease state in each tissue. Each row represents a significant GO biological process which is colored according to the -log10(p.adjust).
Page: 1 2 3 4 5 6 7 8 9 

check button Enriched GO biological processes.
GO IDTissueDisease StageDescriptionGene RatioBg Ratiopvaluep.adjustCount
GO:0009896113ThyroidPTCpositive regulation of catabolic process278/5968492/187233.35e-302.64e-27278
GO:0031331113ThyroidPTCpositive regulation of cellular catabolic process249/5968427/187235.28e-303.58e-27249
GO:0006401112ThyroidPTCRNA catabolic process163/5968278/187232.13e-203.27e-18163
GO:0034655112ThyroidPTCnucleobase-containing compound catabolic process211/5968407/187232.72e-172.52e-15211
GO:0046700111ThyroidPTCheterocycle catabolic process221/5968445/187232.43e-151.72e-13221
GO:0044270111ThyroidPTCcellular nitrogen compound catabolic process223/5968451/187233.34e-152.31e-13223
GO:0019439111ThyroidPTCaromatic compound catabolic process225/5968467/187238.51e-144.71e-12225
GO:1901361111ThyroidPTCorganic cyclic compound catabolic process231/5968495/187232.55e-121.12e-10231
GO:0043487111ThyroidPTCregulation of RNA stability97/5968170/187239.51e-123.97e-1097
GO:005077919ThyroidPTCRNA destabilization53/596888/187233.91e-088.51e-0753
GO:0009896210ThyroidATCpositive regulation of catabolic process290/6293492/187232.15e-311.94e-28290
GO:0031331210ThyroidATCpositive regulation of cellular catabolic process258/6293427/187232.09e-301.65e-27258
GO:000640127ThyroidATCRNA catabolic process165/6293278/187238.45e-191.14e-16165
GO:003465525ThyroidATCnucleobase-containing compound catabolic process217/6293407/187231.20e-161.04e-14217
GO:004670024ThyroidATCheterocycle catabolic process228/6293445/187237.26e-154.50e-13228
GO:004427025ThyroidATCcellular nitrogen compound catabolic process229/6293451/187232.25e-141.27e-12229
GO:001943924ThyroidATCaromatic compound catabolic process232/6293467/187233.05e-131.44e-11232
GO:190136124ThyroidATCorganic cyclic compound catabolic process238/6293495/187231.12e-114.12e-10238
GO:004348725ThyroidATCregulation of RNA stability97/6293170/187232.68e-107.70e-0997
GO:0050779110ThyroidATCRNA destabilization53/629388/187232.75e-074.20e-0653
Page: 1 2 3 

check button Enriched KEGG pathways.
Pathway IDTissueDisease StageDescriptionGene RatioBg Ratiopvaluep.adjustqvalueCount
Page: 1 

Top

Cell-cell communication analysis

check buttonIdentification of potential cell-cell interactions between two cell types and their ligand-receptor pairs for different disease states
LigandReceptorLRpairPathwayTissueDisease Stage
Page: 1 

Top

Single-cell gene regulatory network inference analysis

check buttonFind out the significant the regulons (TFs) and the target genes of each regulon across cell types for different disease states
TFCell TypeTissueDisease StageTarget GeneRSSRegulon Activity
∗The dot plots of a searched regulon are shown for all cell subpopulations in each disease state of each tissue based on the regulon specific score inferred using pySCENIC and by calculating the average expression.
Page: 1 

Top

Somatic mutation of malignant transformation related genes

check buttonAnnotation of somatic variants for genes involved in malignant transformation
Hugo SymbolVariant ClassVariant ClassificationdbSNP RSHGVScHGVSpHGVSp ShortSWISSPROTBIOTYPESIFTPolyPhenTumor Sample BarcodeTissueHistologySexAgeStageTherapy TypesDrugsOutcome
ZC3H18SNVMissense_Mutationnovelc.1645N>Tp.Pro549Serp.P549Sprotein_codingdeleterious_low_confidence(0)probably_damaging(0.998)TCGA-A2-A3XW-01Breastbreast invasive carcinomaFemale<65I/IIChemotherapyadriamyicinCR
ZC3H18SNVMissense_Mutationnovelc.2774N>Gp.Lys925Argp.K925Rprotein_codingdeleterious_low_confidence(0.03)probably_damaging(0.991)TCGA-BH-A0B7-01Breastbreast invasive carcinomaFemale<65I/IIChemotherapyadriamycinCR
ZC3H18SNVMissense_Mutationrs749335369c.2657N>Tp.Ser886Leup.S886Lprotein_codingdeleterious_low_confidence(0.01)possibly_damaging(0.725)TCGA-BH-A0HF-01Breastbreast invasive carcinomaFemale>=65I/IIHormone TherapyarimidexSD
ZC3H18insertionFrame_Shift_Insnovelc.1480_1481insTTCATGTCTCTCAGGCATCTCCCCATTCACATGCTTCATGTCAGp.Arg494LeufsTer55p.R494Lfs*55protein_codingTCGA-AO-A0J5-01Breastbreast invasive carcinomaFemale<65III/IVOther, specify in notesBisphosphonatezoledronicPD
ZC3H18insertionIn_Frame_Insnovelc.2306_2307insAGCAGCATATGGGCAGGGCAGACTCAGGTGCCAGTCCTGTGTp.Arg769_Ser770insAlaAlaTyrGlyGlnGlyArgLeuArgCysGlnSerCysValp.R769_S770insAAYGQGRLRCQSCVprotein_codingTCGA-BH-A0H7-01Breastbreast invasive carcinomaFemale>=65III/IVChemotherapydoxorubicinSD
ZC3H18SNVMissense_Mutationnovelc.1696C>Tp.Arg566Trpp.R566Wprotein_codingdeleterious_low_confidence(0)probably_damaging(0.984)TCGA-2W-A8YY-01Cervixcervical & endocervical cancerFemale<65I/IIChemotherapycisplatinCR
ZC3H18SNVMissense_Mutationnovelc.2908C>Tp.Arg970Trpp.R970Wprotein_codingdeleterious_low_confidence(0)probably_damaging(0.997)TCGA-2W-A8YY-01Cervixcervical & endocervical cancerFemale<65I/IIChemotherapycisplatinCR
ZC3H18SNVMissense_Mutationrs267604676c.1133G>Ap.Arg378Glnp.R378Qprotein_codingtolerated_low_confidence(0.05)possibly_damaging(0.67)TCGA-FU-A3TQ-01Cervixcervical & endocervical cancerFemale<65III/IVUnknownUnknownSD
ZC3H18SNVMissense_Mutationc.2752N>Tp.Pro918Serp.P918Sprotein_codingdeleterious_low_confidence(0.05)probably_damaging(0.998)TCGA-JX-A3Q0-01Cervixcervical & endocervical cancerFemale<65III/IVUnknownUnknownSD
ZC3H18SNVMissense_Mutationrs201777324c.1550N>Ap.Arg517Hisp.R517Hprotein_codingdeleterious_low_confidence(0.01)probably_damaging(0.966)TCGA-LP-A7HU-01Cervixcervical & endocervical cancerFemale<65I/IIUnknownUnknownSD
Page: 1 2 3 4 5 6 7 8 9 10 11 12 13 

Top

Related drugs of malignant transformation related genes

check buttonIdentification of chemicals and drugs interact with genes involved in malignant transfromation
(DGIdb 4.0)
Entrez IDSymbolCategoryInteraction TypesDrug Claim NameDrug NamePMIDs
Page: 1