
|
|||||
|
 | |
| |
| |
| |
| |
| |
|
Gene: YWHAQ |
Gene summary for YWHAQ |
| Gene information | Species | Human | Gene symbol | YWHAQ | Gene ID | 10971 |
| Gene name | tyrosine 3-monooxygenase/tryptophan 5-monooxygenase activation protein theta | |
| Gene Alias | 14-3-3 | |
| Cytomap | 2p25.1 | |
| Gene Type | protein-coding | GO ID | GO:0006139 | UniProtAcc | P27348 |
Top |
Malignant transformation analysis |
| Identification of the aberrant gene expression in precancerous and cancerous lesions by comparing the gene expression of stem-like cells in diseased tissues with normal stem cells |
| Entrez ID | Symbol | Replicates | Species | Organ | Tissue | Adj P-value | Log2FC | Malignancy |
| 10971 | YWHAQ | GSM4909282 | Human | Breast | IDC | 6.83e-07 | 3.17e-01 | -0.0288 |
| 10971 | YWHAQ | GSM4909285 | Human | Breast | IDC | 7.63e-20 | 5.12e-01 | 0.21 |
| 10971 | YWHAQ | GSM4909286 | Human | Breast | IDC | 5.00e-02 | 7.17e-02 | 0.1081 |
| 10971 | YWHAQ | GSM4909294 | Human | Breast | IDC | 3.66e-05 | 4.81e-02 | 0.2022 |
| 10971 | YWHAQ | GSM4909296 | Human | Breast | IDC | 1.65e-28 | -5.26e-01 | 0.1524 |
| 10971 | YWHAQ | GSM4909297 | Human | Breast | IDC | 3.95e-23 | -1.63e-01 | 0.1517 |
| 10971 | YWHAQ | GSM4909301 | Human | Breast | IDC | 2.03e-09 | -4.22e-01 | 0.1577 |
| 10971 | YWHAQ | GSM4909302 | Human | Breast | IDC | 8.01e-09 | -5.09e-01 | 0.1545 |
| 10971 | YWHAQ | GSM4909304 | Human | Breast | IDC | 3.15e-06 | -4.02e-01 | 0.1636 |
| 10971 | YWHAQ | GSM4909311 | Human | Breast | IDC | 1.72e-52 | -5.92e-01 | 0.1534 |
| 10971 | YWHAQ | GSM4909312 | Human | Breast | IDC | 1.28e-16 | -1.57e-01 | 0.1552 |
| 10971 | YWHAQ | GSM4909318 | Human | Breast | IDC | 1.57e-05 | 2.36e-01 | 0.2031 |
| 10971 | YWHAQ | GSM4909319 | Human | Breast | IDC | 6.98e-50 | -6.39e-01 | 0.1563 |
| 10971 | YWHAQ | GSM4909320 | Human | Breast | IDC | 1.72e-09 | -5.79e-01 | 0.1575 |
| 10971 | YWHAQ | GSM4909321 | Human | Breast | IDC | 1.07e-21 | -2.89e-01 | 0.1559 |
| 10971 | YWHAQ | brca1 | Human | Breast | Precancer | 3.28e-14 | 4.24e-01 | -0.0338 |
| 10971 | YWHAQ | brca2 | Human | Breast | Precancer | 1.81e-09 | 3.23e-01 | -0.024 |
| 10971 | YWHAQ | brca3 | Human | Breast | Precancer | 2.68e-17 | 4.51e-01 | -0.0263 |
| 10971 | YWHAQ | M2 | Human | Breast | IDC | 4.26e-07 | 2.74e-01 | 0.21 |
| 10971 | YWHAQ | NCCBC14 | Human | Breast | DCIS | 4.40e-17 | -1.28e-03 | 0.2021 |
| Page: 1 2 3 4 5 6 7 8 9 10 11 12 13 |
| Tissue | Expression Dynamics | Abbreviation |
| Breast | 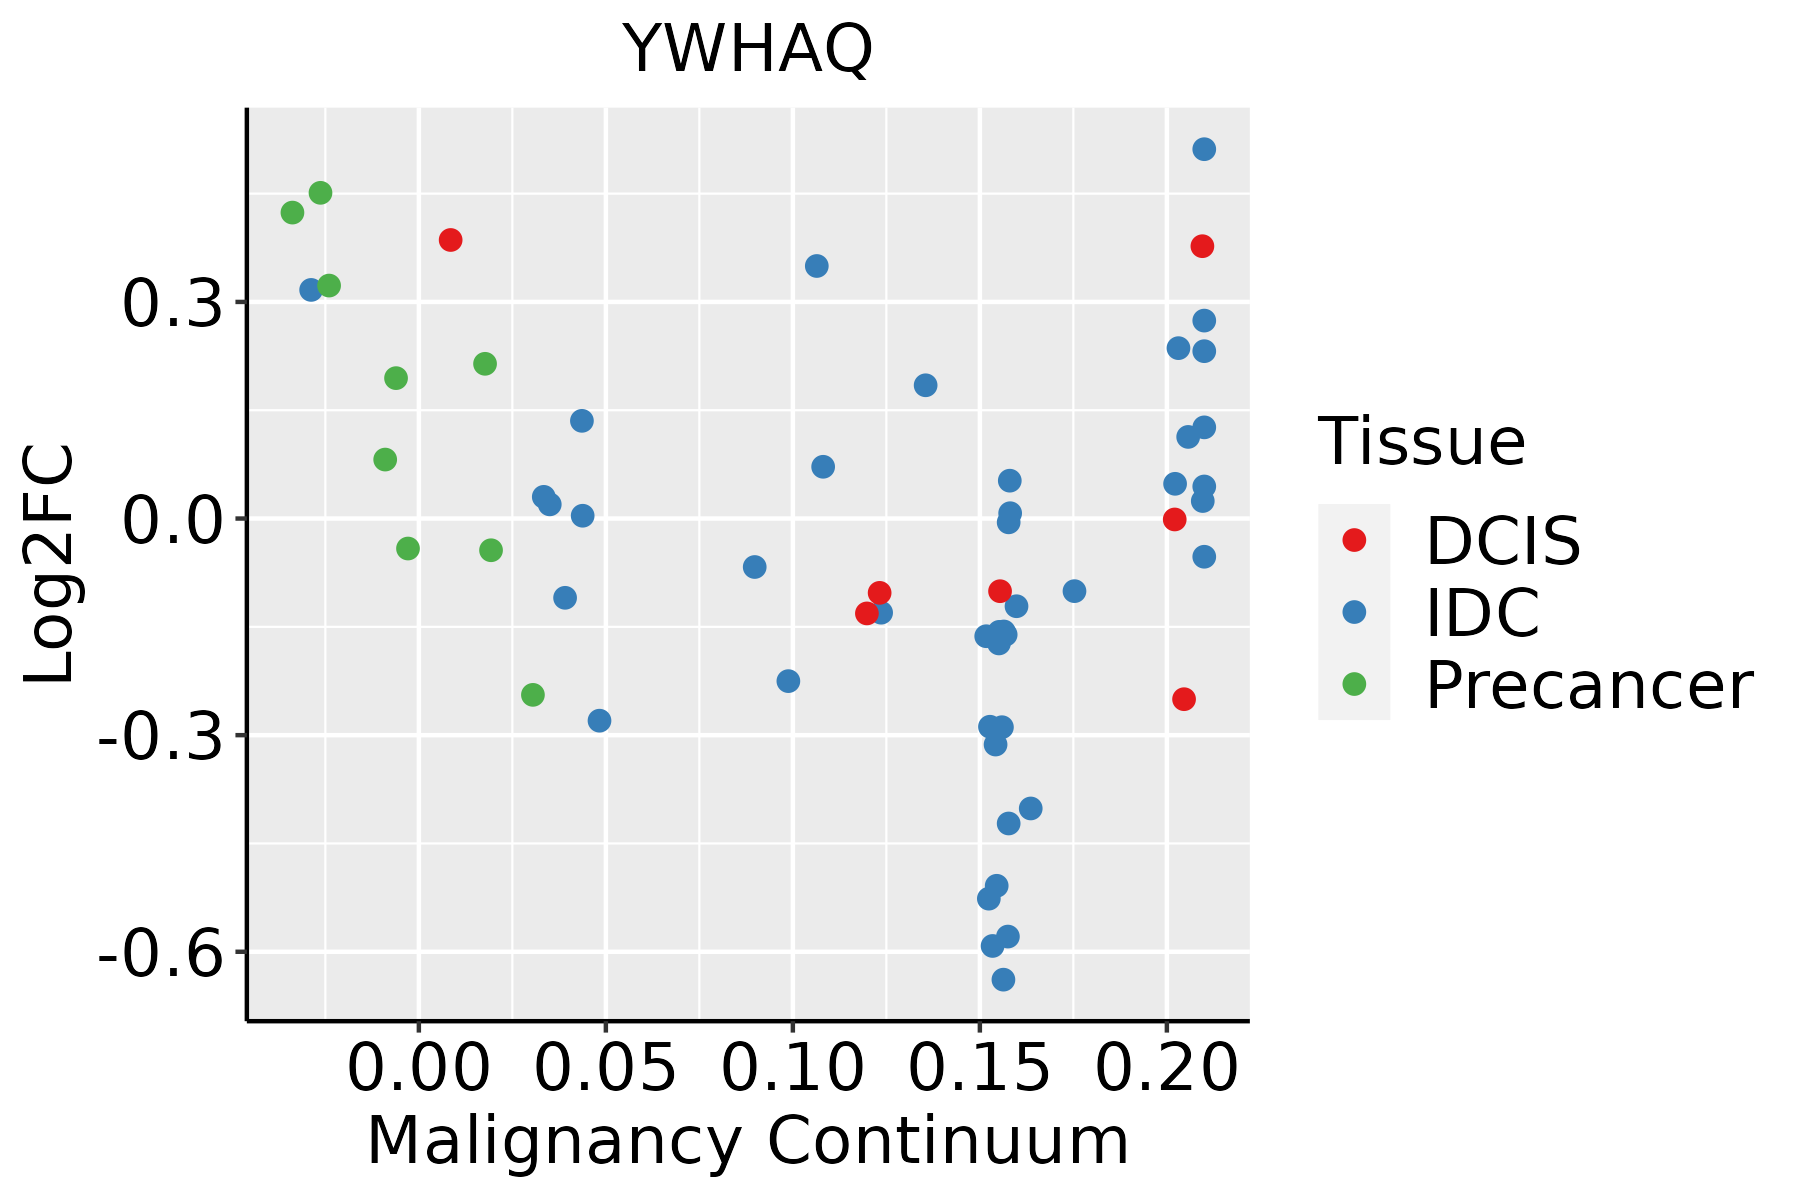 | IDC: Invasive ductal carcinoma |
| DCIS: Ductal carcinoma in situ | ||
| Precancer(BRCA1-mut): Precancerous lesion from BRCA1 mutation carriers | ||
| Cervix |  | CC: Cervix cancer |
| HSIL_HPV: HPV-infected high-grade squamous intraepithelial lesions | ||
| N_HPV: HPV-infected normal cervix | ||
| Colorectum (GSE201348) |  | FAP: Familial adenomatous polyposis |
| CRC: Colorectal cancer | ||
| Colorectum (HTA11) |  | AD: Adenomas |
| SER: Sessile serrated lesions | ||
| MSI-H: Microsatellite-high colorectal cancer | ||
| MSS: Microsatellite stable colorectal cancer | ||
| Endometrium | 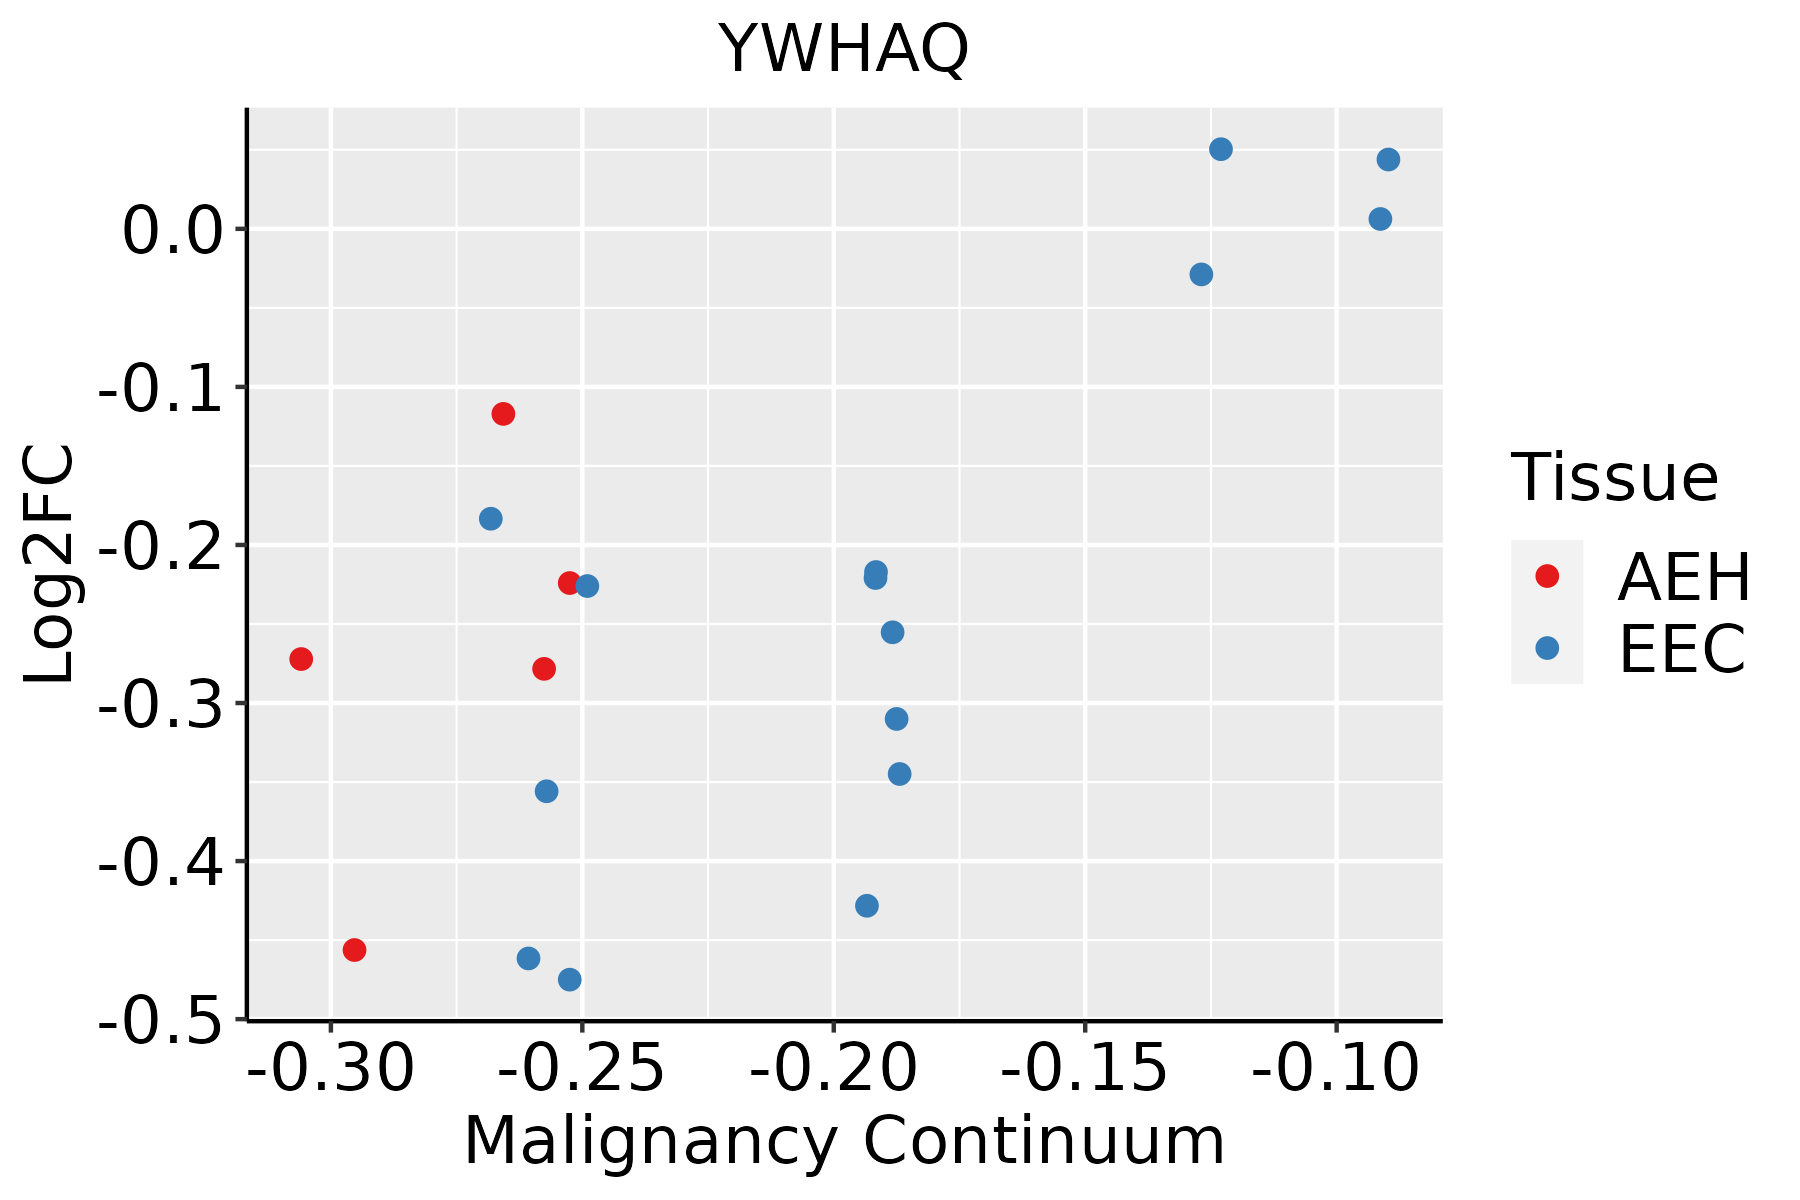 | AEH: Atypical endometrial hyperplasia |
| EEC: Endometrioid Cancer | ||
| Esophagus | 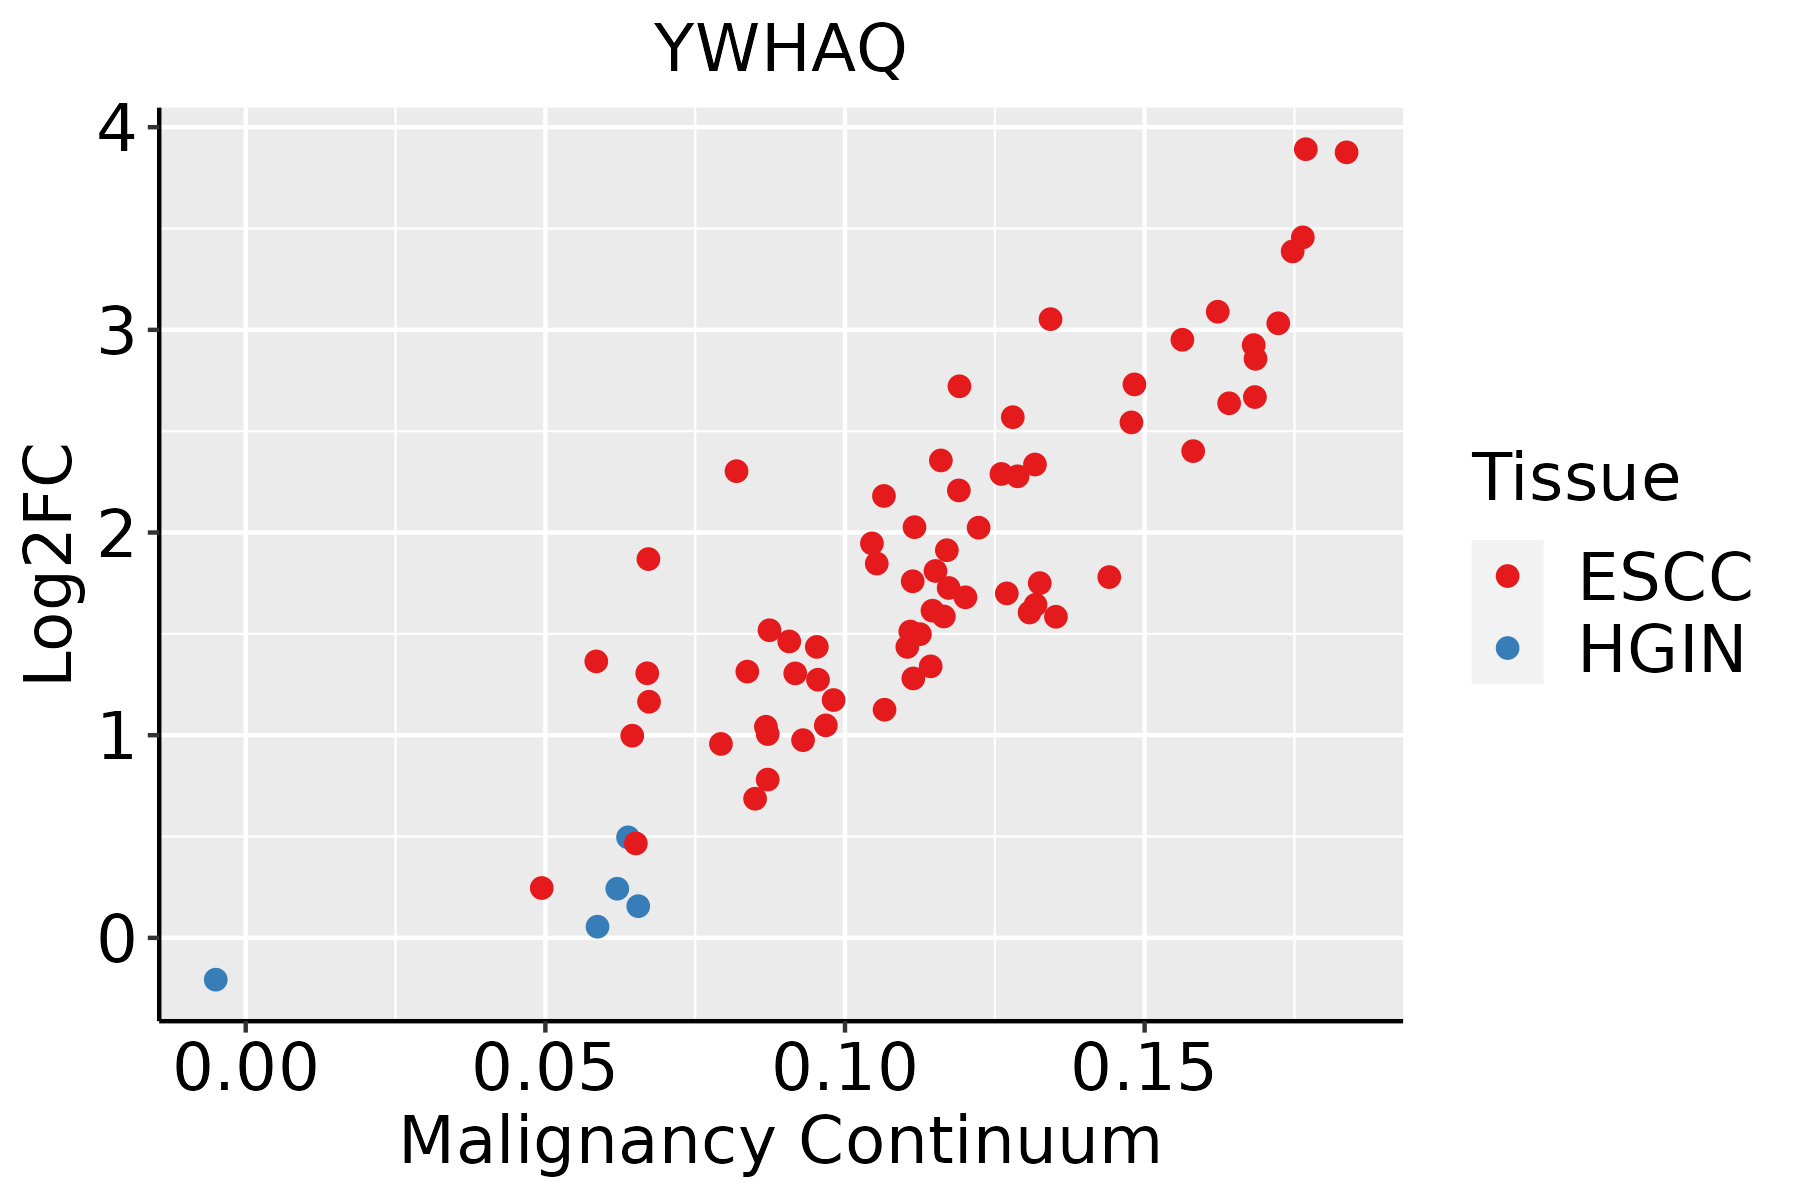 | ESCC: Esophageal squamous cell carcinoma |
| HGIN: High-grade intraepithelial neoplasias | ||
| LGIN: Low-grade intraepithelial neoplasias | ||
| Liver | 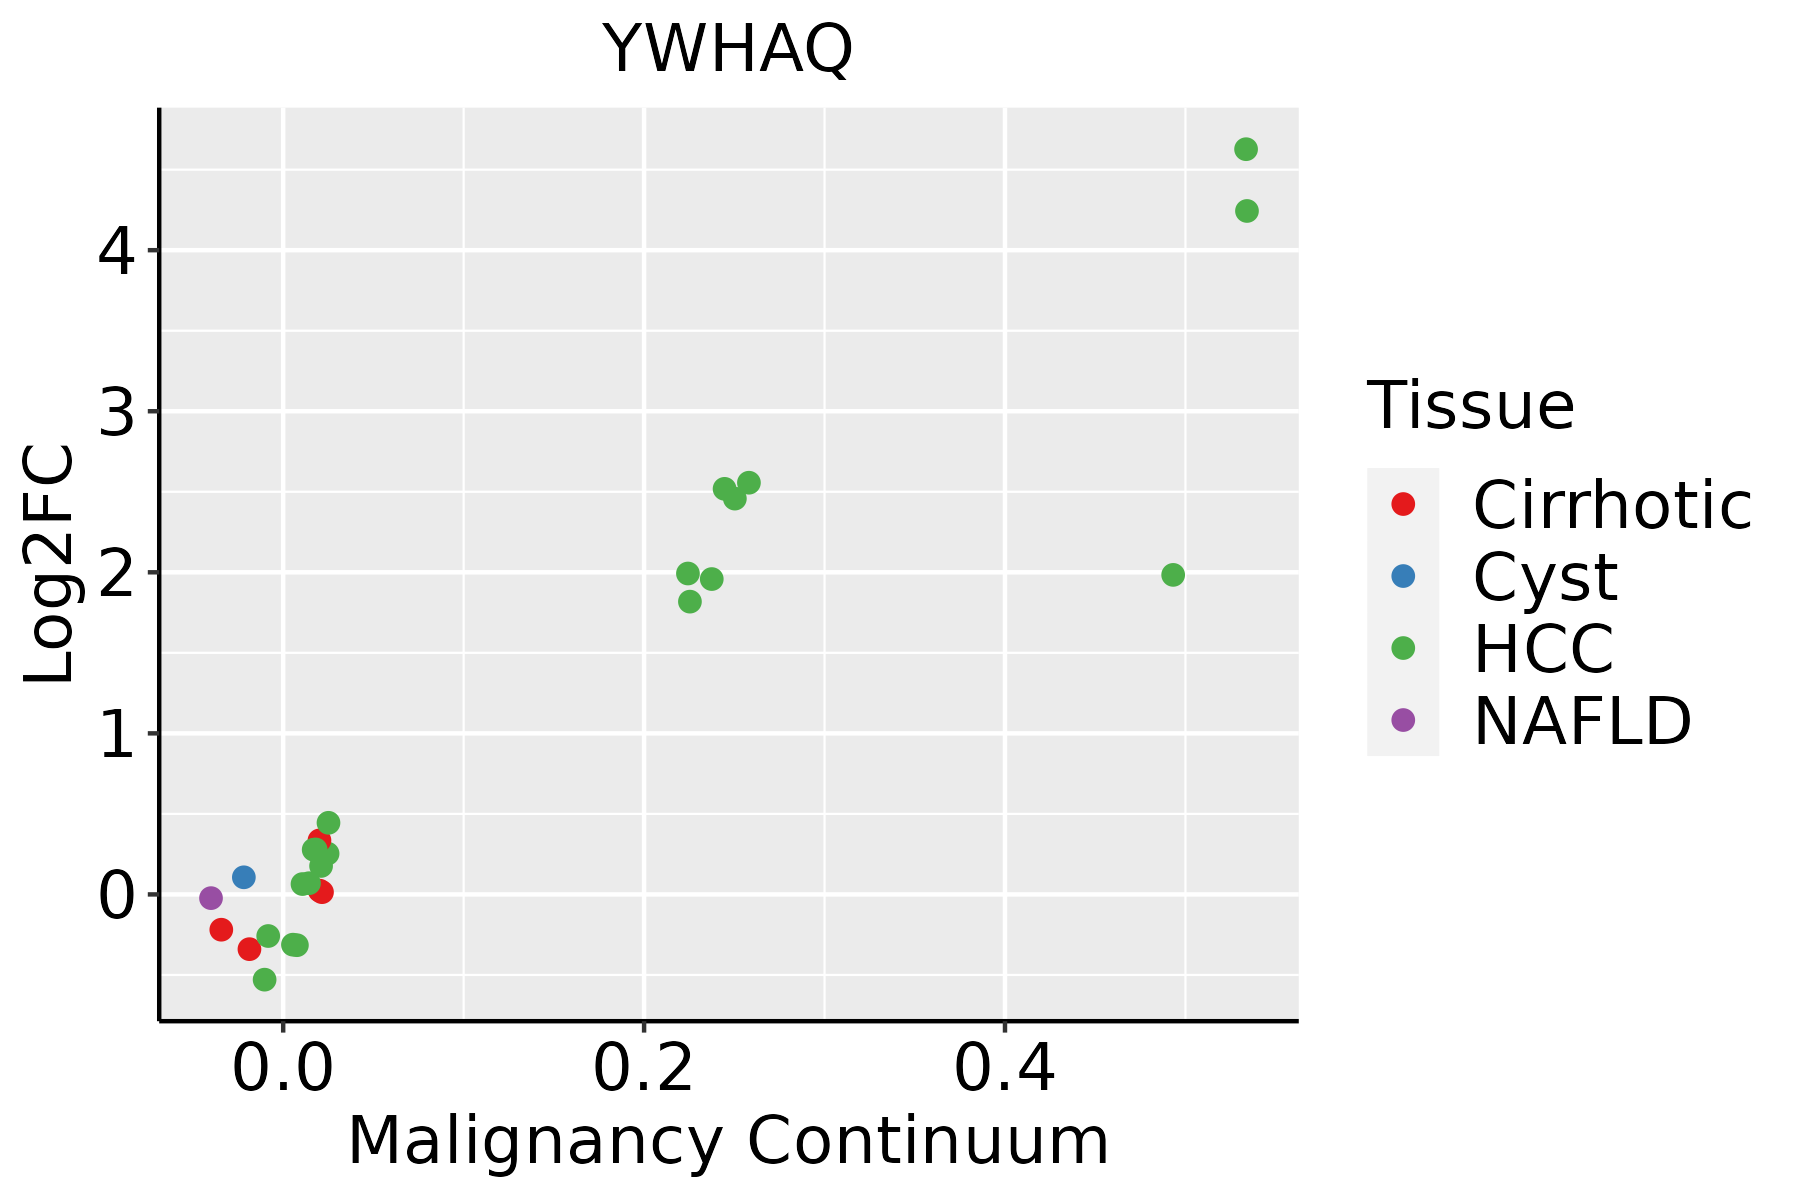 | HCC: Hepatocellular carcinoma |
| NAFLD: Non-alcoholic fatty liver disease | ||
| Lung |  | AAH: Atypical adenomatous hyperplasia |
| AIS: Adenocarcinoma in situ | ||
| IAC: Invasive lung adenocarcinoma | ||
| MIA: Minimally invasive adenocarcinoma | ||
| Oral Cavity |  | EOLP: Erosive Oral lichen planus |
| LP: leukoplakia | ||
| NEOLP: Non-erosive oral lichen planus | ||
| OSCC: Oral squamous cell carcinoma | ||
| Prostate | 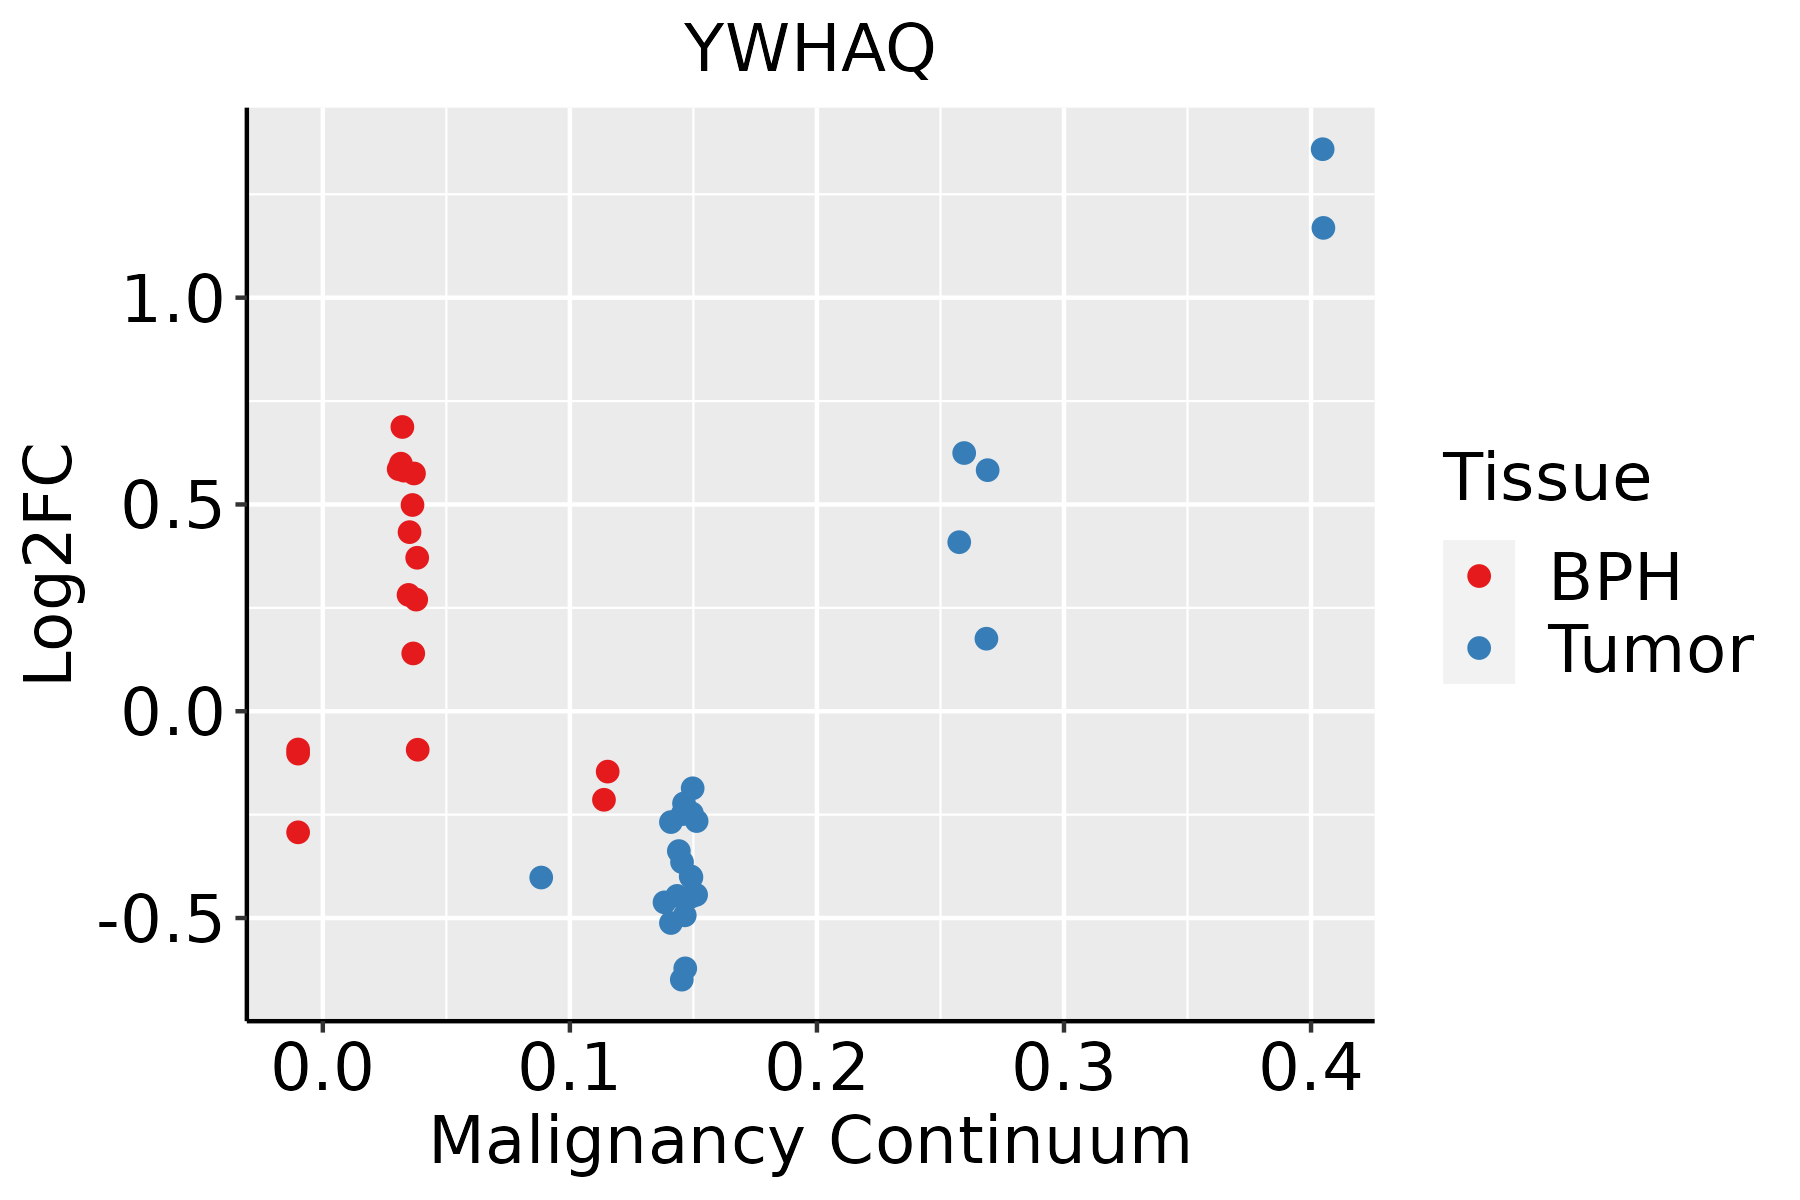 | BPH: Benign Prostatic Hyperplasia |
| Skin |  | AK: Actinic keratosis |
| cSCC: Cutaneous squamous cell carcinoma | ||
| SCCIS:squamous cell carcinoma in situ | ||
| Thyroid | 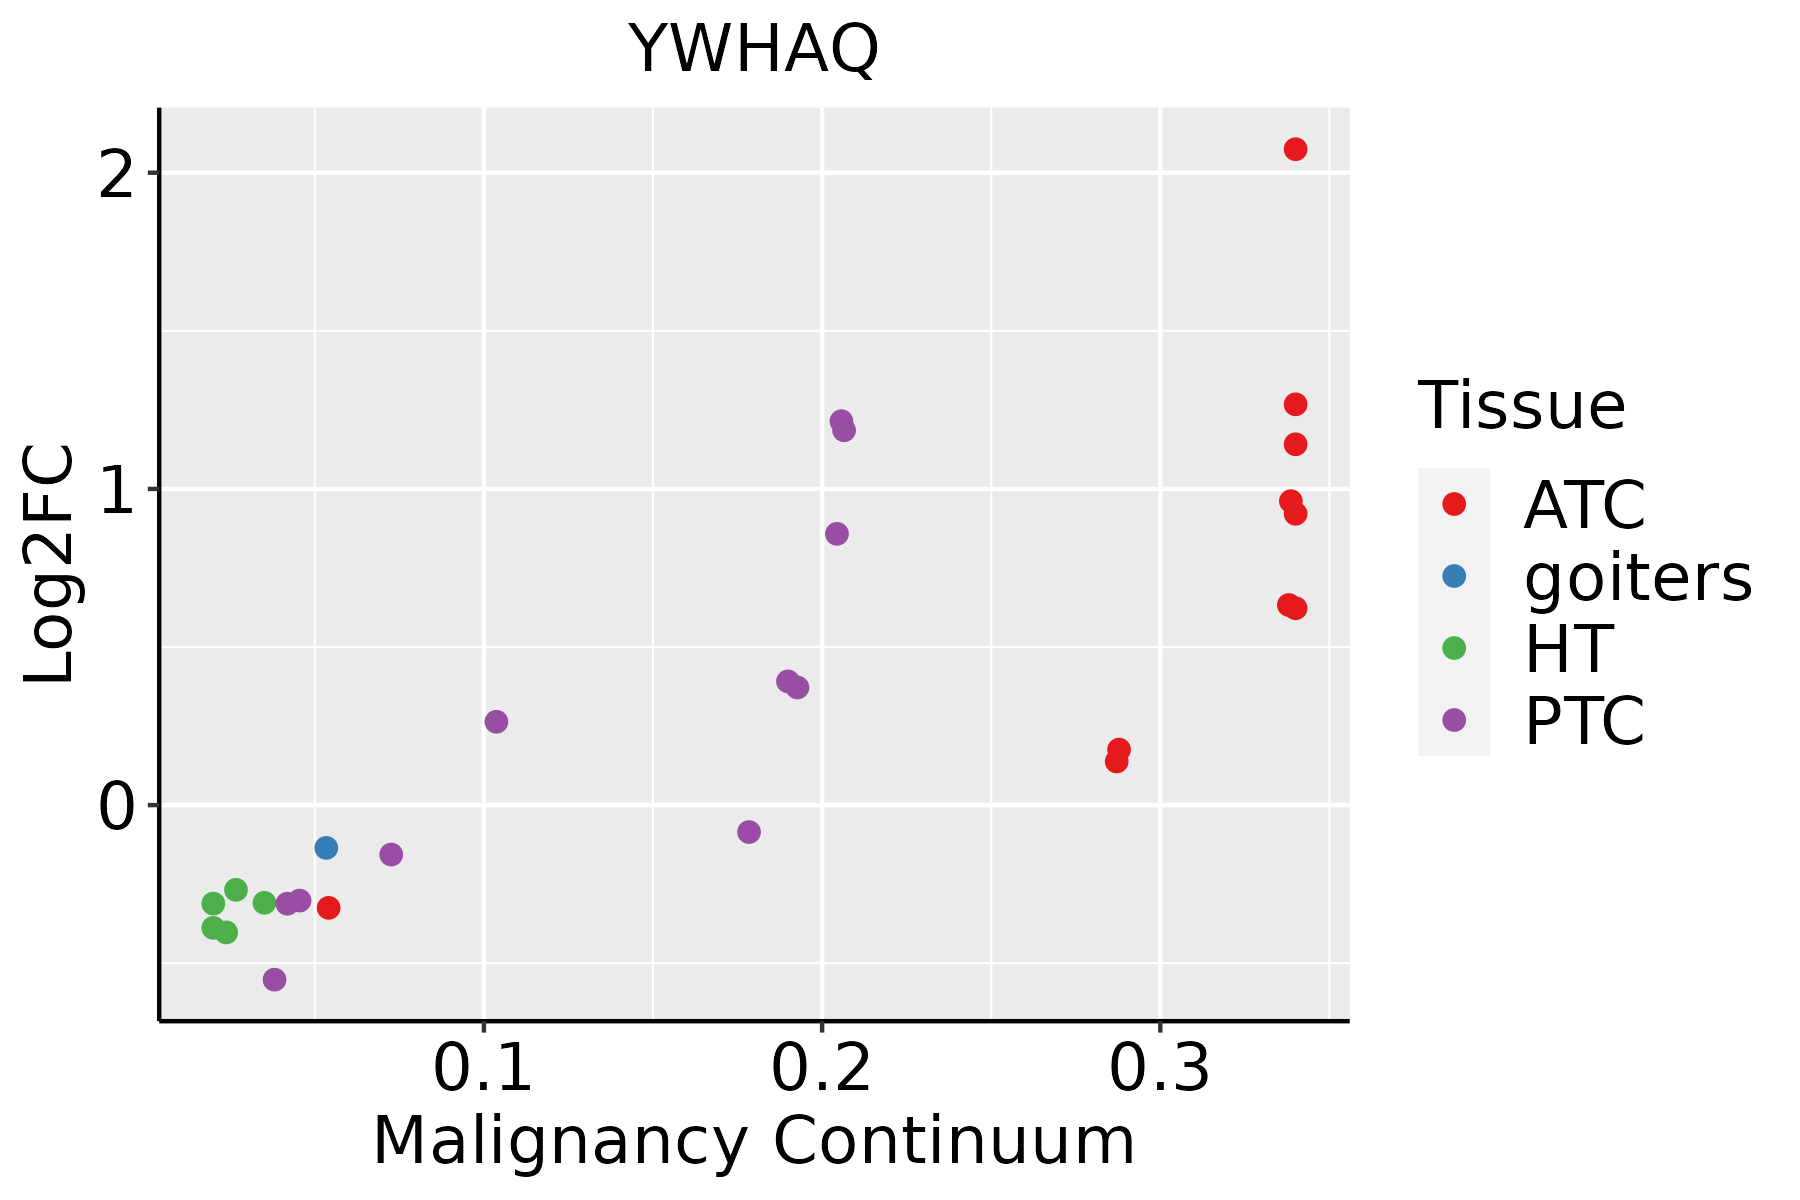 | ATC: Anaplastic thyroid cancer |
| HT: Hashimoto's thyroiditis | ||
| PTC: Papillary thyroid cancer |
| ∗log2FC in expression of this searched gene in stem-like cells from each diseased tissue sample relative to stem-like cells in normal samples in each tissue plotted against the malignancy continuum. Samples are colored based on if they are from different disease stage. |
Top |
Malignant transformation related pathway analysis |
| Find out the enriched GO biological processes and KEGG pathways involved in transition from healthy to precancer to cancer |
| Tissue | Disease Stage | Enriched GO biological Processes |
| Colorectum | AD |  |
| Colorectum | SER |  |
| Colorectum | MSS |  |
| Colorectum | MSI-H |  |
| Colorectum | FAP |  |
| ∗Top 15 enriched GO BP terms are showed in the bar plot of each disease state in each tissue. Each row represents a significant GO biological process which is colored according to the -log10(p.adjust). |
| Page: 1 2 3 4 5 6 7 8 9 |
| GO ID | Tissue | Disease Stage | Description | Gene Ratio | Bg Ratio | pvalue | p.adjust | Count |
| GO:002176216 | Endometrium | EEC | substantia nigra development | 16/2168 | 44/18723 | 1.71e-05 | 3.26e-04 | 16 |
| GO:003090113 | Endometrium | EEC | midbrain development | 23/2168 | 90/18723 | 1.80e-04 | 2.21e-03 | 23 |
| GO:004885714 | Endometrium | EEC | neural nucleus development | 18/2168 | 64/18723 | 2.47e-04 | 2.88e-03 | 18 |
| GO:005105111 | Endometrium | EEC | negative regulation of transport | 80/2168 | 470/18723 | 2.53e-04 | 2.93e-03 | 80 |
| GO:00347661 | Endometrium | EEC | negative regulation of ion transmembrane transport | 22/2168 | 109/18723 | 6.39e-03 | 3.76e-02 | 22 |
| GO:000660525 | Esophagus | HGIN | protein targeting | 78/2587 | 314/18723 | 1.08e-07 | 5.47e-06 | 78 |
| GO:002176220 | Esophagus | HGIN | substantia nigra development | 14/2587 | 44/18723 | 1.75e-03 | 1.90e-02 | 14 |
| GO:0006605111 | Esophagus | ESCC | protein targeting | 229/8552 | 314/18723 | 4.93e-23 | 1.01e-20 | 229 |
| GO:0021762111 | Esophagus | ESCC | substantia nigra development | 35/8552 | 44/18723 | 4.40e-06 | 4.69e-05 | 35 |
| GO:004885718 | Esophagus | ESCC | neural nucleus development | 44/8552 | 64/18723 | 1.59e-04 | 1.05e-03 | 44 |
| GO:003090118 | Esophagus | ESCC | midbrain development | 58/8552 | 90/18723 | 2.52e-04 | 1.55e-03 | 58 |
| GO:00066057 | Liver | Cirrhotic | protein targeting | 148/4634 | 314/18723 | 3.86e-18 | 6.20e-16 | 148 |
| GO:002176212 | Liver | Cirrhotic | substantia nigra development | 25/4634 | 44/18723 | 5.57e-06 | 9.10e-05 | 25 |
| GO:004885712 | Liver | Cirrhotic | neural nucleus development | 28/4634 | 64/18723 | 6.78e-04 | 5.08e-03 | 28 |
| GO:003090111 | Liver | Cirrhotic | midbrain development | 35/4634 | 90/18723 | 2.06e-03 | 1.28e-02 | 35 |
| GO:00510514 | Liver | Cirrhotic | negative regulation of transport | 141/4634 | 470/18723 | 5.06e-03 | 2.62e-02 | 141 |
| GO:000660512 | Liver | HCC | protein targeting | 219/7958 | 314/18723 | 7.74e-23 | 1.49e-20 | 219 |
| GO:002176222 | Liver | HCC | substantia nigra development | 33/7958 | 44/18723 | 1.21e-05 | 1.38e-04 | 33 |
| GO:003090121 | Liver | HCC | midbrain development | 54/7958 | 90/18723 | 6.04e-04 | 3.79e-03 | 54 |
| GO:004885722 | Liver | HCC | neural nucleus development | 38/7958 | 64/18723 | 4.78e-03 | 2.02e-02 | 38 |
| Page: 1 2 3 4 5 6 |
| Pathway ID | Tissue | Disease Stage | Description | Gene Ratio | Bg Ratio | pvalue | p.adjust | qvalue | Count |
| hsa052036 | Breast | Precancer | Viral carcinogenesis | 27/684 | 204/8465 | 7.19e-03 | 4.06e-02 | 3.11e-02 | 27 |
| hsa0520312 | Breast | Precancer | Viral carcinogenesis | 27/684 | 204/8465 | 7.19e-03 | 4.06e-02 | 3.11e-02 | 27 |
| hsa0520322 | Breast | IDC | Viral carcinogenesis | 34/867 | 204/8465 | 2.82e-03 | 1.86e-02 | 1.39e-02 | 34 |
| hsa0520332 | Breast | IDC | Viral carcinogenesis | 34/867 | 204/8465 | 2.82e-03 | 1.86e-02 | 1.39e-02 | 34 |
| hsa0520341 | Breast | DCIS | Viral carcinogenesis | 34/846 | 204/8465 | 1.88e-03 | 1.27e-02 | 9.33e-03 | 34 |
| hsa052035 | Breast | DCIS | Viral carcinogenesis | 34/846 | 204/8465 | 1.88e-03 | 1.27e-02 | 9.33e-03 | 34 |
| hsa043908 | Cervix | CC | Hippo signaling pathway | 40/1267 | 157/8465 | 3.64e-04 | 1.82e-03 | 1.07e-03 | 40 |
| hsa041106 | Cervix | CC | Cell cycle | 36/1267 | 157/8465 | 4.94e-03 | 1.67e-02 | 9.86e-03 | 36 |
| hsa0439013 | Cervix | CC | Hippo signaling pathway | 40/1267 | 157/8465 | 3.64e-04 | 1.82e-03 | 1.07e-03 | 40 |
| hsa0411013 | Cervix | CC | Cell cycle | 36/1267 | 157/8465 | 4.94e-03 | 1.67e-02 | 9.86e-03 | 36 |
| hsa051602 | Colorectum | MSS | Hepatitis C | 52/1875 | 157/8465 | 9.29e-04 | 5.58e-03 | 3.42e-03 | 52 |
| hsa04390 | Colorectum | MSS | Hippo signaling pathway | 48/1875 | 157/8465 | 8.32e-03 | 3.10e-02 | 1.90e-02 | 48 |
| hsa05161 | Colorectum | MSS | Hepatitis B | 48/1875 | 162/8465 | 1.53e-02 | 4.93e-02 | 3.02e-02 | 48 |
| hsa051603 | Colorectum | MSS | Hepatitis C | 52/1875 | 157/8465 | 9.29e-04 | 5.58e-03 | 3.42e-03 | 52 |
| hsa043901 | Colorectum | MSS | Hippo signaling pathway | 48/1875 | 157/8465 | 8.32e-03 | 3.10e-02 | 1.90e-02 | 48 |
| hsa051611 | Colorectum | MSS | Hepatitis B | 48/1875 | 162/8465 | 1.53e-02 | 4.93e-02 | 3.02e-02 | 48 |
| hsa043902 | Colorectum | FAP | Hippo signaling pathway | 41/1404 | 157/8465 | 1.49e-03 | 7.91e-03 | 4.81e-03 | 41 |
| hsa04151 | Colorectum | FAP | PI3K-Akt signaling pathway | 75/1404 | 354/8465 | 1.23e-02 | 4.19e-02 | 2.55e-02 | 75 |
| hsa04110 | Colorectum | FAP | Cell cycle | 37/1404 | 157/8465 | 1.44e-02 | 4.77e-02 | 2.90e-02 | 37 |
| hsa043903 | Colorectum | FAP | Hippo signaling pathway | 41/1404 | 157/8465 | 1.49e-03 | 7.91e-03 | 4.81e-03 | 41 |
| Page: 1 2 3 4 5 6 7 8 |
Top |
Cell-cell communication analysis |
| Identification of potential cell-cell interactions between two cell types and their ligand-receptor pairs for different disease states |
| Ligand | Receptor | LRpair | Pathway | Tissue | Disease Stage |
| Page: 1 |
Top |
Single-cell gene regulatory network inference analysis |
| Find out the significant the regulons (TFs) and the target genes of each regulon across cell types for different disease states |
| TF | Cell Type | Tissue | Disease Stage | Target Gene | RSS | Regulon Activity |
| ∗The dot plots of a searched regulon are shown for all cell subpopulations in each disease state of each tissue based on the regulon specific score inferred using pySCENIC and by calculating the average expression. |
| Page: 1 |
Top |
Somatic mutation of malignant transformation related genes |
| Annotation of somatic variants for genes involved in malignant transformation |
| Hugo Symbol | Variant Class | Variant Classification | dbSNP RS | HGVSc | HGVSp | HGVSp Short | SWISSPROT | BIOTYPE | SIFT | PolyPhen | Tumor Sample Barcode | Tissue | Histology | Sex | Age | Stage | Therapy Types | Drugs | Outcome |
| YWHAQ | SNV | Missense_Mutation | novel | c.212C>T | p.Thr71Ile | p.T71I | P27348 | protein_coding | deleterious_low_confidence(0.02) | benign(0.035) | TCGA-3C-AALI-01 | Breast | breast invasive carcinoma | Female | <65 | I/II | Unspecific | Poly E | Complete Response |
| YWHAQ | SNV | Missense_Mutation | novel | c.370N>A | p.Asp124Asn | p.D124N | P27348 | protein_coding | deleterious_low_confidence(0.02) | probably_damaging(0.997) | TCGA-C5-A2LZ-01 | Cervix | cervical & endocervical cancer | Female | >=65 | III/IV | Unknown | Unknown | PD |
| YWHAQ | SNV | Missense_Mutation | novel | c.9N>C | p.Lys3Asn | p.K3N | P27348 | protein_coding | deleterious_low_confidence(0) | benign(0.138) | TCGA-C5-A2LZ-01 | Cervix | cervical & endocervical cancer | Female | >=65 | III/IV | Unknown | Unknown | PD |
| YWHAQ | SNV | Missense_Mutation | c.471G>C | p.Lys157Asn | p.K157N | P27348 | protein_coding | tolerated_low_confidence(0.08) | benign(0.044) | TCGA-IR-A3LA-01 | Cervix | cervical & endocervical cancer | Female | <65 | I/II | Chemotherapy | cisplatin | CR | |
| YWHAQ | insertion | In_Frame_Ins | novel | c.74_75insTTGGTTCCTGAGATGCTCAGTGCTCGGTCACTT | p.Cys25_Met26insTrpPheLeuArgCysSerValLeuGlyHisPhe | p.C25_M26insWFLRCSVLGHF | P27348 | protein_coding | TCGA-JW-A5VL-01 | Cervix | cervical & endocervical cancer | Female | <65 | I/II | Unknown | Unknown | SD | ||
| YWHAQ | SNV | Missense_Mutation | c.83N>T | p.Ala28Val | p.A28V | P27348 | protein_coding | tolerated_low_confidence(0.11) | benign(0.053) | TCGA-AA-3715-01 | Colorectum | colon adenocarcinoma | Male | >=65 | I/II | Unknown | Unknown | PD | |
| YWHAQ | SNV | Missense_Mutation | novel | c.374A>G | p.Tyr125Cys | p.Y125C | P27348 | protein_coding | deleterious_low_confidence(0) | probably_damaging(1) | TCGA-AA-A00N-01 | Colorectum | colon adenocarcinoma | Male | >=65 | I/II | Unknown | Unknown | PD |
| YWHAQ | SNV | Missense_Mutation | c.319N>T | p.Ala107Ser | p.A107S | P27348 | protein_coding | deleterious_low_confidence(0.04) | benign(0.006) | TCGA-AA-A010-01 | Colorectum | colon adenocarcinoma | Female | <65 | I/II | Chemotherapy | folinic | CR | |
| YWHAQ | SNV | Missense_Mutation | novel | c.248N>A | p.Arg83Gln | p.R83Q | P27348 | protein_coding | deleterious_low_confidence(0.02) | possibly_damaging(0.581) | TCGA-A5-A0G2-01 | Endometrium | uterine corpus endometrioid carcinoma | Female | <65 | III/IV | Unknown | Unknown | SD |
| YWHAQ | SNV | Missense_Mutation | rs367832498 | c.500N>A | p.Arg167His | p.R167H | P27348 | protein_coding | deleterious_low_confidence(0.04) | possibly_damaging(0.731) | TCGA-A5-A0GI-01 | Endometrium | uterine corpus endometrioid carcinoma | Female | <65 | I/II | Unknown | Unknown | SD |
| Page: 1 2 3 |
Top |
Related drugs of malignant transformation related genes |
| Identification of chemicals and drugs interact with genes involved in malignant transfromation |
| (DGIdb 4.0) |
| Entrez ID | Symbol | Category | Interaction Types | Drug Claim Name | Drug Name | PMIDs |
| Page: 1 |

Copyright 2023-Present -The University of Texas Health Science Center at Houston |