
|
|||||
|
 | |
| |
| |
| |
| |
| |
|
Gene: YKT6 |
Gene summary for YKT6 |
| Gene information | Species | Human | Gene symbol | YKT6 | Gene ID | 10652 |
| Gene name | YKT6 v-SNARE homolog | |
| Gene Alias | YKT6 | |
| Cytomap | 7p13 | |
| Gene Type | protein-coding | GO ID | GO:0006810 | UniProtAcc | A4D2J0 |
Top |
Malignant transformation analysis |
| Identification of the aberrant gene expression in precancerous and cancerous lesions by comparing the gene expression of stem-like cells in diseased tissues with normal stem cells |
| Entrez ID | Symbol | Replicates | Species | Organ | Tissue | Adj P-value | Log2FC | Malignancy |
| 10652 | YKT6 | HTA11_3410_2000001011 | Human | Colorectum | AD | 1.36e-02 | 1.69e-01 | 0.0155 |
| 10652 | YKT6 | HTA11_2487_2000001011 | Human | Colorectum | SER | 1.38e-12 | 5.48e-01 | -0.1808 |
| 10652 | YKT6 | HTA11_1938_2000001011 | Human | Colorectum | AD | 2.16e-02 | 2.87e-01 | -0.0811 |
| 10652 | YKT6 | HTA11_78_2000001011 | Human | Colorectum | AD | 9.08e-07 | 3.57e-01 | -0.1088 |
| 10652 | YKT6 | HTA11_347_2000001011 | Human | Colorectum | AD | 1.08e-13 | 3.73e-01 | -0.1954 |
| 10652 | YKT6 | HTA11_411_2000001011 | Human | Colorectum | SER | 1.75e-08 | 8.75e-01 | -0.2602 |
| 10652 | YKT6 | HTA11_2112_2000001011 | Human | Colorectum | SER | 2.17e-02 | 5.56e-01 | -0.2196 |
| 10652 | YKT6 | HTA11_3361_2000001011 | Human | Colorectum | AD | 9.34e-07 | 3.65e-01 | -0.1207 |
| 10652 | YKT6 | HTA11_83_2000001011 | Human | Colorectum | SER | 2.78e-05 | 3.77e-01 | -0.1526 |
| 10652 | YKT6 | HTA11_696_2000001011 | Human | Colorectum | AD | 6.58e-23 | 6.10e-01 | -0.1464 |
| 10652 | YKT6 | HTA11_866_2000001011 | Human | Colorectum | AD | 1.49e-06 | 2.32e-01 | -0.1001 |
| 10652 | YKT6 | HTA11_1391_2000001011 | Human | Colorectum | AD | 1.68e-13 | 4.95e-01 | -0.059 |
| 10652 | YKT6 | HTA11_2992_2000001011 | Human | Colorectum | SER | 4.03e-06 | 5.12e-01 | -0.1706 |
| 10652 | YKT6 | HTA11_5212_2000001011 | Human | Colorectum | AD | 5.05e-06 | 4.79e-01 | -0.2061 |
| 10652 | YKT6 | HTA11_5216_2000001011 | Human | Colorectum | SER | 6.62e-04 | 4.61e-01 | -0.1462 |
| 10652 | YKT6 | HTA11_546_2000001011 | Human | Colorectum | AD | 1.47e-04 | 4.01e-01 | -0.0842 |
| 10652 | YKT6 | HTA11_866_3004761011 | Human | Colorectum | AD | 1.04e-07 | 2.86e-01 | 0.096 |
| 10652 | YKT6 | HTA11_8622_2000001021 | Human | Colorectum | SER | 2.42e-03 | 3.67e-01 | 0.0528 |
| 10652 | YKT6 | HTA11_6801_2000001011 | Human | Colorectum | SER | 9.91e-04 | 3.61e-01 | 0.0171 |
| 10652 | YKT6 | HTA11_7696_3000711011 | Human | Colorectum | AD | 7.59e-12 | 3.32e-01 | 0.0674 |
| Page: 1 2 3 4 5 6 7 |
| Tissue | Expression Dynamics | Abbreviation |
| Colorectum (GSE201348) |  | FAP: Familial adenomatous polyposis |
| CRC: Colorectal cancer | ||
| Colorectum (HTA11) | 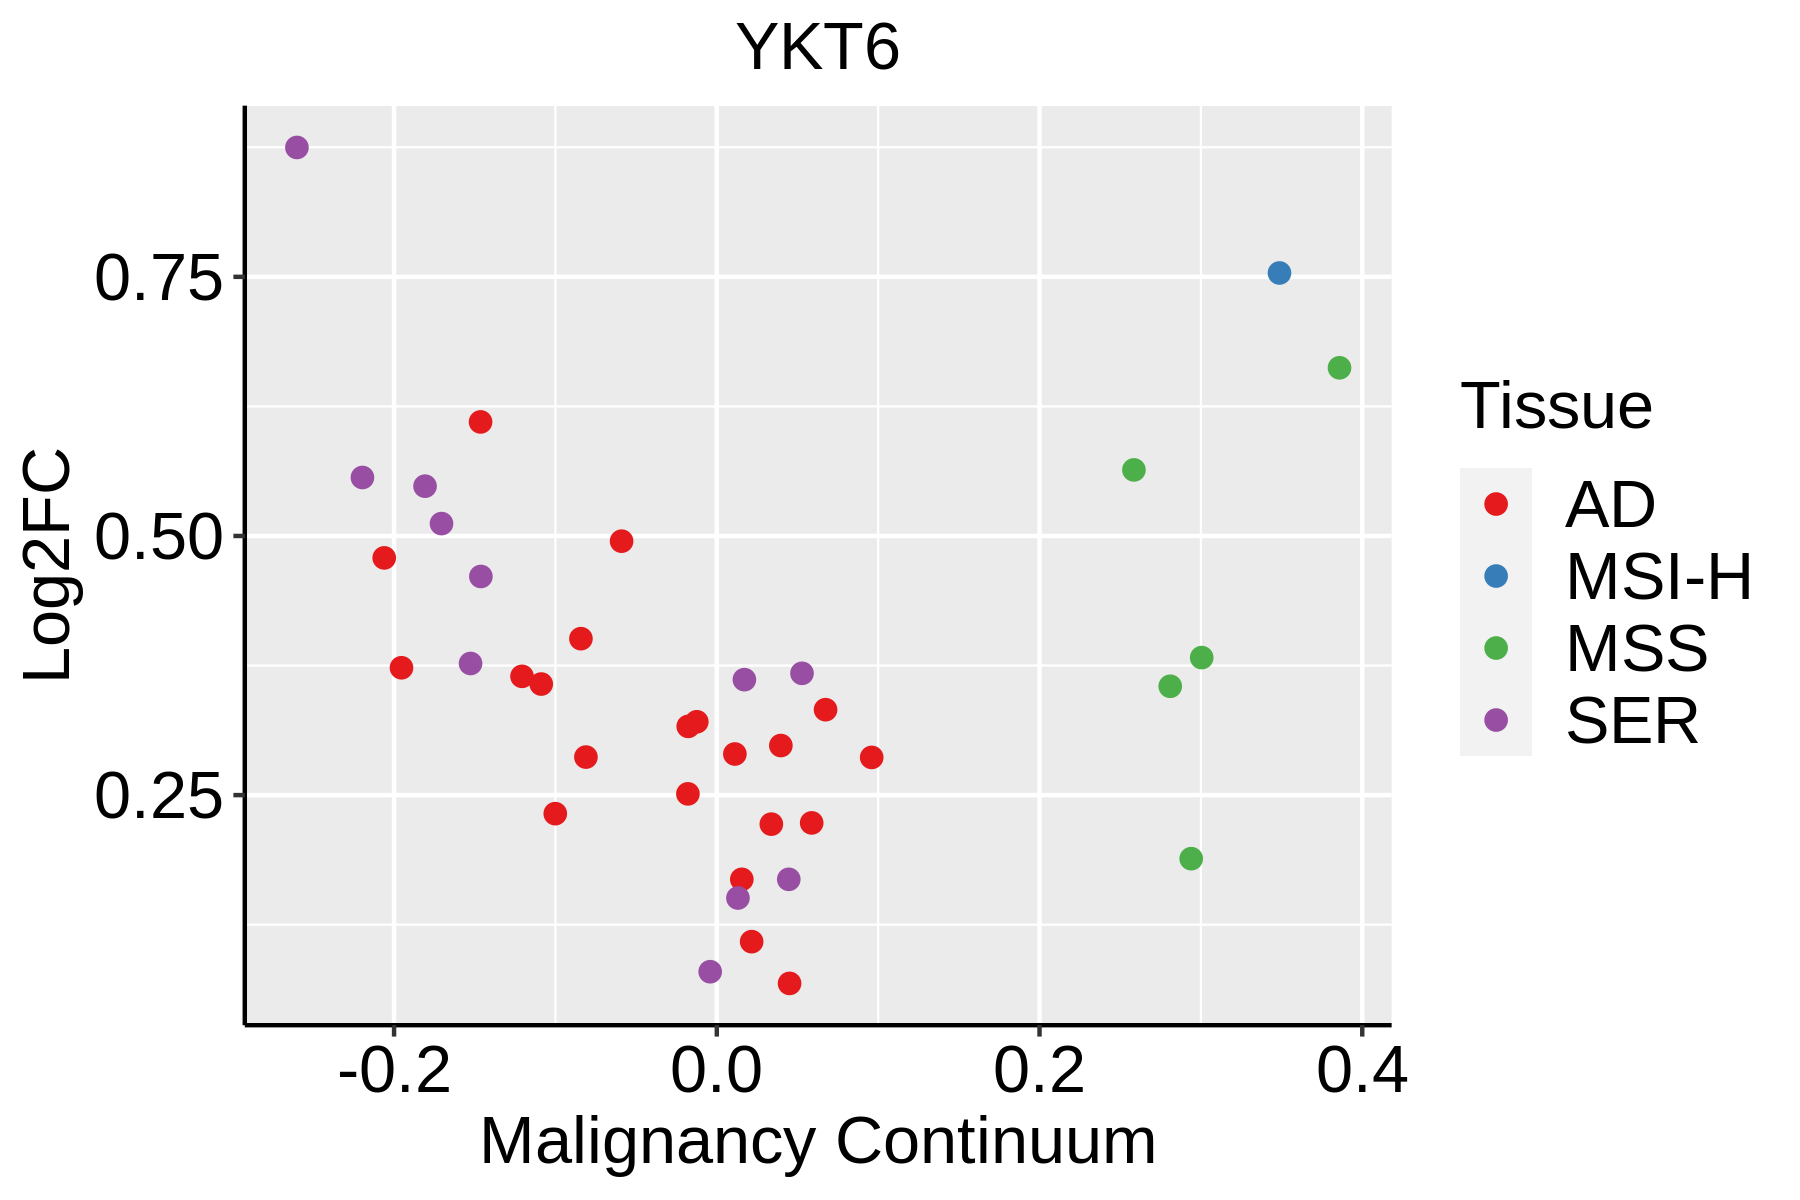 | AD: Adenomas |
| SER: Sessile serrated lesions | ||
| MSI-H: Microsatellite-high colorectal cancer | ||
| MSS: Microsatellite stable colorectal cancer | ||
| Esophagus | 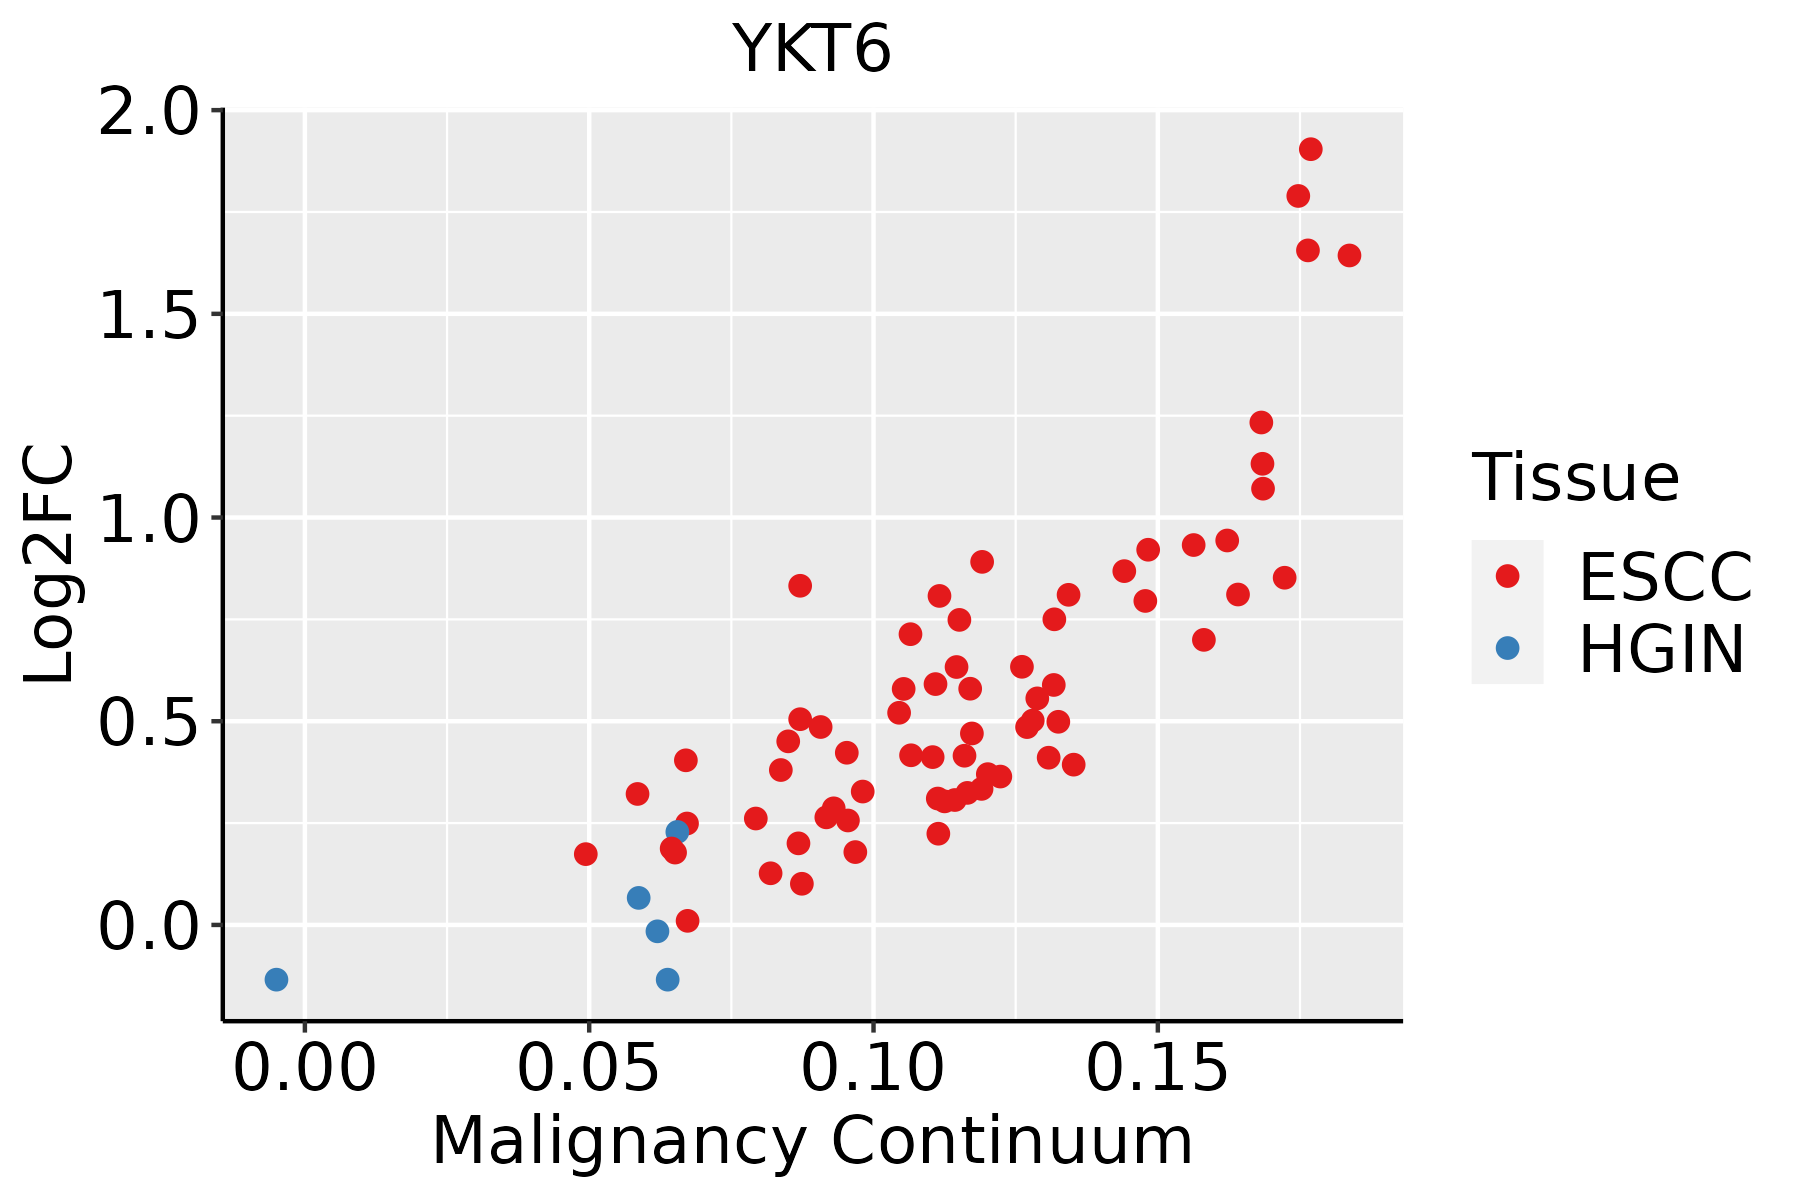 | ESCC: Esophageal squamous cell carcinoma |
| HGIN: High-grade intraepithelial neoplasias | ||
| LGIN: Low-grade intraepithelial neoplasias | ||
| Liver | 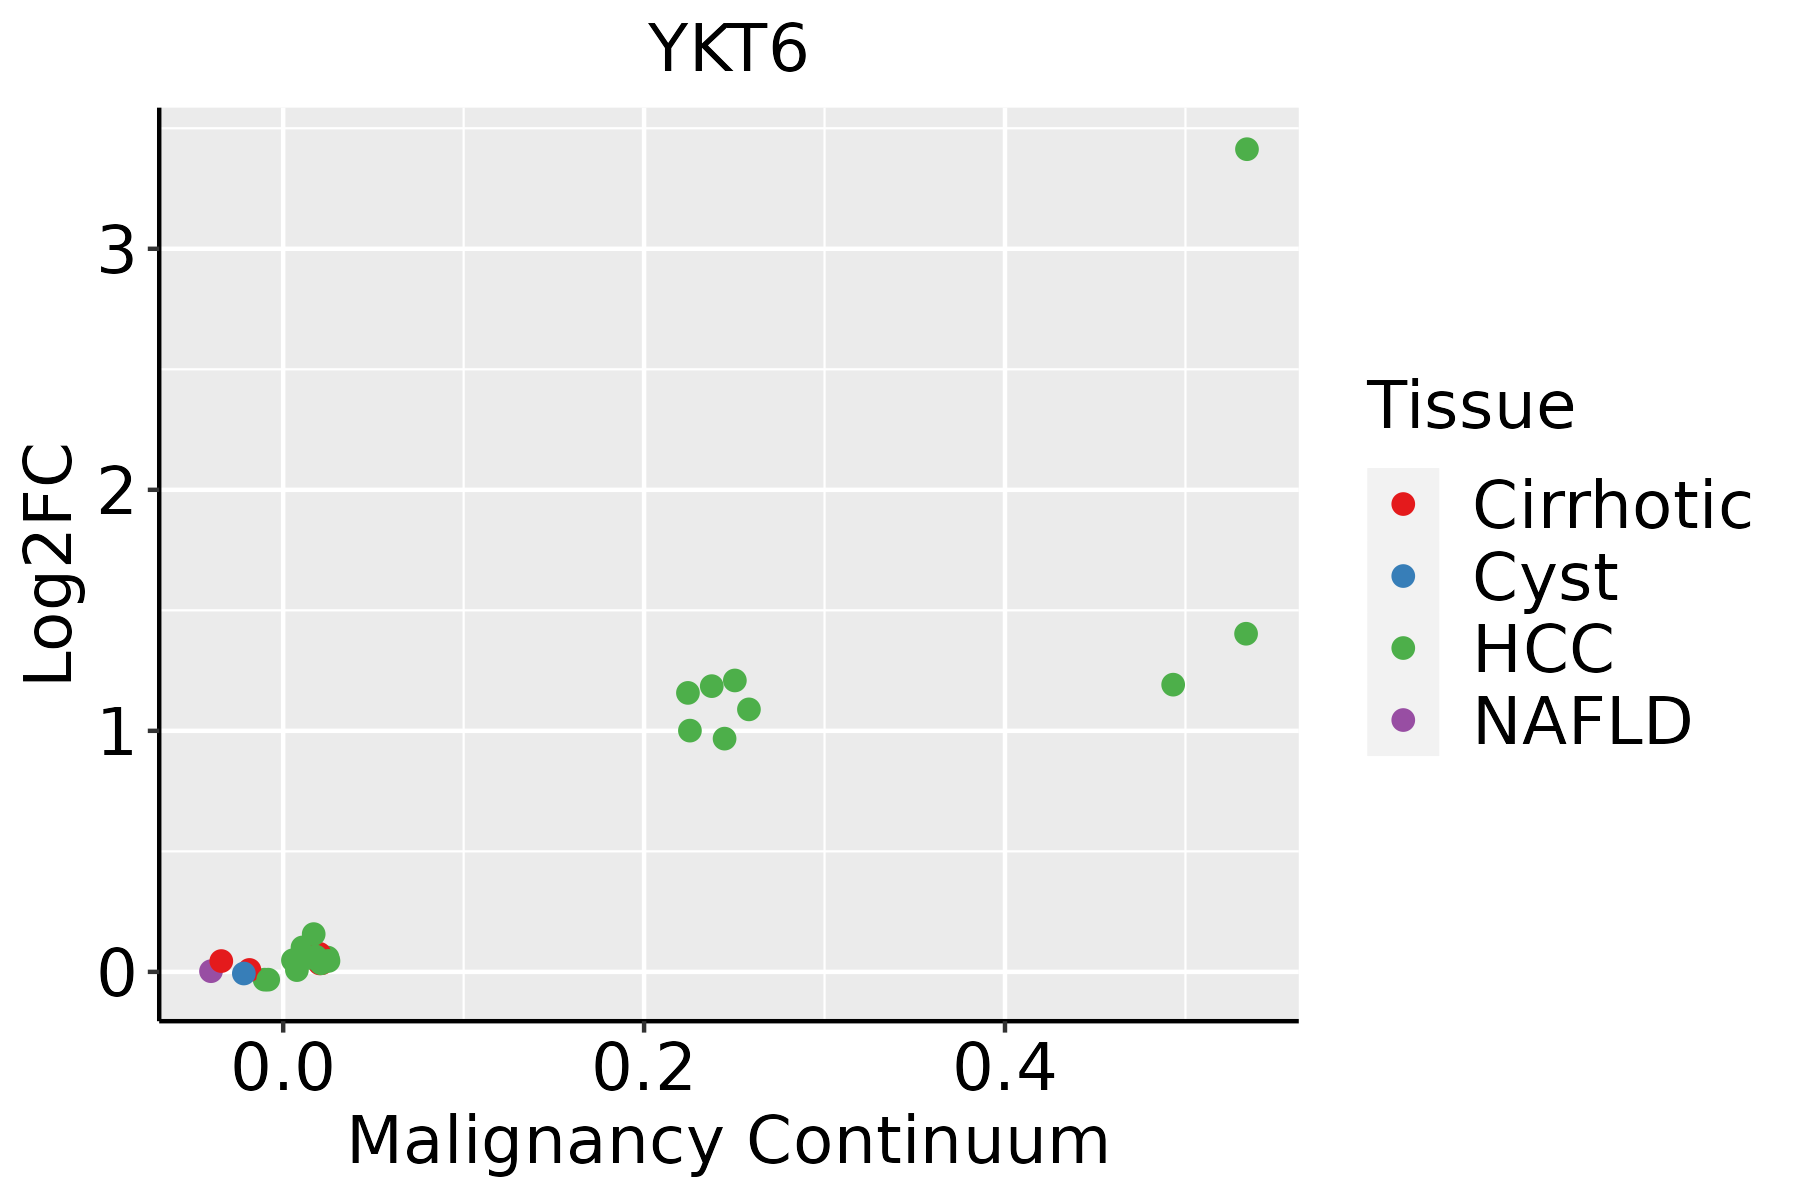 | HCC: Hepatocellular carcinoma |
| NAFLD: Non-alcoholic fatty liver disease | ||
| Oral Cavity | 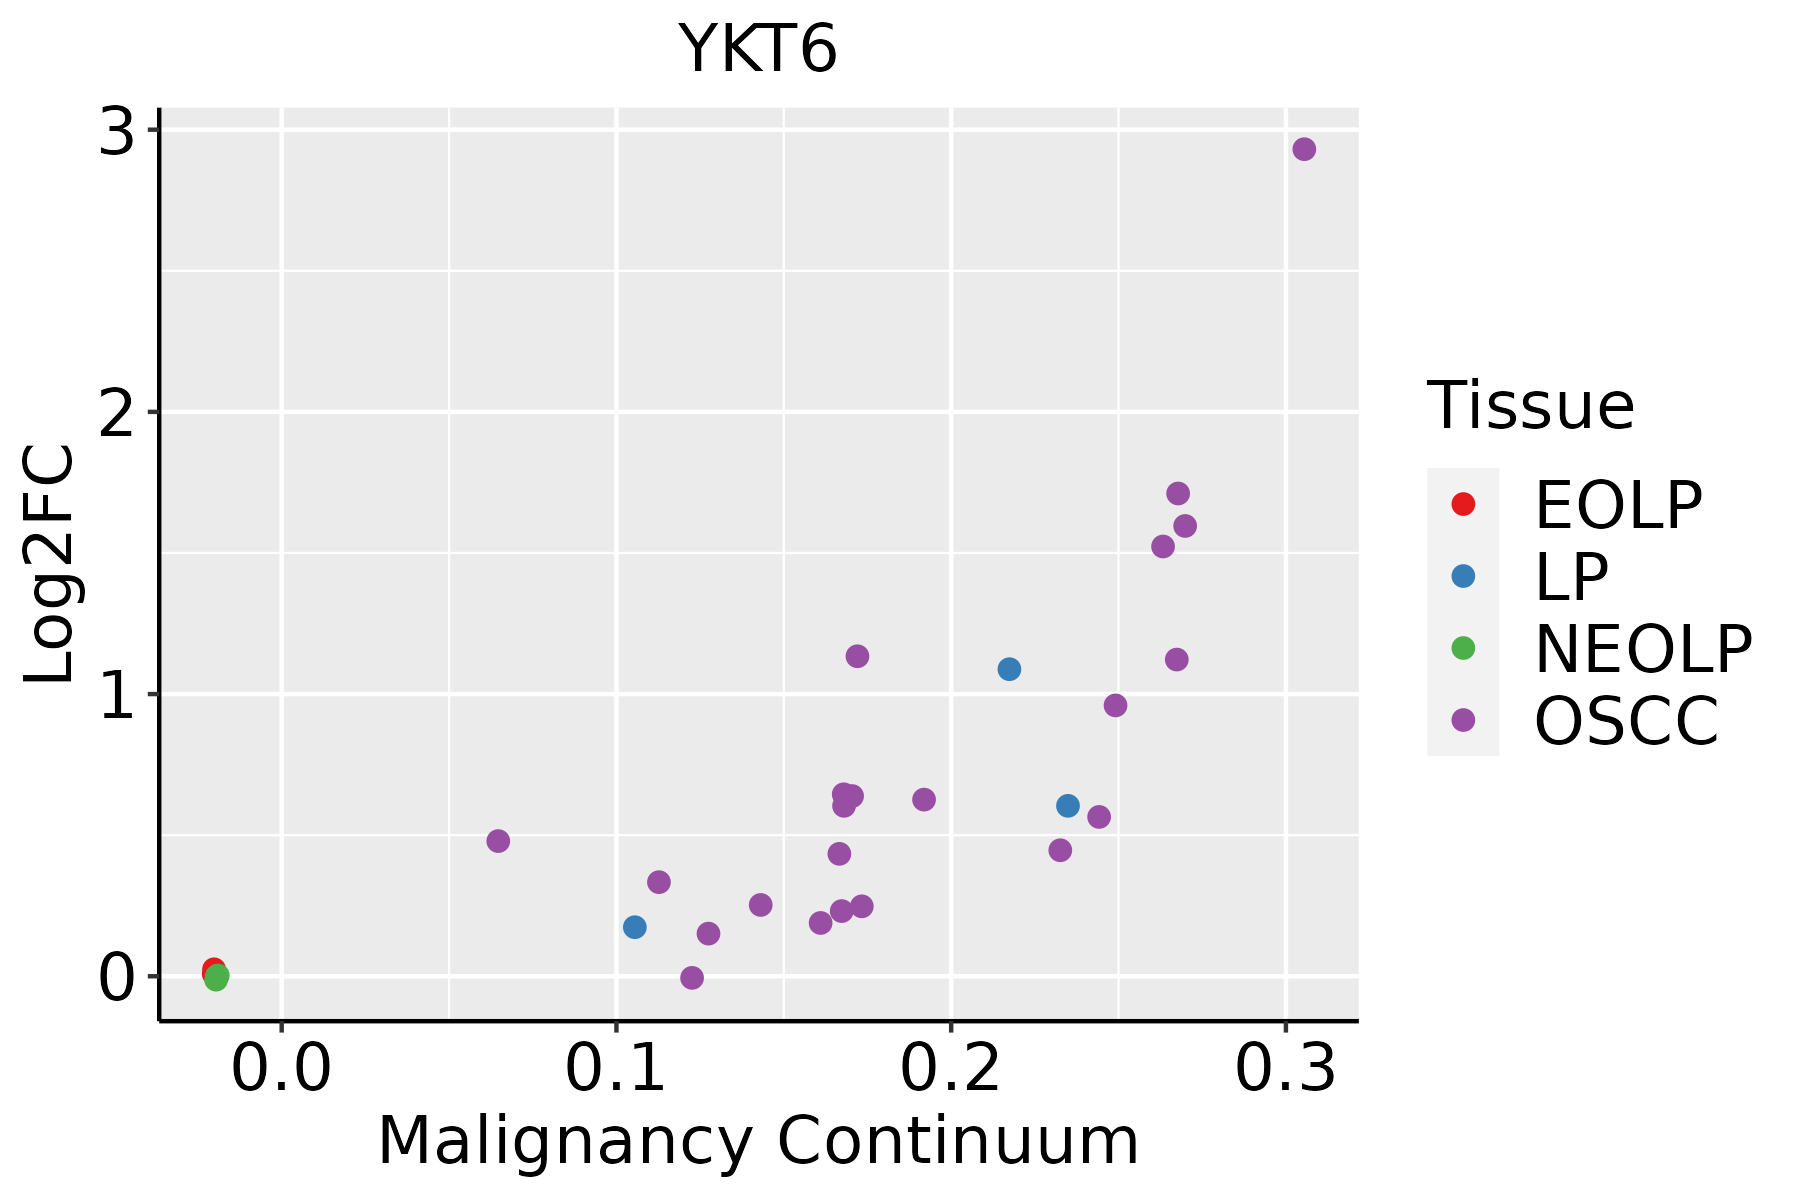 | EOLP: Erosive Oral lichen planus |
| LP: leukoplakia | ||
| NEOLP: Non-erosive oral lichen planus | ||
| OSCC: Oral squamous cell carcinoma | ||
| Skin | 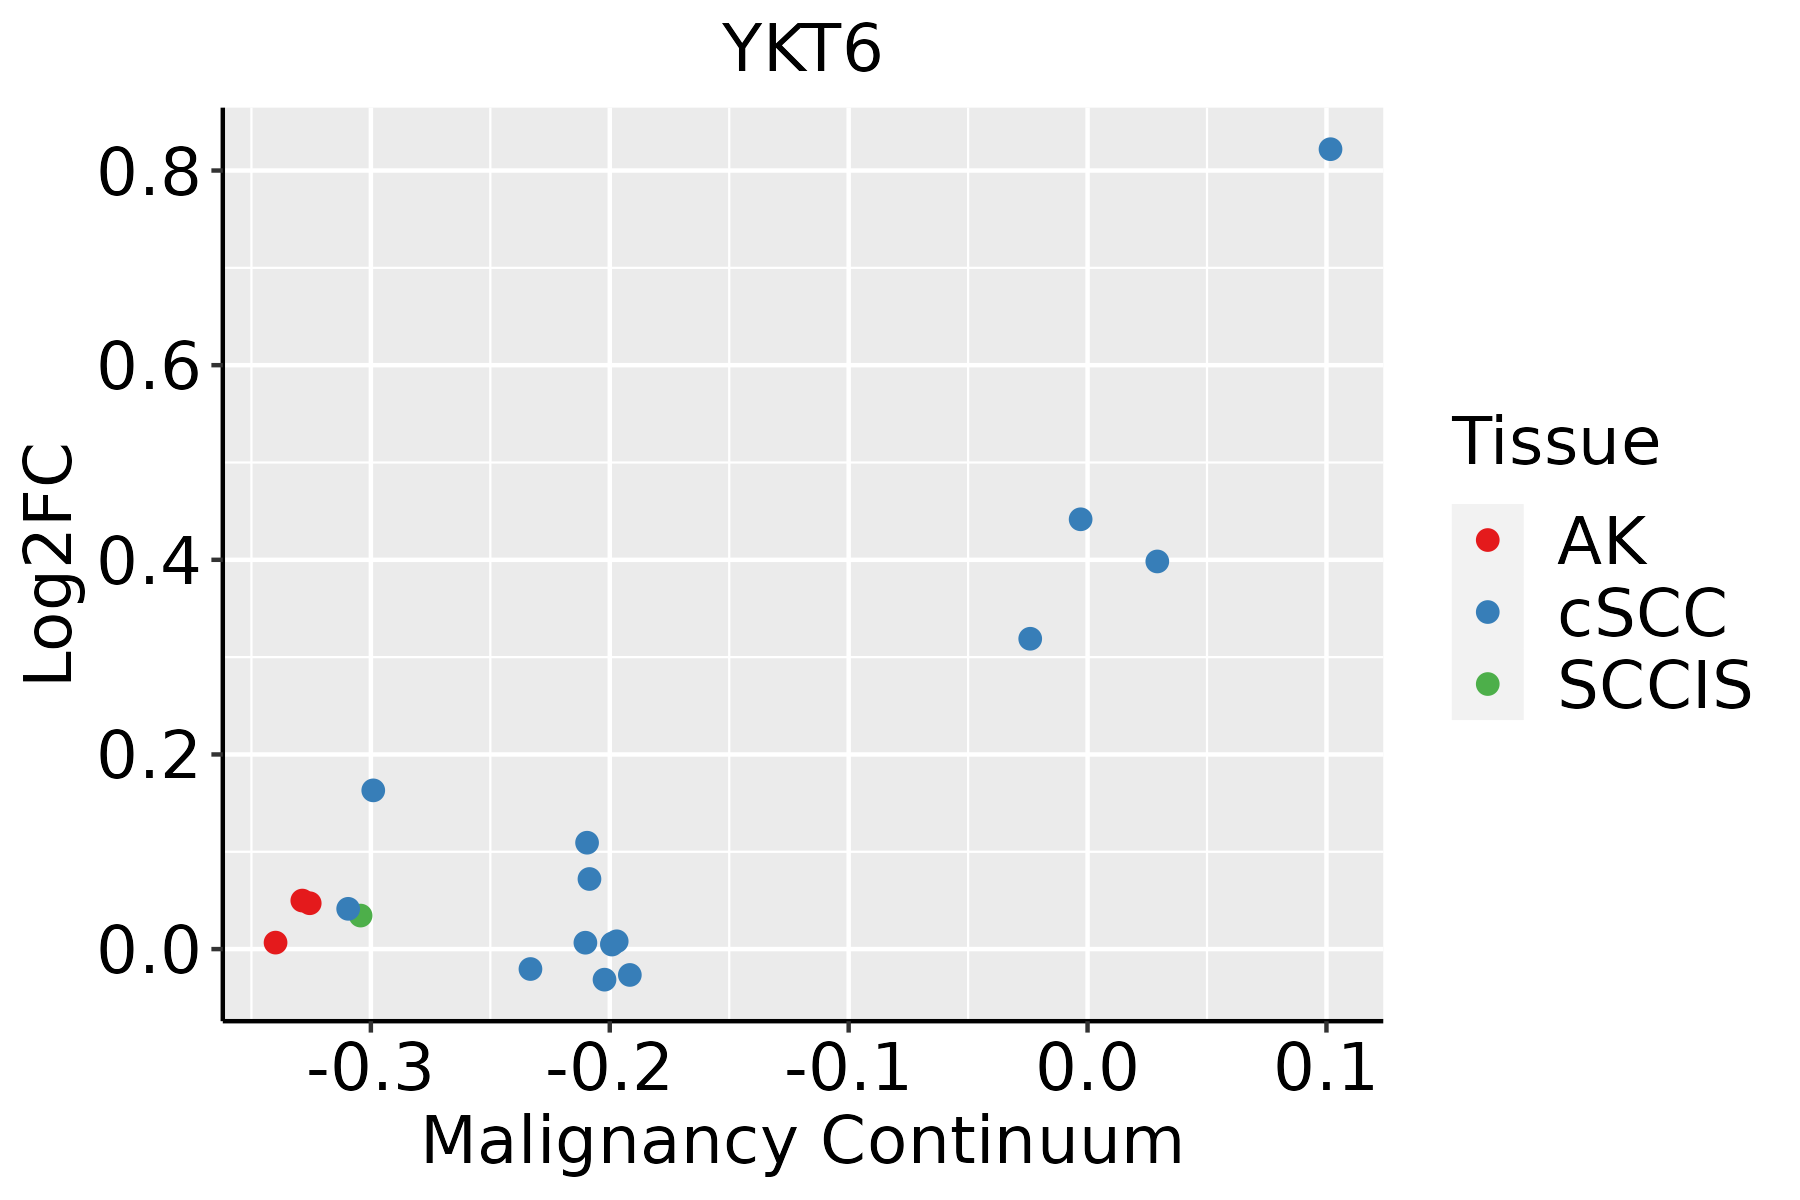 | AK: Actinic keratosis |
| cSCC: Cutaneous squamous cell carcinoma | ||
| SCCIS:squamous cell carcinoma in situ | ||
| Thyroid | 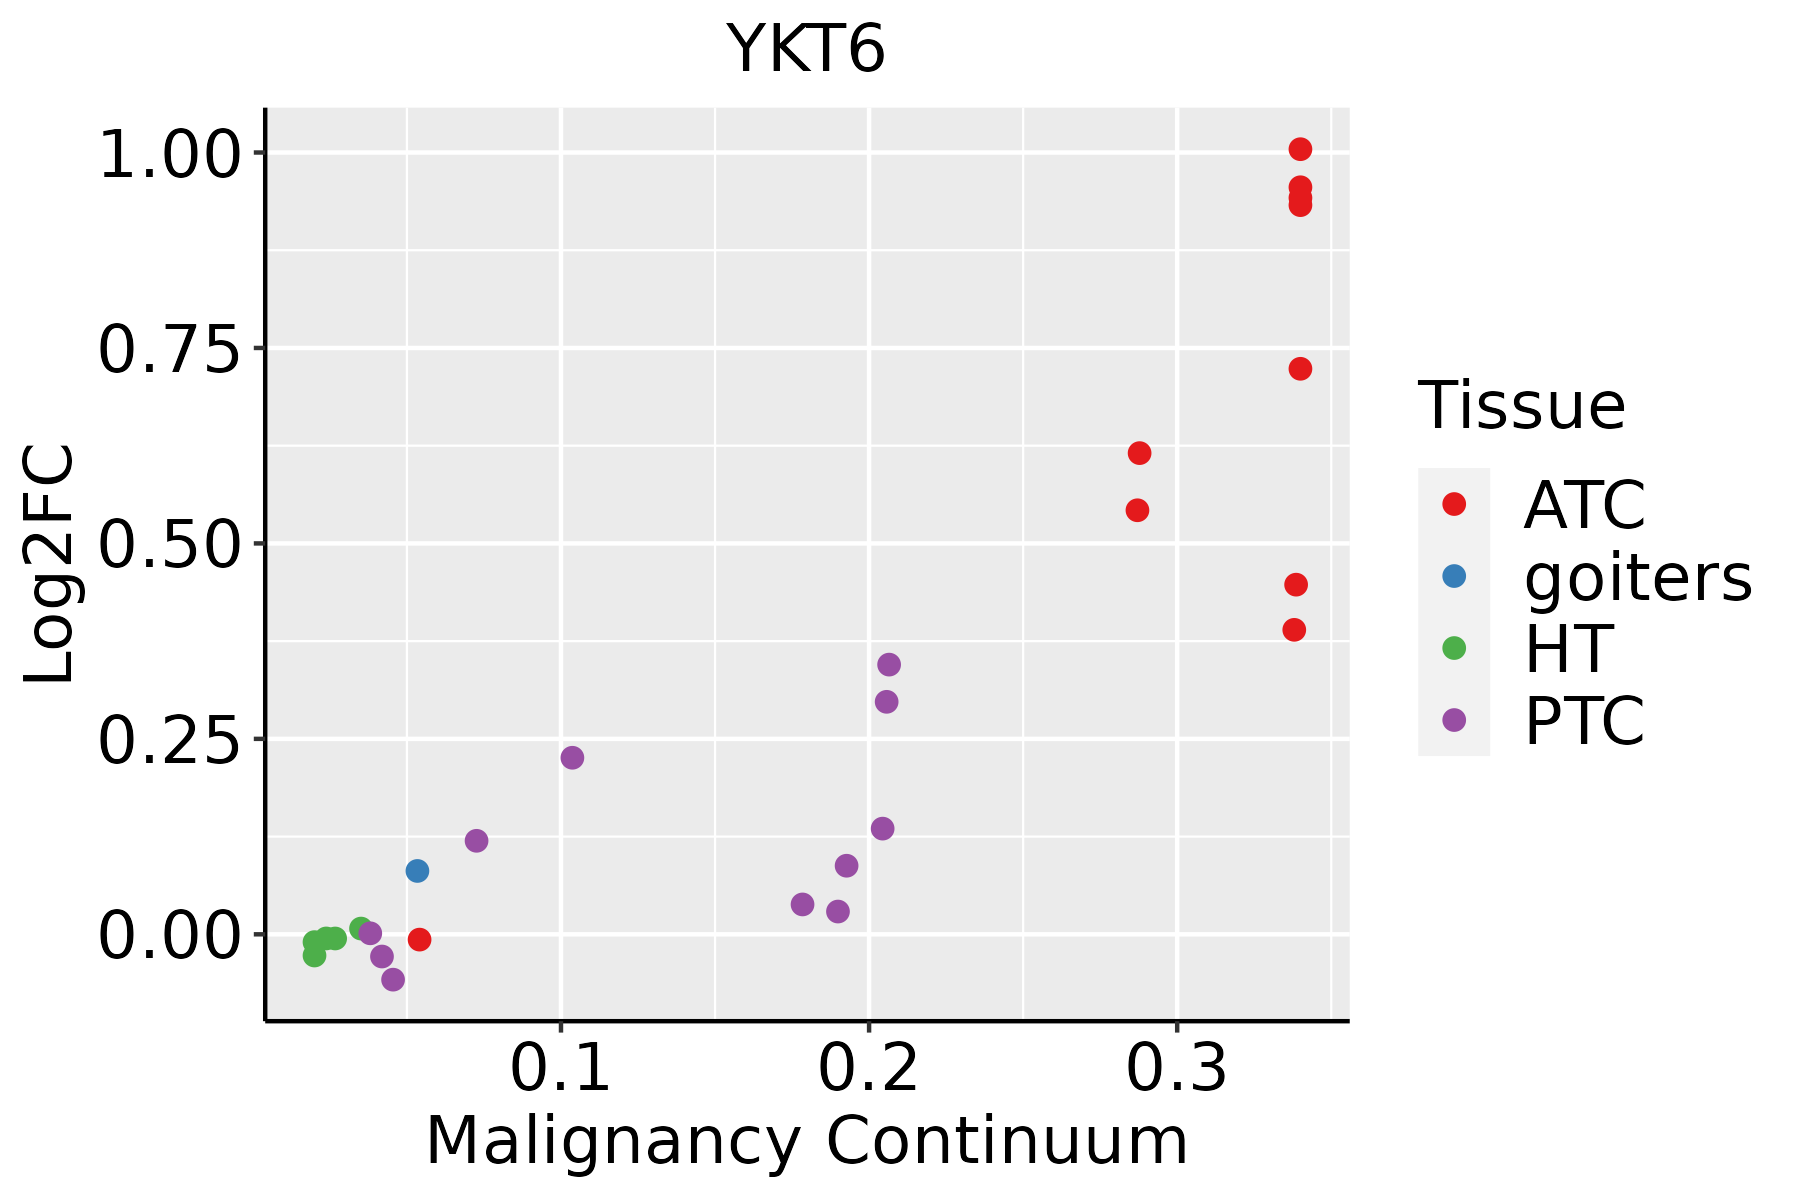 | ATC: Anaplastic thyroid cancer |
| HT: Hashimoto's thyroiditis | ||
| PTC: Papillary thyroid cancer |
| ∗log2FC in expression of this searched gene in stem-like cells from each diseased tissue sample relative to stem-like cells in normal samples in each tissue plotted against the malignancy continuum. Samples are colored based on if they are from different disease stage. |
Top |
Malignant transformation related pathway analysis |
| Find out the enriched GO biological processes and KEGG pathways involved in transition from healthy to precancer to cancer |
| Tissue | Disease Stage | Enriched GO biological Processes |
| Colorectum | AD |  |
| Colorectum | SER |  |
| Colorectum | MSS |  |
| Colorectum | MSI-H |  |
| Colorectum | FAP |  |
| ∗Top 15 enriched GO BP terms are showed in the bar plot of each disease state in each tissue. Each row represents a significant GO biological process which is colored according to the -log10(p.adjust). |
| Page: 1 2 3 4 5 6 7 8 9 |
| GO ID | Tissue | Disease Stage | Description | Gene Ratio | Bg Ratio | pvalue | p.adjust | Count |
| GO:005164815 | Esophagus | ESCC | vesicle localization | 119/8552 | 177/18723 | 5.16e-09 | 1.08e-07 | 119 |
| GO:00069038 | Esophagus | ESCC | vesicle targeting | 38/8552 | 45/18723 | 8.42e-08 | 1.43e-06 | 38 |
| GO:00224069 | Esophagus | ESCC | membrane docking | 62/8552 | 86/18723 | 5.93e-07 | 7.79e-06 | 62 |
| GO:00421477 | Esophagus | ESCC | retrograde transport, endosome to Golgi | 63/8552 | 91/18723 | 4.58e-06 | 4.87e-05 | 63 |
| GO:01400567 | Esophagus | ESCC | organelle localization by membrane tethering | 53/8552 | 77/18723 | 3.33e-05 | 2.74e-04 | 53 |
| GO:00610254 | Esophagus | ESCC | membrane fusion | 98/8552 | 163/18723 | 1.39e-04 | 9.41e-04 | 98 |
| GO:00482781 | Esophagus | ESCC | vesicle docking | 38/8552 | 59/18723 | 2.86e-03 | 1.21e-02 | 38 |
| GO:004819321 | Liver | HCC | Golgi vesicle transport | 217/7958 | 296/18723 | 2.58e-27 | 1.02e-24 | 217 |
| GO:000688821 | Liver | HCC | endoplasmic reticulum to Golgi vesicle-mediated transport | 100/7958 | 130/18723 | 1.15e-15 | 8.67e-14 | 100 |
| GO:001619721 | Liver | HCC | endosomal transport | 154/7958 | 230/18723 | 4.74e-14 | 2.95e-12 | 154 |
| GO:001648221 | Liver | HCC | cytosolic transport | 117/7958 | 168/18723 | 8.83e-13 | 4.48e-11 | 117 |
| GO:005165621 | Liver | HCC | establishment of organelle localization | 226/7958 | 390/18723 | 4.15e-10 | 1.34e-08 | 226 |
| GO:005165021 | Liver | HCC | establishment of vesicle localization | 103/7958 | 161/18723 | 2.94e-08 | 6.69e-07 | 103 |
| GO:005164821 | Liver | HCC | vesicle localization | 107/7958 | 177/18723 | 1.05e-06 | 1.57e-05 | 107 |
| GO:004214721 | Liver | HCC | retrograde transport, endosome to Golgi | 61/7958 | 91/18723 | 1.94e-06 | 2.68e-05 | 61 |
| GO:000690311 | Liver | HCC | vesicle targeting | 34/7958 | 45/18723 | 6.75e-06 | 8.08e-05 | 34 |
| GO:002240611 | Liver | HCC | membrane docking | 57/7958 | 86/18723 | 7.14e-06 | 8.47e-05 | 57 |
| GO:014005611 | Liver | HCC | organelle localization by membrane tethering | 49/7958 | 77/18723 | 1.46e-04 | 1.18e-03 | 49 |
| GO:0061025 | Liver | HCC | membrane fusion | 88/7958 | 163/18723 | 1.98e-03 | 1.00e-02 | 88 |
| GO:0048278 | Liver | HCC | vesicle docking | 34/7958 | 59/18723 | 1.36e-02 | 4.84e-02 | 34 |
| Page: 1 2 3 4 5 6 7 |
| Pathway ID | Tissue | Disease Stage | Description | Gene Ratio | Bg Ratio | pvalue | p.adjust | qvalue | Count |
| hsa041305 | Esophagus | ESCC | SNARE interactions in vesicular transport | 28/4205 | 33/8465 | 2.75e-05 | 1.32e-04 | 6.75e-05 | 28 |
| hsa0413012 | Esophagus | ESCC | SNARE interactions in vesicular transport | 28/4205 | 33/8465 | 2.75e-05 | 1.32e-04 | 6.75e-05 | 28 |
| hsa041302 | Liver | HCC | SNARE interactions in vesicular transport | 25/4020 | 33/8465 | 8.78e-04 | 3.38e-03 | 1.88e-03 | 25 |
| hsa041303 | Liver | HCC | SNARE interactions in vesicular transport | 25/4020 | 33/8465 | 8.78e-04 | 3.38e-03 | 1.88e-03 | 25 |
| hsa041304 | Oral cavity | OSCC | SNARE interactions in vesicular transport | 28/3704 | 33/8465 | 1.31e-06 | 7.18e-06 | 3.66e-06 | 28 |
| hsa0413011 | Oral cavity | OSCC | SNARE interactions in vesicular transport | 28/3704 | 33/8465 | 1.31e-06 | 7.18e-06 | 3.66e-06 | 28 |
| hsa0413021 | Oral cavity | LP | SNARE interactions in vesicular transport | 22/2418 | 33/8465 | 6.00e-06 | 4.76e-05 | 3.07e-05 | 22 |
| hsa0413031 | Oral cavity | LP | SNARE interactions in vesicular transport | 22/2418 | 33/8465 | 6.00e-06 | 4.76e-05 | 3.07e-05 | 22 |
| Page: 1 |
Top |
Cell-cell communication analysis |
| Identification of potential cell-cell interactions between two cell types and their ligand-receptor pairs for different disease states |
| Ligand | Receptor | LRpair | Pathway | Tissue | Disease Stage |
| Page: 1 |
Top |
Single-cell gene regulatory network inference analysis |
| Find out the significant the regulons (TFs) and the target genes of each regulon across cell types for different disease states |
| TF | Cell Type | Tissue | Disease Stage | Target Gene | RSS | Regulon Activity |
| ∗The dot plots of a searched regulon are shown for all cell subpopulations in each disease state of each tissue based on the regulon specific score inferred using pySCENIC and by calculating the average expression. |
| Page: 1 |
Top |
Somatic mutation of malignant transformation related genes |
| Annotation of somatic variants for genes involved in malignant transformation |
| Hugo Symbol | Variant Class | Variant Classification | dbSNP RS | HGVSc | HGVSp | HGVSp Short | SWISSPROT | BIOTYPE | SIFT | PolyPhen | Tumor Sample Barcode | Tissue | Histology | Sex | Age | Stage | Therapy Types | Drugs | Outcome |
| YKT6 | SNV | Missense_Mutation | novel | c.491G>A | p.Gly164Asp | p.G164D | O15498 | protein_coding | deleterious(0.01) | probably_damaging(0.995) | TCGA-AN-A0FK-01 | Breast | breast invasive carcinoma | Female | >=65 | III/IV | Unknown | Unknown | SD |
| YKT6 | insertion | Nonsense_Mutation | novel | c.148_149insCCTTTGTATGA | p.Arg50ProfsTer4 | p.R50Pfs*4 | O15498 | protein_coding | TCGA-AN-A0FX-01 | Breast | breast invasive carcinoma | Female | <65 | I/II | Unknown | Unknown | SD | ||
| YKT6 | insertion | Nonsense_Mutation | novel | c.150_151insCATTTCCCACTTCTTTGTCTTGGATGAGCAGT | p.Ser51HisfsTer9 | p.S51Hfs*9 | O15498 | protein_coding | TCGA-AN-A0FX-01 | Breast | breast invasive carcinoma | Female | <65 | I/II | Unknown | Unknown | SD | ||
| YKT6 | SNV | Missense_Mutation | novel | c.457N>G | p.Leu153Val | p.L153V | O15498 | protein_coding | deleterious(0.02) | benign(0.029) | TCGA-MA-AA3Z-01 | Cervix | cervical & endocervical cancer | Female | <65 | I/II | Unknown | Unknown | SD |
| YKT6 | SNV | Missense_Mutation | rs780133803 | c.433G>A | p.Glu145Lys | p.E145K | O15498 | protein_coding | deleterious(0) | possibly_damaging(0.906) | TCGA-AG-A002-01 | Colorectum | rectum adenocarcinoma | Male | <65 | I/II | Unknown | Unknown | SD |
| YKT6 | SNV | Missense_Mutation | novel | c.316N>A | p.Asp106Asn | p.D106N | O15498 | protein_coding | tolerated(0.08) | benign(0.001) | TCGA-EI-6917-01 | Colorectum | rectum adenocarcinoma | Male | <65 | III/IV | Chemotherapy | 5fluorouracil+oxaciplatina+l-folinian | SD |
| YKT6 | SNV | Missense_Mutation | c.557A>C | p.Lys186Thr | p.K186T | O15498 | protein_coding | tolerated(0.32) | benign(0.158) | TCGA-AP-A056-01 | Endometrium | uterine corpus endometrioid carcinoma | Female | <65 | I/II | Unknown | Unknown | SD | |
| YKT6 | SNV | Missense_Mutation | c.331N>T | p.Pro111Ser | p.P111S | O15498 | protein_coding | tolerated(0.21) | benign(0.104) | TCGA-AP-A059-01 | Endometrium | uterine corpus endometrioid carcinoma | Female | >=65 | I/II | Unknown | Unknown | SD | |
| YKT6 | SNV | Missense_Mutation | novel | c.511G>A | p.Val171Met | p.V171M | O15498 | protein_coding | deleterious(0) | probably_damaging(0.997) | TCGA-B5-A5OC-01 | Endometrium | uterine corpus endometrioid carcinoma | Female | >=65 | III/IV | Chemotherapy | cisplatin | SD |
| YKT6 | SNV | Missense_Mutation | novel | c.512N>C | p.Val171Ala | p.V171A | O15498 | protein_coding | deleterious(0) | probably_damaging(0.996) | TCGA-D1-A175-01 | Endometrium | uterine corpus endometrioid carcinoma | Female | <65 | I/II | Chemotherapy | paclitaxel | SD |
| Page: 1 2 |
Top |
Related drugs of malignant transformation related genes |
| Identification of chemicals and drugs interact with genes involved in malignant transfromation |
| (DGIdb 4.0) |
| Entrez ID | Symbol | Category | Interaction Types | Drug Claim Name | Drug Name | PMIDs |
| Page: 1 |

Copyright 2023-Present -The University of Texas Health Science Center at Houston |