| Tissue | Expression Dynamics | Abbreviation |
| Colorectum (GSE201348) |  | FAP: Familial adenomatous polyposis |
| CRC: Colorectal cancer |
| Colorectum (HTA11) | 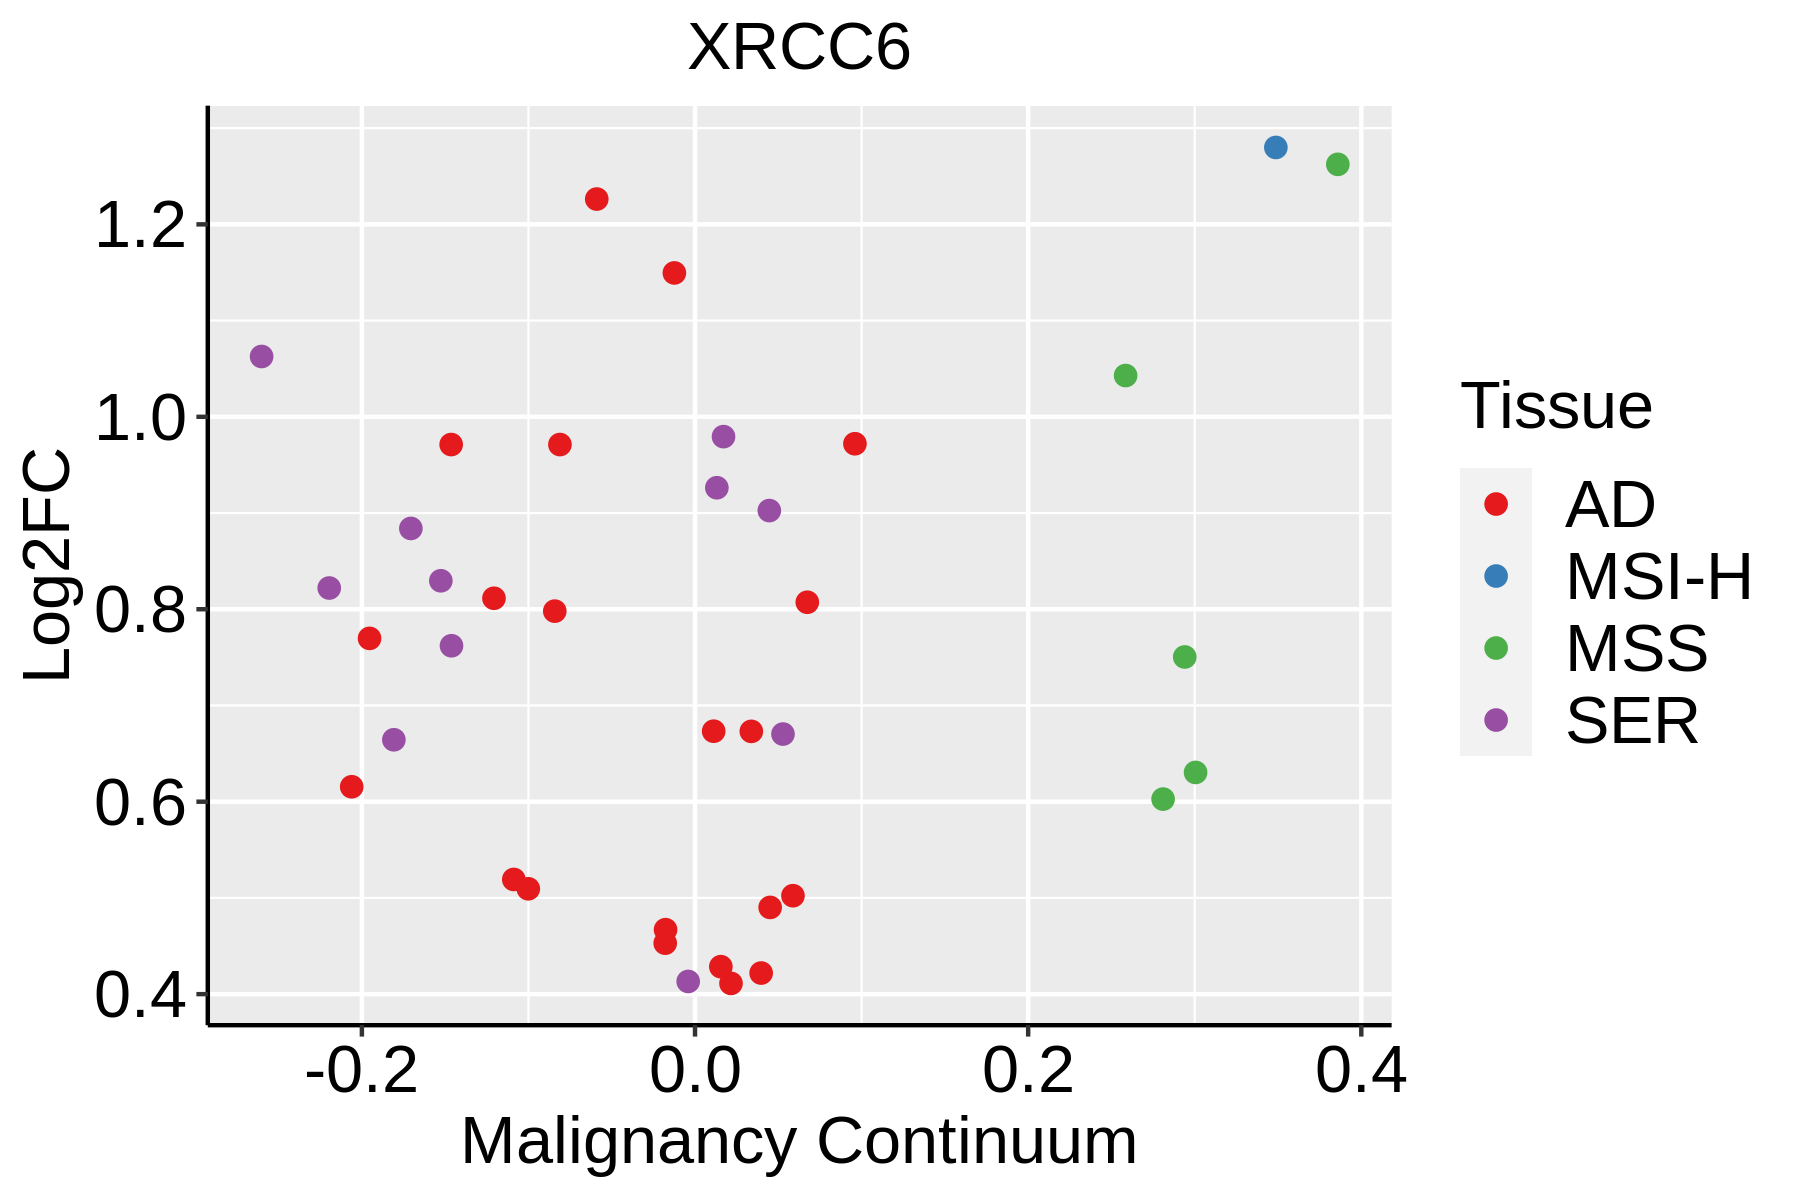 | AD: Adenomas |
| SER: Sessile serrated lesions |
| MSI-H: Microsatellite-high colorectal cancer |
| MSS: Microsatellite stable colorectal cancer |
| Endometrium |  | AEH: Atypical endometrial hyperplasia |
| EEC: Endometrioid Cancer |
| Esophagus |  | ESCC: Esophageal squamous cell carcinoma |
| HGIN: High-grade intraepithelial neoplasias |
| LGIN: Low-grade intraepithelial neoplasias |
| Liver | 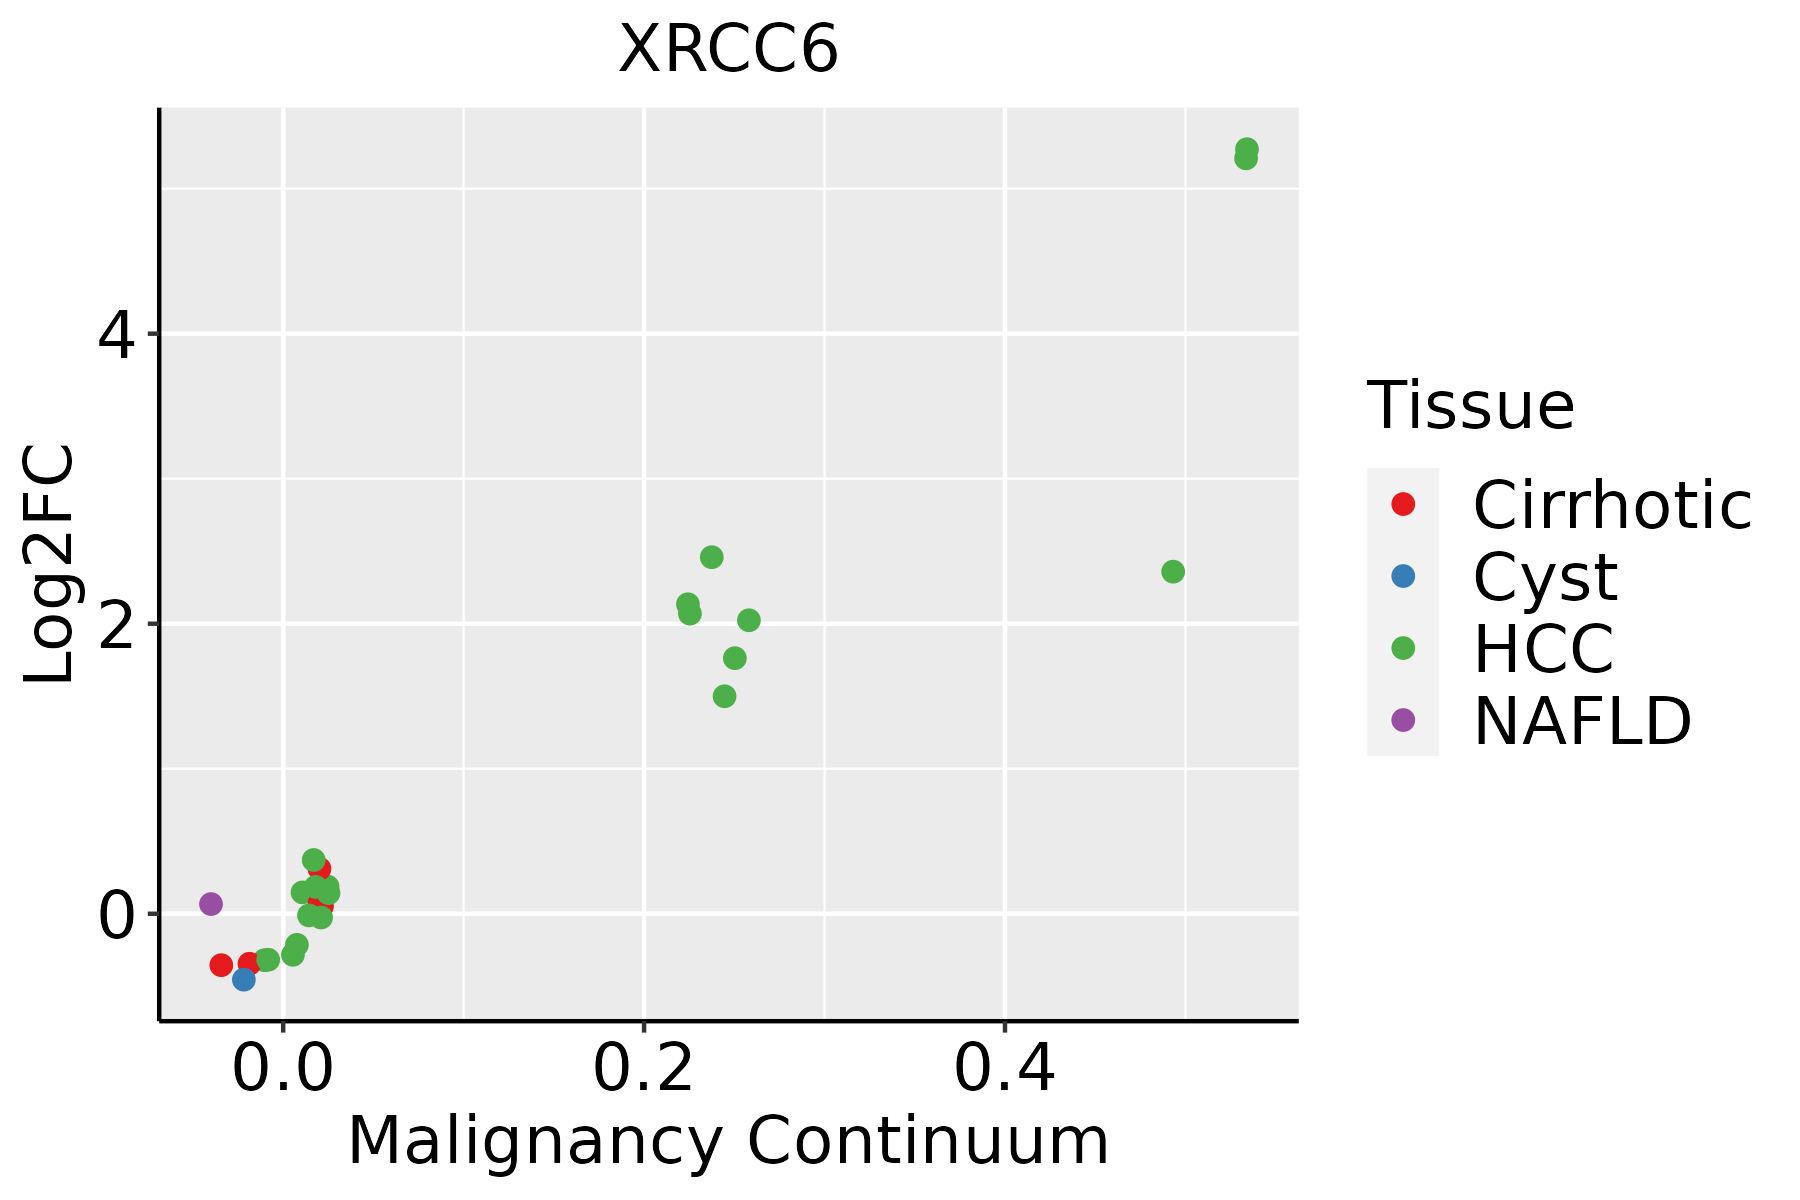 | HCC: Hepatocellular carcinoma |
| NAFLD: Non-alcoholic fatty liver disease |
| Oral Cavity |  | EOLP: Erosive Oral lichen planus |
| LP: leukoplakia |
| NEOLP: Non-erosive oral lichen planus |
| OSCC: Oral squamous cell carcinoma |
| Prostate | 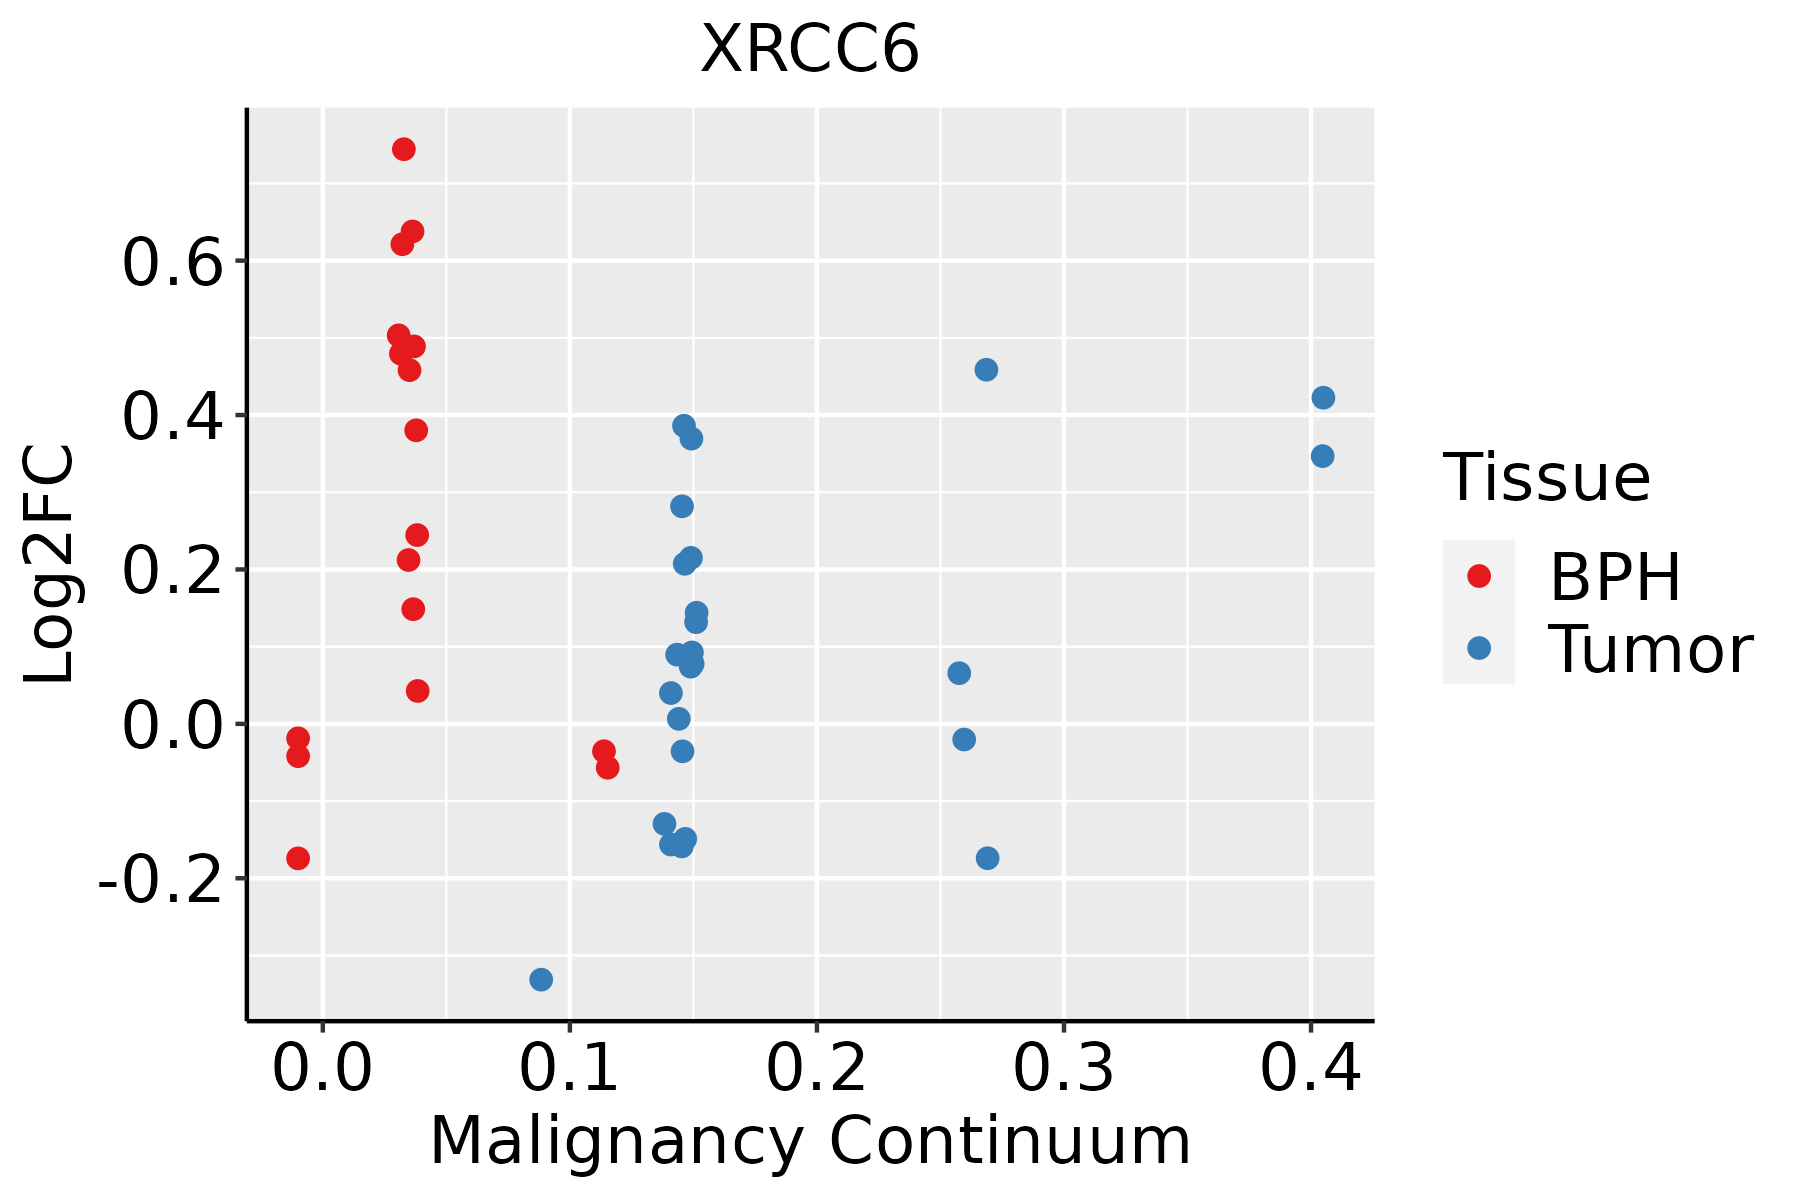 | BPH: Benign Prostatic Hyperplasia |
| Skin |  | AK: Actinic keratosis |
| cSCC: Cutaneous squamous cell carcinoma |
| SCCIS:squamous cell carcinoma in situ |
| Thyroid |  | ATC: Anaplastic thyroid cancer |
| HT: Hashimoto's thyroiditis |
| PTC: Papillary thyroid cancer |
| GO ID | Tissue | Disease Stage | Description | Gene Ratio | Bg Ratio | pvalue | p.adjust | Count |
| GO:00714722 | Colorectum | FAP | cellular response to salt stress | 6/2622 | 12/18723 | 3.24e-03 | 2.40e-02 | 6 |
| GO:1903131 | Colorectum | FAP | mononuclear cell differentiation | 79/2622 | 426/18723 | 5.00e-03 | 3.33e-02 | 79 |
| GO:00486601 | Colorectum | FAP | regulation of smooth muscle cell proliferation | 38/2622 | 180/18723 | 5.73e-03 | 3.67e-02 | 38 |
| GO:19037063 | Colorectum | FAP | regulation of hemopoiesis | 69/2622 | 367/18723 | 6.01e-03 | 3.78e-02 | 69 |
| GO:0071214 | Colorectum | FAP | cellular response to abiotic stimulus | 63/2622 | 331/18723 | 6.38e-03 | 3.99e-02 | 63 |
| GO:0104004 | Colorectum | FAP | cellular response to environmental stimulus | 63/2622 | 331/18723 | 6.38e-03 | 3.99e-02 | 63 |
| GO:00486591 | Colorectum | FAP | smooth muscle cell proliferation | 38/2622 | 184/18723 | 8.29e-03 | 4.85e-02 | 38 |
| GO:0071470 | Colorectum | FAP | cellular response to osmotic stress | 12/2622 | 41/18723 | 8.57e-03 | 4.96e-02 | 12 |
| GO:006219716 | Endometrium | AEH | cellular response to chemical stress | 71/2100 | 337/18723 | 1.03e-07 | 5.05e-06 | 71 |
| GO:00486604 | Endometrium | AEH | regulation of smooth muscle cell proliferation | 43/2100 | 180/18723 | 1.09e-06 | 3.68e-05 | 43 |
| GO:00486594 | Endometrium | AEH | smooth muscle cell proliferation | 43/2100 | 184/18723 | 2.04e-06 | 6.14e-05 | 43 |
| GO:00330022 | Endometrium | AEH | muscle cell proliferation | 51/2100 | 248/18723 | 1.26e-05 | 2.77e-04 | 51 |
| GO:003367414 | Endometrium | AEH | positive regulation of kinase activity | 78/2100 | 467/18723 | 2.03e-04 | 2.54e-03 | 78 |
| GO:00714799 | Endometrium | AEH | cellular response to ionizing radiation | 19/2100 | 72/18723 | 2.74e-04 | 3.14e-03 | 19 |
| GO:00458609 | Endometrium | AEH | positive regulation of protein kinase activity | 66/2100 | 386/18723 | 3.14e-04 | 3.53e-03 | 66 |
| GO:190370614 | Endometrium | AEH | regulation of hemopoiesis | 63/2100 | 367/18723 | 3.81e-04 | 4.10e-03 | 63 |
| GO:000072310 | Endometrium | AEH | telomere maintenance | 28/2100 | 131/18723 | 5.62e-04 | 5.62e-03 | 28 |
| GO:00714704 | Endometrium | AEH | cellular response to osmotic stress | 12/2100 | 41/18723 | 1.35e-03 | 1.14e-02 | 12 |
| GO:00714807 | Endometrium | AEH | cellular response to gamma radiation | 10/2100 | 31/18723 | 1.48e-03 | 1.23e-02 | 10 |
| GO:00321036 | Endometrium | AEH | positive regulation of response to external stimulus | 68/2100 | 427/18723 | 1.82e-03 | 1.44e-02 | 68 |
| Hugo Symbol | Variant Class | Variant Classification | dbSNP RS | HGVSc | HGVSp | HGVSp Short | SWISSPROT | BIOTYPE | SIFT | PolyPhen | Tumor Sample Barcode | Tissue | Histology | Sex | Age | Stage | Therapy Types | Drugs | Outcome |
| XRCC6 | SNV | Missense_Mutation | rs765303000 | c.344G>A | p.Arg115Gln | p.R115Q | P12956 | protein_coding | tolerated(0.15) | benign(0.121) | TCGA-AN-A046-01 | Breast | breast invasive carcinoma | Female | >=65 | I/II | Unknown | Unknown | SD |
| XRCC6 | SNV | Missense_Mutation | | c.31N>C | p.Glu11Gln | p.E11Q | P12956 | protein_coding | tolerated(0.1) | benign(0.043) | TCGA-C8-A12Q-01 | Breast | breast invasive carcinoma | Female | >=65 | III/IV | Unknown | Unknown | PD |
| XRCC6 | SNV | Missense_Mutation | | c.160N>A | p.Glu54Lys | p.E54K | P12956 | protein_coding | deleterious(0.04) | benign(0.127) | TCGA-C8-A12Q-01 | Breast | breast invasive carcinoma | Female | >=65 | III/IV | Unknown | Unknown | PD |
| XRCC6 | SNV | Missense_Mutation | | c.492N>C | p.Lys164Asn | p.K164N | P12956 | protein_coding | deleterious(0) | probably_damaging(0.923) | TCGA-C8-A1HM-01 | Breast | breast invasive carcinoma | Female | >=65 | I/II | Chemotherapy | doxorubicin | CR |
| XRCC6 | SNV | Missense_Mutation | | c.882A>T | p.Glu294Asp | p.E294D | P12956 | protein_coding | deleterious(0.02) | possibly_damaging(0.677) | TCGA-D8-A1XK-01 | Breast | breast invasive carcinoma | Female | <65 | I/II | Chemotherapy | doxorubicine+cyclophosphamide | SD |
| XRCC6 | SNV | Missense_Mutation | | c.1715N>T | p.Thr572Met | p.T572M | P12956 | protein_coding | deleterious(0.03) | benign(0.194) | TCGA-E9-A22H-01 | Breast | breast invasive carcinoma | Female | <65 | I/II | Chemotherapy | doxorubicin | SD |
| XRCC6 | SNV | Missense_Mutation | novel | c.535N>C | p.Asp179His | p.D179H | P12956 | protein_coding | deleterious(0) | probably_damaging(0.938) | TCGA-JL-A3YW-01 | Breast | breast invasive carcinoma | Female | <65 | I/II | Unknown | Unknown | SD |
| XRCC6 | insertion | Nonsense_Mutation | novel | c.1675_1676insGGCGCCTGTAGTCCCAACTACCTGGGAG | p.Tyr559TrpfsTer4 | p.Y559Wfs*4 | P12956 | protein_coding | | | TCGA-B6-A0RE-01 | Breast | breast invasive carcinoma | Female | <65 | I/II | Unknown | Unknown | SD |
| XRCC6 | insertion | Nonsense_Mutation | novel | c.1786_1787insCTCCATCTCAAAAATGATACAG | p.Lys596ThrfsTer6 | p.K596Tfs*6 | P12956 | protein_coding | | | TCGA-BH-A0E2-01 | Breast | breast invasive carcinoma | Female | <65 | III/IV | Chemotherapy | doxorubicin | SD |
| XRCC6 | SNV | Missense_Mutation | novel | c.1366N>G | p.Pro456Ala | p.P456A | P12956 | protein_coding | tolerated(0.53) | benign(0.018) | TCGA-VS-A8EL-01 | Cervix | cervical & endocervical cancer | Female | <65 | I/II | Chemotherapy | cisplatin | CR |


