
|
|||||
|
 | |
| |
| |
| |
| |
| |
|
Gene: UTP6 |
Gene summary for UTP6 |
| Gene information | Species | Human | Gene symbol | UTP6 | Gene ID | 55813 |
| Gene name | UTP6 small subunit processome component | |
| Gene Alias | C17orf40 | |
| Cytomap | 17q11.2 | |
| Gene Type | protein-coding | GO ID | GO:0000462 | UniProtAcc | Q9NYH9 |
Top |
Malignant transformation analysis |
| Identification of the aberrant gene expression in precancerous and cancerous lesions by comparing the gene expression of stem-like cells in diseased tissues with normal stem cells |
| Entrez ID | Symbol | Replicates | Species | Organ | Tissue | Adj P-value | Log2FC | Malignancy |
| 55813 | UTP6 | GSM5276934 | Human | Endometrium | EEC | 8.28e-11 | 3.58e-01 | -0.0913 |
| 55813 | UTP6 | GSM5276937 | Human | Endometrium | EEC | 5.13e-17 | 5.49e-01 | -0.0897 |
| 55813 | UTP6 | GSM6177620_NYU_UCEC1_lib1_lib1 | Human | Endometrium | EEC | 9.47e-07 | 2.23e-02 | -0.1869 |
| 55813 | UTP6 | GSM6177620_NYU_UCEC1_lib2_lib2 | Human | Endometrium | EEC | 7.60e-03 | -5.37e-02 | -0.1875 |
| 55813 | UTP6 | GSM6177620_NYU_UCEC1_lib3_lib3 | Human | Endometrium | EEC | 1.84e-06 | 5.30e-02 | -0.1883 |
| 55813 | UTP6 | GSM6177621_NYU_UCEC2_lib1_lib1 | Human | Endometrium | EEC | 2.16e-05 | 1.11e-01 | -0.1934 |
| 55813 | UTP6 | GSM6177622_NYU_UCEC3_lib1_lib1 | Human | Endometrium | EEC | 7.32e-07 | -6.00e-02 | -0.1917 |
| 55813 | UTP6 | GSM6177622_NYU_UCEC3_lib2_lib2 | Human | Endometrium | EEC | 5.63e-08 | -5.06e-03 | -0.1916 |
| 55813 | UTP6 | GSM6177623_NYU_UCEC3_Vis | Human | Endometrium | EEC | 1.68e-03 | 2.25e-01 | -0.1269 |
| 55813 | UTP6 | LZE4T | Human | Esophagus | ESCC | 7.34e-09 | 2.43e-01 | 0.0811 |
| 55813 | UTP6 | LZE7T | Human | Esophagus | ESCC | 3.41e-07 | 3.30e-01 | 0.0667 |
| 55813 | UTP6 | LZE8T | Human | Esophagus | ESCC | 2.56e-03 | 1.08e-01 | 0.067 |
| 55813 | UTP6 | LZE22T | Human | Esophagus | ESCC | 1.89e-03 | 1.89e-01 | 0.068 |
| 55813 | UTP6 | LZE24T | Human | Esophagus | ESCC | 1.96e-06 | 2.57e-01 | 0.0596 |
| 55813 | UTP6 | P2T-E | Human | Esophagus | ESCC | 1.95e-11 | 3.12e-01 | 0.1177 |
| 55813 | UTP6 | P4T-E | Human | Esophagus | ESCC | 3.35e-20 | 4.88e-01 | 0.1323 |
| 55813 | UTP6 | P5T-E | Human | Esophagus | ESCC | 3.78e-21 | 4.35e-01 | 0.1327 |
| 55813 | UTP6 | P8T-E | Human | Esophagus | ESCC | 4.61e-18 | 2.82e-01 | 0.0889 |
| 55813 | UTP6 | P9T-E | Human | Esophagus | ESCC | 6.11e-08 | 1.80e-01 | 0.1131 |
| 55813 | UTP6 | P10T-E | Human | Esophagus | ESCC | 3.41e-08 | 8.44e-02 | 0.116 |
| Page: 1 2 3 4 5 6 |
| Tissue | Expression Dynamics | Abbreviation |
| Endometrium |  | AEH: Atypical endometrial hyperplasia |
| EEC: Endometrioid Cancer | ||
| Esophagus | 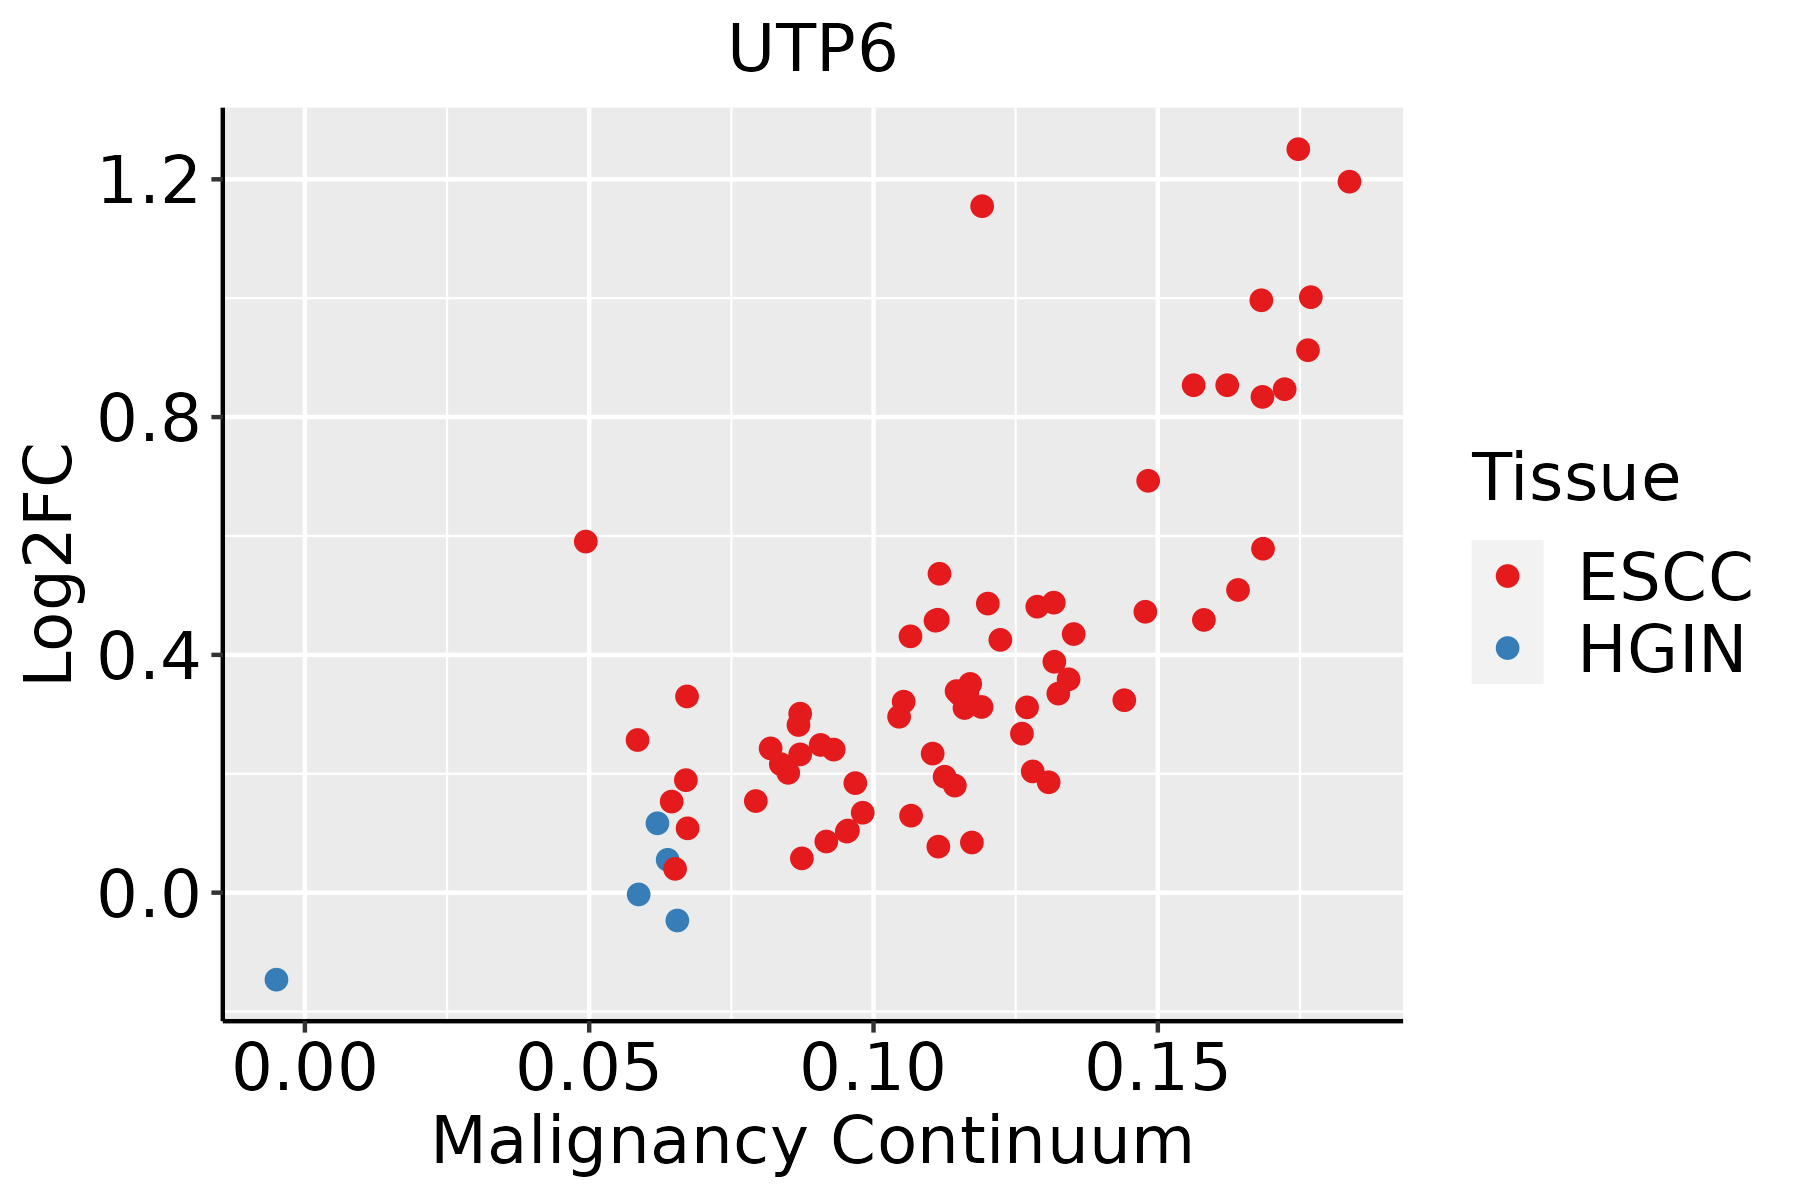 | ESCC: Esophageal squamous cell carcinoma |
| HGIN: High-grade intraepithelial neoplasias | ||
| LGIN: Low-grade intraepithelial neoplasias | ||
| Liver | 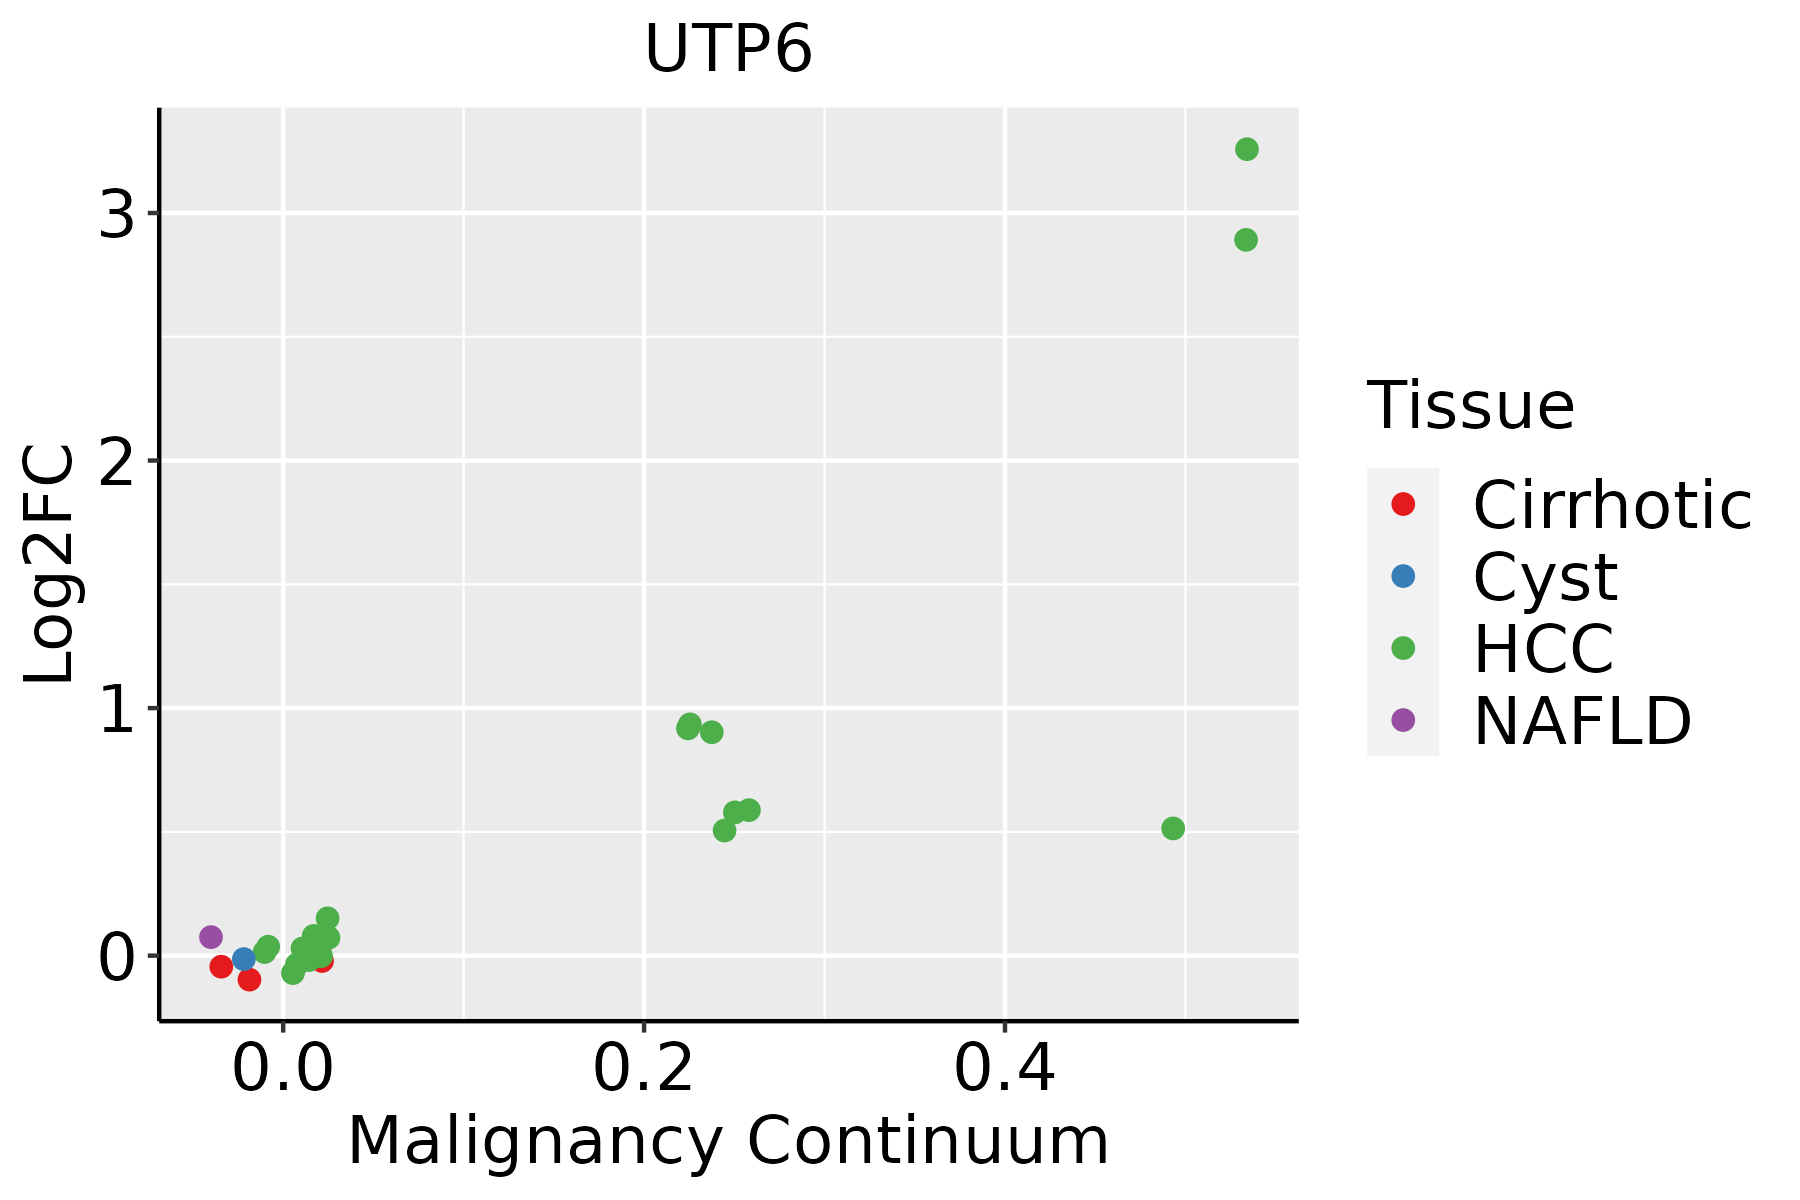 | HCC: Hepatocellular carcinoma |
| NAFLD: Non-alcoholic fatty liver disease | ||
| Oral Cavity |  | EOLP: Erosive Oral lichen planus |
| LP: leukoplakia | ||
| NEOLP: Non-erosive oral lichen planus | ||
| OSCC: Oral squamous cell carcinoma | ||
| Skin | 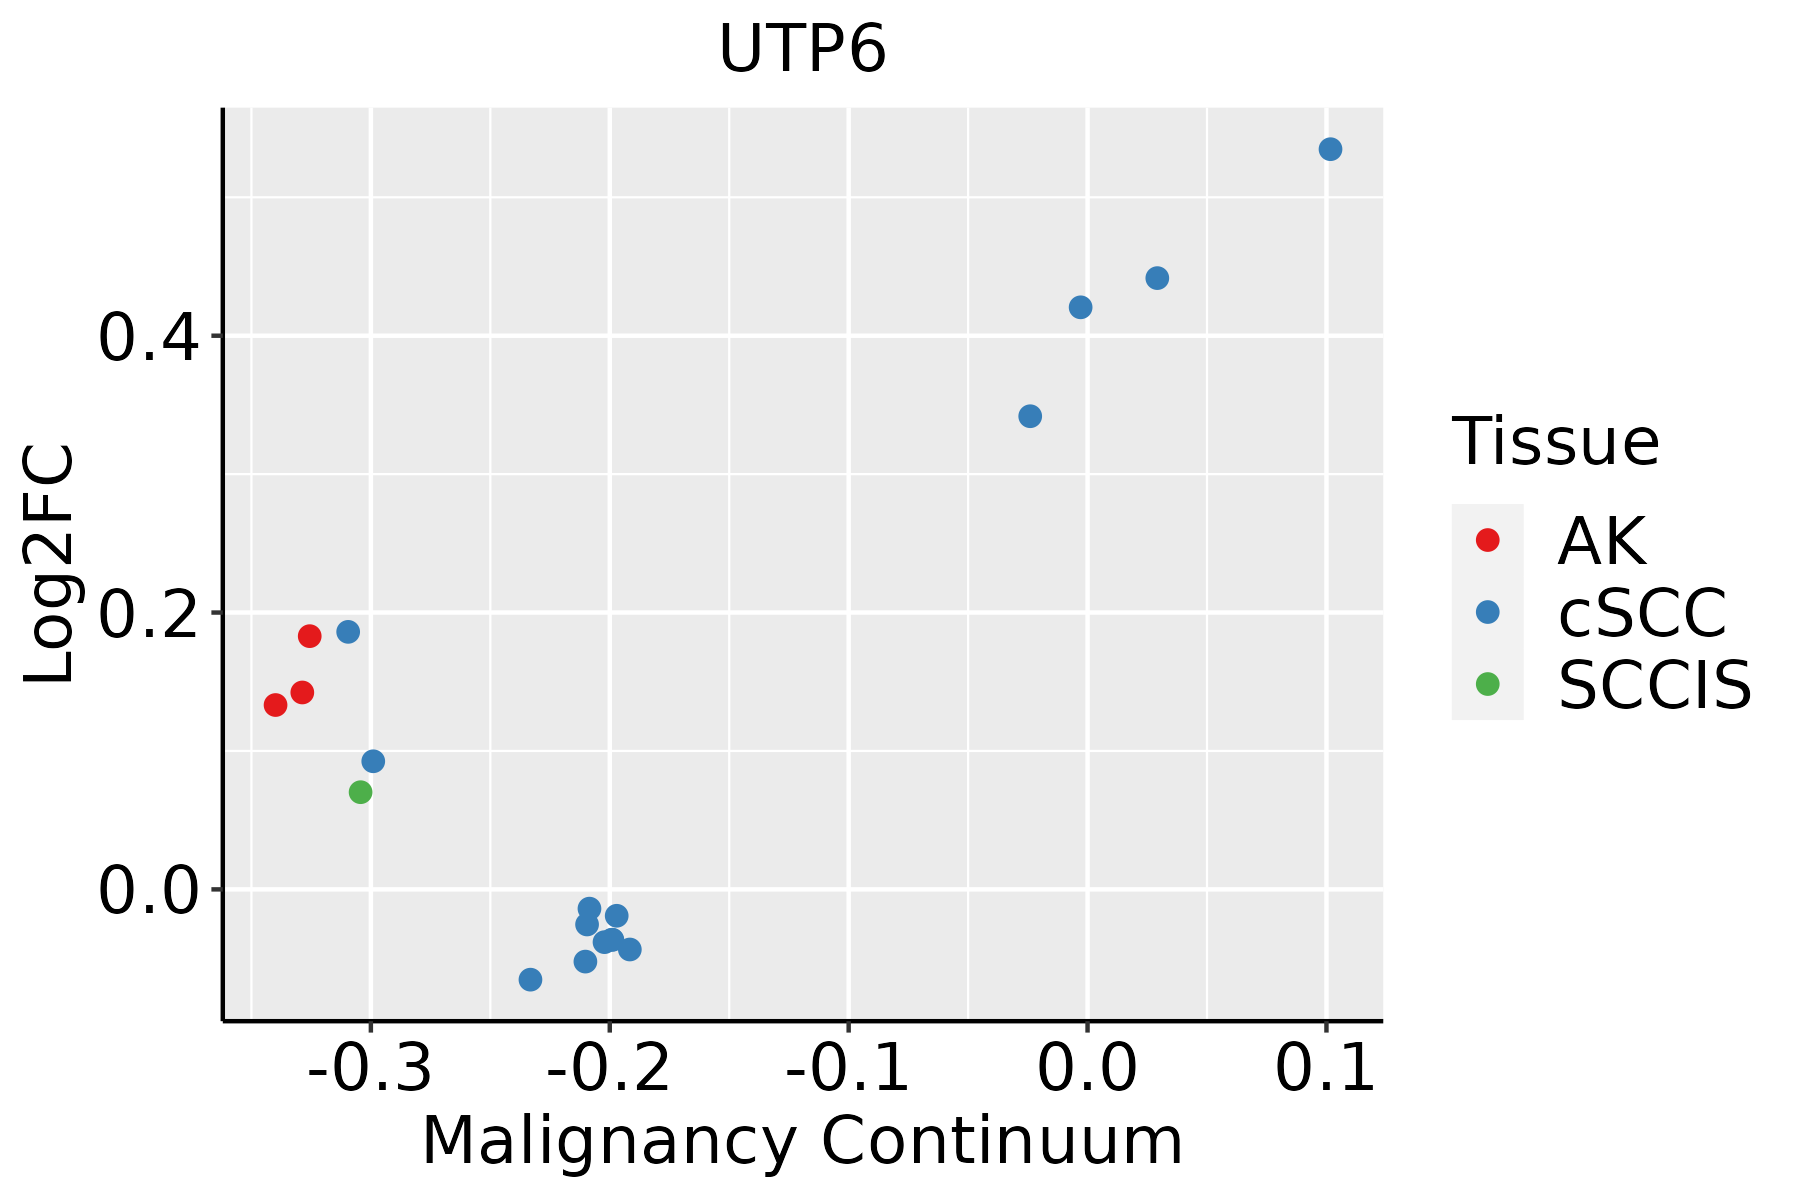 | AK: Actinic keratosis |
| cSCC: Cutaneous squamous cell carcinoma | ||
| SCCIS:squamous cell carcinoma in situ | ||
| Thyroid | 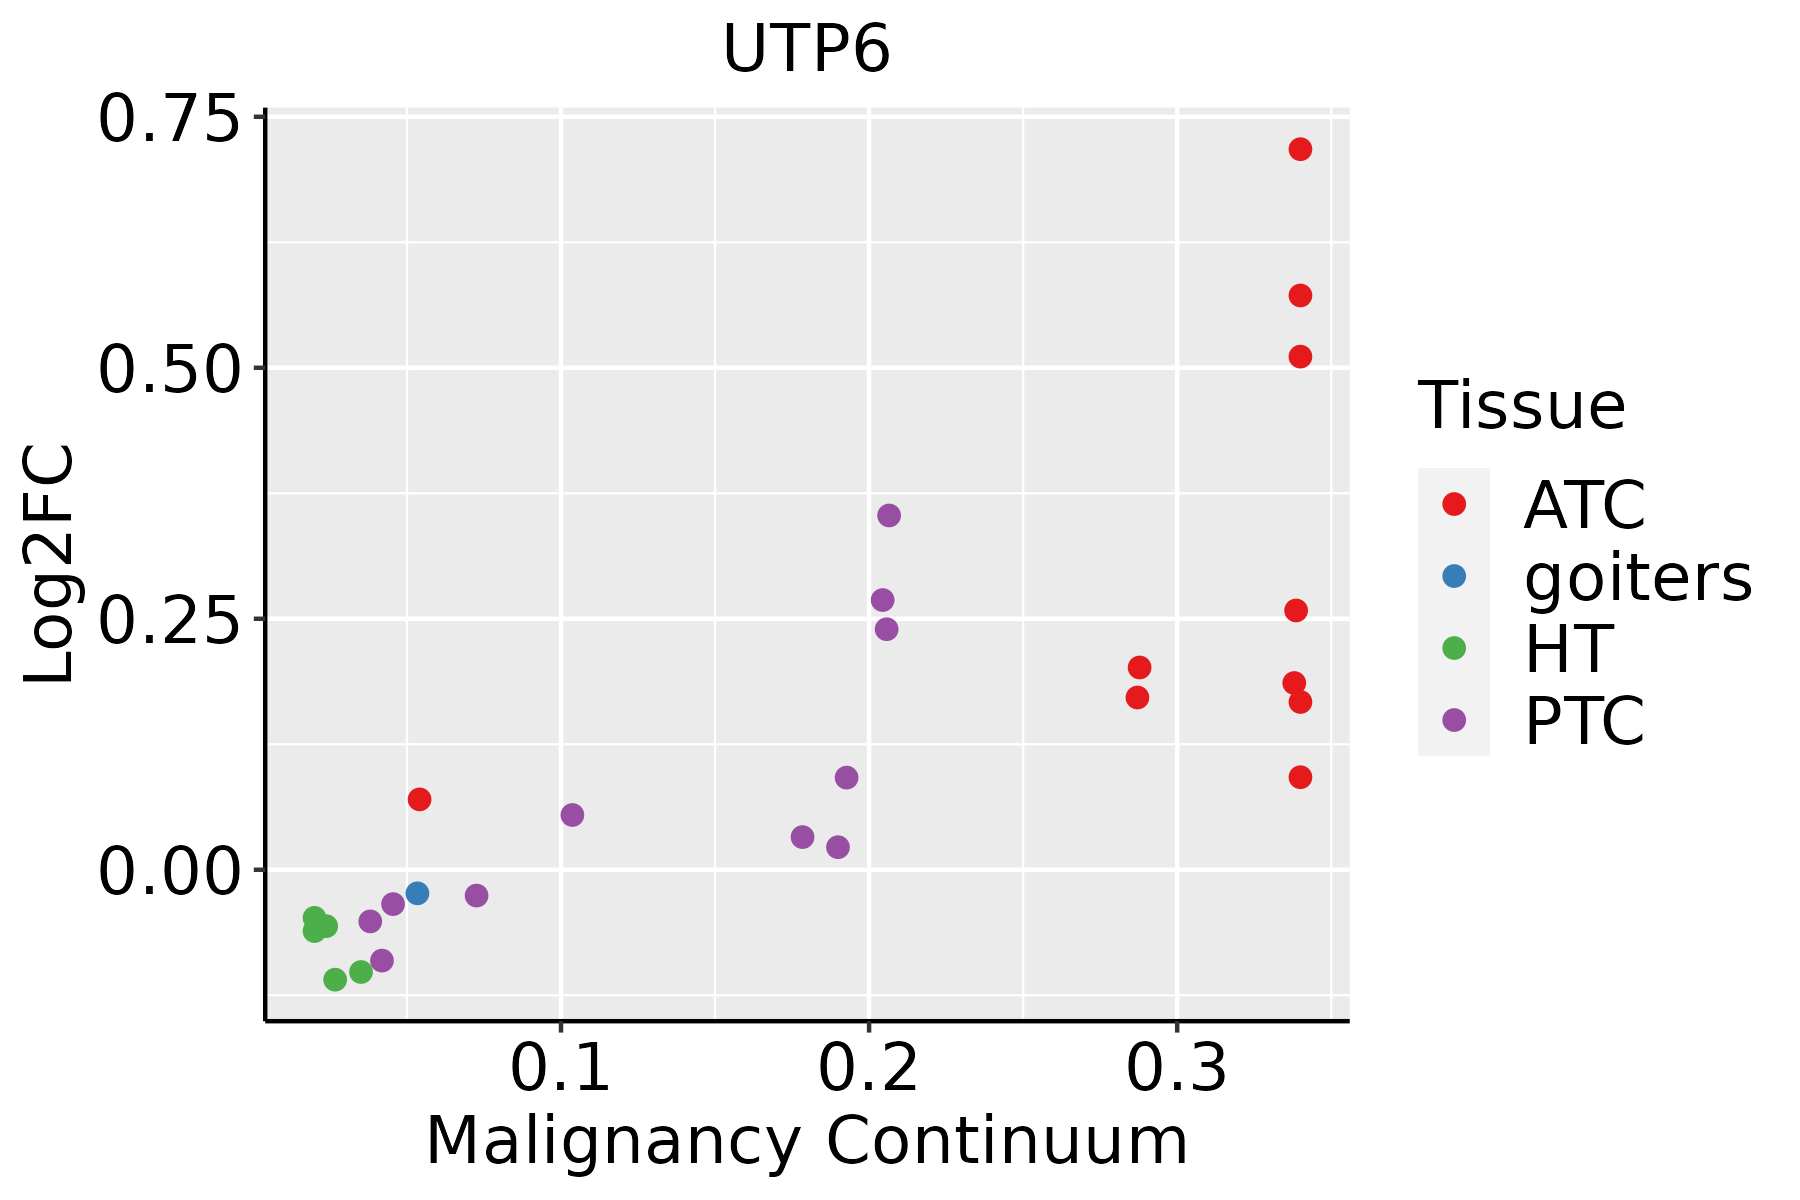 | ATC: Anaplastic thyroid cancer |
| HT: Hashimoto's thyroiditis | ||
| PTC: Papillary thyroid cancer |
| ∗log2FC in expression of this searched gene in stem-like cells from each diseased tissue sample relative to stem-like cells in normal samples in each tissue plotted against the malignancy continuum. Samples are colored based on if they are from different disease stage. |
Top |
Malignant transformation related pathway analysis |
| Find out the enriched GO biological processes and KEGG pathways involved in transition from healthy to precancer to cancer |
| Tissue | Disease Stage | Enriched GO biological Processes |
| Colorectum | AD |  |
| Colorectum | SER |  |
| Colorectum | MSS |  |
| Colorectum | MSI-H |  |
| Colorectum | FAP |  |
| ∗Top 15 enriched GO BP terms are showed in the bar plot of each disease state in each tissue. Each row represents a significant GO biological process which is colored according to the -log10(p.adjust). |
| Page: 1 2 3 4 5 6 7 8 9 |
| GO ID | Tissue | Disease Stage | Description | Gene Ratio | Bg Ratio | pvalue | p.adjust | Count |
| GO:000636424 | Skin | cSCC | rRNA processing | 156/4864 | 225/18723 | 1.42e-42 | 1.48e-39 | 156 |
| GO:001607224 | Skin | cSCC | rRNA metabolic process | 158/4864 | 236/18723 | 4.06e-40 | 2.83e-37 | 158 |
| GO:003447017 | Skin | cSCC | ncRNA processing | 215/4864 | 395/18723 | 6.83e-34 | 4.28e-31 | 215 |
| GO:003466013 | Skin | cSCC | ncRNA metabolic process | 234/4864 | 485/18723 | 1.37e-26 | 4.77e-24 | 234 |
| GO:004227429 | Skin | cSCC | ribosomal small subunit biogenesis | 59/4864 | 73/18723 | 1.39e-22 | 2.90e-20 | 59 |
| GO:003049012 | Skin | cSCC | maturation of SSU-rRNA | 39/4864 | 50/18723 | 2.04e-14 | 1.40e-12 | 39 |
| GO:000046212 | Skin | cSCC | maturation of SSU-rRNA from tricistronic rRNA transcript (SSU-rRNA, 5.8S rRNA, LSU-rRNA) | 26/4864 | 37/18723 | 2.11e-08 | 6.08e-07 | 26 |
| GO:0022613113 | Thyroid | PTC | ribonucleoprotein complex biogenesis | 292/5968 | 463/18723 | 3.24e-44 | 2.05e-40 | 292 |
| GO:0042254113 | Thyroid | PTC | ribosome biogenesis | 202/5968 | 299/18723 | 3.47e-37 | 5.47e-34 | 202 |
| GO:0006364112 | Thyroid | PTC | rRNA processing | 156/5968 | 225/18723 | 5.58e-31 | 5.03e-28 | 156 |
| GO:0016072112 | Thyroid | PTC | rRNA metabolic process | 160/5968 | 236/18723 | 5.68e-30 | 3.58e-27 | 160 |
| GO:003447018 | Thyroid | PTC | ncRNA processing | 215/5968 | 395/18723 | 7.14e-21 | 1.22e-18 | 215 |
| GO:00346608 | Thyroid | PTC | ncRNA metabolic process | 239/5968 | 485/18723 | 5.54e-16 | 4.26e-14 | 239 |
| GO:0042274113 | Thyroid | PTC | ribosomal small subunit biogenesis | 54/5968 | 73/18723 | 1.77e-13 | 9.28e-12 | 54 |
| GO:00304906 | Thyroid | PTC | maturation of SSU-rRNA | 34/5968 | 50/18723 | 1.69e-07 | 3.19e-06 | 34 |
| GO:00004625 | Thyroid | PTC | maturation of SSU-rRNA from tricistronic rRNA transcript (SSU-rRNA, 5.8S rRNA, LSU-rRNA) | 24/5968 | 37/18723 | 3.77e-05 | 3.48e-04 | 24 |
| GO:002261334 | Thyroid | ATC | ribonucleoprotein complex biogenesis | 292/6293 | 463/18723 | 3.05e-39 | 9.63e-36 | 292 |
| GO:004225434 | Thyroid | ATC | ribosome biogenesis | 203/6293 | 299/18723 | 3.63e-34 | 4.59e-31 | 203 |
| GO:000636432 | Thyroid | ATC | rRNA processing | 157/6293 | 225/18723 | 9.02e-29 | 5.70e-26 | 157 |
| GO:001607232 | Thyroid | ATC | rRNA metabolic process | 161/6293 | 236/18723 | 1.02e-27 | 5.89e-25 | 161 |
| Page: 1 2 3 4 |
| Pathway ID | Tissue | Disease Stage | Description | Gene Ratio | Bg Ratio | pvalue | p.adjust | qvalue | Count |
| Page: 1 |
Top |
Cell-cell communication analysis |
| Identification of potential cell-cell interactions between two cell types and their ligand-receptor pairs for different disease states |
| Ligand | Receptor | LRpair | Pathway | Tissue | Disease Stage |
| Page: 1 |
Top |
Single-cell gene regulatory network inference analysis |
| Find out the significant the regulons (TFs) and the target genes of each regulon across cell types for different disease states |
| TF | Cell Type | Tissue | Disease Stage | Target Gene | RSS | Regulon Activity |
| ∗The dot plots of a searched regulon are shown for all cell subpopulations in each disease state of each tissue based on the regulon specific score inferred using pySCENIC and by calculating the average expression. |
| Page: 1 |
Top |
Somatic mutation of malignant transformation related genes |
| Annotation of somatic variants for genes involved in malignant transformation |
| Hugo Symbol | Variant Class | Variant Classification | dbSNP RS | HGVSc | HGVSp | HGVSp Short | SWISSPROT | BIOTYPE | SIFT | PolyPhen | Tumor Sample Barcode | Tissue | Histology | Sex | Age | Stage | Therapy Types | Drugs | Outcome |
| UTP6 | SNV | Missense_Mutation | novel | c.748N>T | p.Asp250Tyr | p.D250Y | Q9NYH9 | protein_coding | deleterious(0) | probably_damaging(0.935) | TCGA-AN-A046-01 | Breast | breast invasive carcinoma | Female | >=65 | I/II | Unknown | Unknown | SD |
| UTP6 | SNV | Missense_Mutation | novel | c.1546N>G | p.Gln516Glu | p.Q516E | Q9NYH9 | protein_coding | tolerated(0.28) | benign(0.01) | TCGA-C8-A8HP-01 | Breast | breast invasive carcinoma | Female | <65 | III/IV | Chemotherapy | 5-fluorouracil | CR |
| UTP6 | insertion | Nonsense_Mutation | novel | c.844_845insAGAGACGGGGTTTCACTGTGTTGCCCA | p.Leu282delinsTer | p.L282delins* | Q9NYH9 | protein_coding | TCGA-AN-A0FV-01 | Breast | breast invasive carcinoma | Female | <65 | I/II | Unknown | Unknown | SD | ||
| UTP6 | SNV | Missense_Mutation | c.1784N>A | p.Gly595Asp | p.G595D | Q9NYH9 | protein_coding | deleterious(0) | possibly_damaging(0.867) | TCGA-A6-2686-01 | Colorectum | colon adenocarcinoma | Female | >=65 | I/II | Unknown | Unknown | SD | |
| UTP6 | SNV | Missense_Mutation | c.1103N>T | p.Ser368Leu | p.S368L | Q9NYH9 | protein_coding | tolerated(0.07) | benign(0.003) | TCGA-AA-3681-01 | Colorectum | colon adenocarcinoma | Female | >=65 | III/IV | Unknown | Unknown | SD | |
| UTP6 | SNV | Missense_Mutation | novel | c.202N>T | p.Ile68Phe | p.I68F | Q9NYH9 | protein_coding | deleterious(0) | probably_damaging(0.978) | TCGA-AA-3845-01 | Colorectum | colon adenocarcinoma | Female | >=65 | I/II | Unknown | Unknown | PD |
| UTP6 | SNV | Missense_Mutation | rs780260167 | c.500G>A | p.Arg167His | p.R167H | Q9NYH9 | protein_coding | deleterious(0) | probably_damaging(0.975) | TCGA-AA-3947-01 | Colorectum | colon adenocarcinoma | Female | <65 | I/II | Unknown | Unknown | SD |
| UTP6 | SNV | Missense_Mutation | rs765665411 | c.1457N>A | p.Arg486Gln | p.R486Q | Q9NYH9 | protein_coding | tolerated(0.18) | benign(0.012) | TCGA-AA-3984-01 | Colorectum | colon adenocarcinoma | Female | <65 | I/II | Unknown | Unknown | SD |
| UTP6 | SNV | Missense_Mutation | novel | c.316N>A | p.Asp106Asn | p.D106N | Q9NYH9 | protein_coding | deleterious(0) | possibly_damaging(0.839) | TCGA-AZ-4315-01 | Colorectum | colon adenocarcinoma | Male | <65 | I/II | Unknown | Unknown | SD |
| UTP6 | SNV | Missense_Mutation | c.890N>A | p.Ala297Asp | p.A297D | Q9NYH9 | protein_coding | tolerated(0.49) | benign(0.059) | TCGA-AZ-6598-01 | Colorectum | colon adenocarcinoma | Female | >=65 | I/II | Unknown | Unknown | SD |
| Page: 1 2 3 4 5 6 |
Top |
Related drugs of malignant transformation related genes |
| Identification of chemicals and drugs interact with genes involved in malignant transfromation |
| (DGIdb 4.0) |
| Entrez ID | Symbol | Category | Interaction Types | Drug Claim Name | Drug Name | PMIDs |
| Page: 1 |

Copyright 2023-Present -The University of Texas Health Science Center at Houston |