
|
|||||
|
 | |
| |
| |
| |
| |
| |
|
Gene: UNG |
Gene summary for UNG |
| Gene information | Species | Human | Gene symbol | UNG | Gene ID | 7374 |
| Gene name | uracil DNA glycosylase | |
| Gene Alias | DGU | |
| Cytomap | 12q24.11 | |
| Gene Type | protein-coding | GO ID | GO:0001775 | UniProtAcc | E5KTA6 |
Top |
Malignant transformation analysis |
| Identification of the aberrant gene expression in precancerous and cancerous lesions by comparing the gene expression of stem-like cells in diseased tissues with normal stem cells |
| Entrez ID | Symbol | Replicates | Species | Organ | Tissue | Adj P-value | Log2FC | Malignancy |
| 7374 | UNG | HTA11_7696_3000711011 | Human | Colorectum | AD | 5.27e-05 | 2.36e-01 | 0.0674 |
| 7374 | UNG | HTA11_99999970781_79442 | Human | Colorectum | MSS | 3.35e-09 | 3.39e-01 | 0.294 |
| 7374 | UNG | HTA11_99999971662_82457 | Human | Colorectum | MSS | 2.69e-03 | 2.27e-01 | 0.3859 |
| 7374 | UNG | LZE2T | Human | Esophagus | ESCC | 5.25e-04 | 4.16e-01 | 0.082 |
| 7374 | UNG | LZE4T | Human | Esophagus | ESCC | 2.28e-07 | 2.99e-01 | 0.0811 |
| 7374 | UNG | LZE7T | Human | Esophagus | ESCC | 7.83e-07 | 7.24e-01 | 0.0667 |
| 7374 | UNG | LZE20T | Human | Esophagus | ESCC | 4.92e-03 | 4.34e-02 | 0.0662 |
| 7374 | UNG | LZE24T | Human | Esophagus | ESCC | 3.36e-09 | 3.22e-01 | 0.0596 |
| 7374 | UNG | LZE6T | Human | Esophagus | ESCC | 3.73e-02 | 3.53e-01 | 0.0845 |
| 7374 | UNG | P1T-E | Human | Esophagus | ESCC | 1.67e-03 | 3.96e-01 | 0.0875 |
| 7374 | UNG | P2T-E | Human | Esophagus | ESCC | 2.20e-52 | 1.37e+00 | 0.1177 |
| 7374 | UNG | P4T-E | Human | Esophagus | ESCC | 6.96e-25 | 7.55e-01 | 0.1323 |
| 7374 | UNG | P5T-E | Human | Esophagus | ESCC | 2.87e-14 | 4.66e-01 | 0.1327 |
| 7374 | UNG | P8T-E | Human | Esophagus | ESCC | 1.18e-21 | 6.02e-01 | 0.0889 |
| 7374 | UNG | P9T-E | Human | Esophagus | ESCC | 5.41e-07 | 1.29e-01 | 0.1131 |
| 7374 | UNG | P10T-E | Human | Esophagus | ESCC | 4.10e-16 | 4.85e-01 | 0.116 |
| 7374 | UNG | P11T-E | Human | Esophagus | ESCC | 1.24e-13 | 7.09e-01 | 0.1426 |
| 7374 | UNG | P12T-E | Human | Esophagus | ESCC | 2.63e-16 | 3.42e-01 | 0.1122 |
| 7374 | UNG | P15T-E | Human | Esophagus | ESCC | 1.60e-15 | 5.14e-01 | 0.1149 |
| 7374 | UNG | P16T-E | Human | Esophagus | ESCC | 9.14e-27 | 6.76e-01 | 0.1153 |
| Page: 1 2 3 4 5 |
| Tissue | Expression Dynamics | Abbreviation |
| Colorectum (GSE201348) |  | FAP: Familial adenomatous polyposis |
| CRC: Colorectal cancer | ||
| Colorectum (HTA11) |  | AD: Adenomas |
| SER: Sessile serrated lesions | ||
| MSI-H: Microsatellite-high colorectal cancer | ||
| MSS: Microsatellite stable colorectal cancer | ||
| Esophagus | 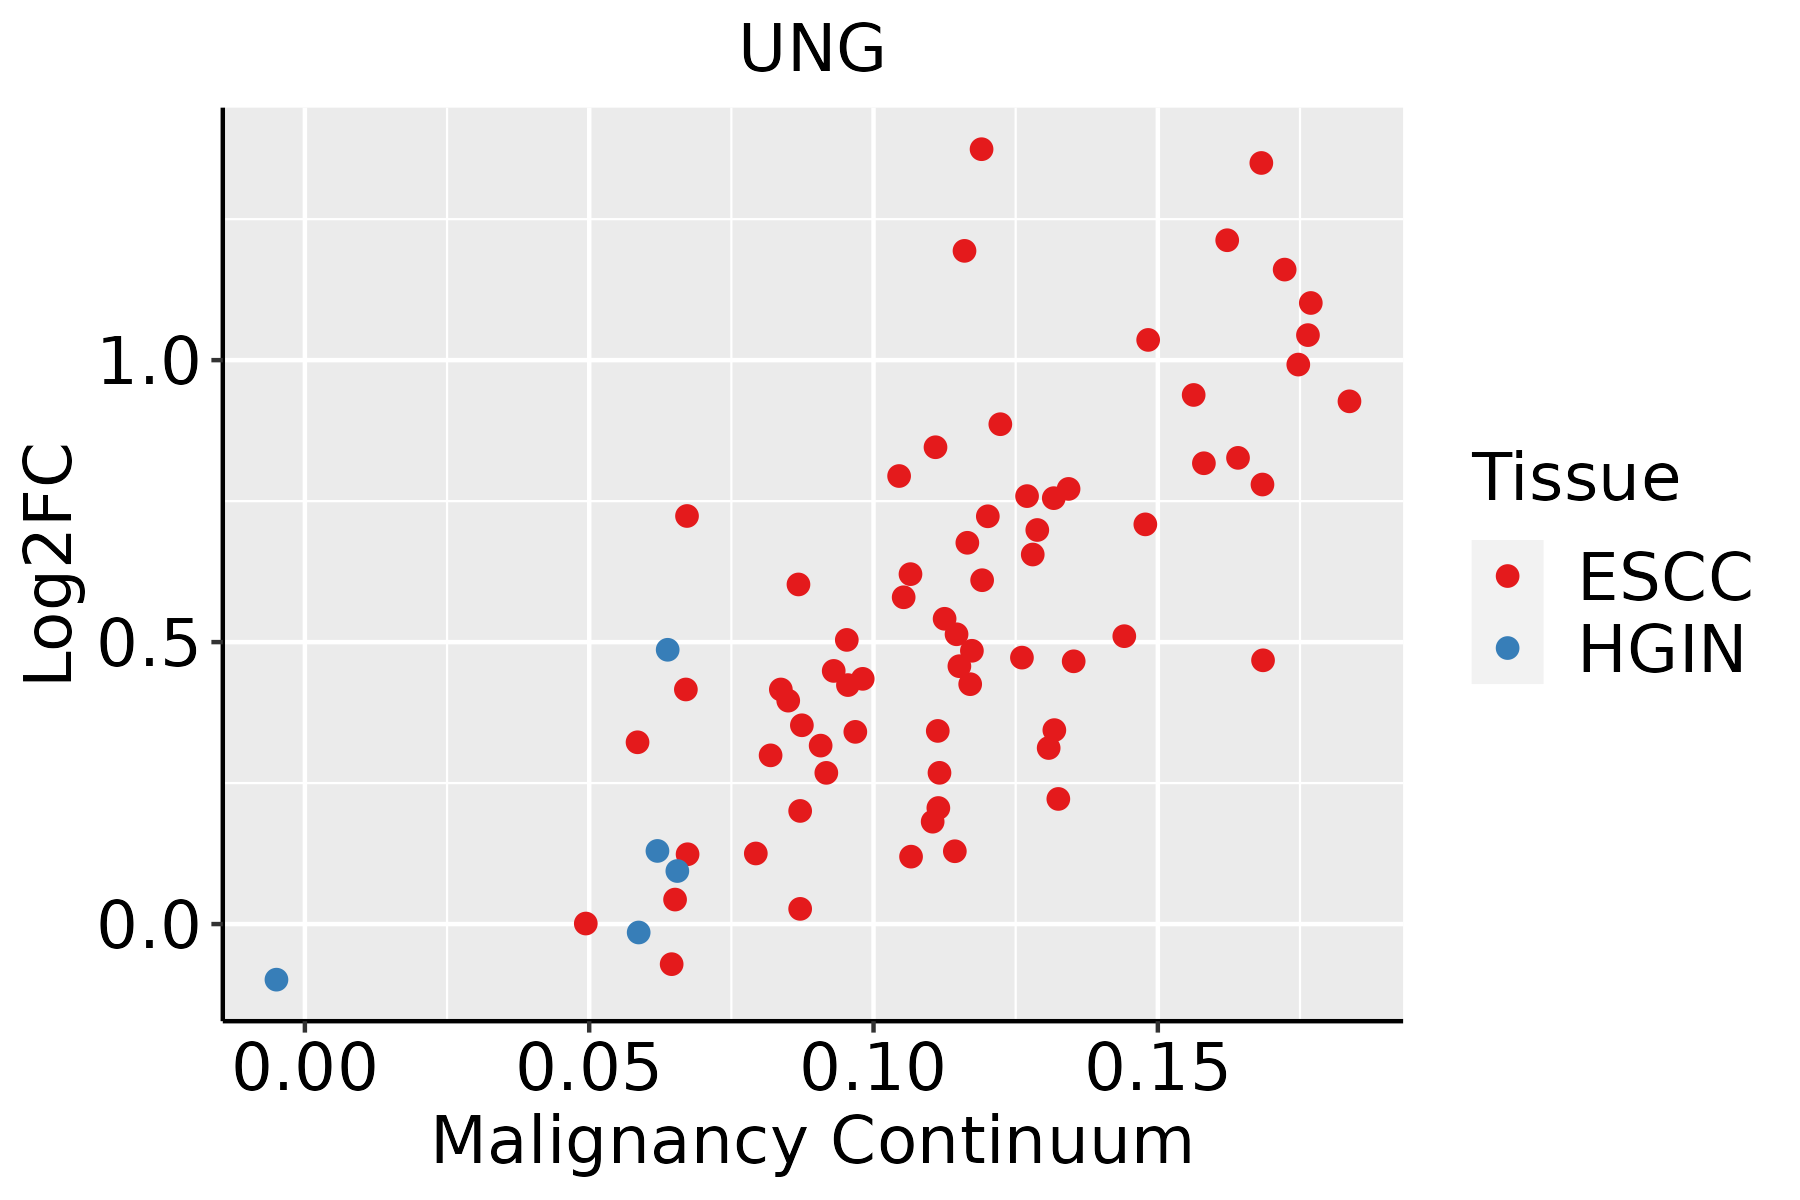 | ESCC: Esophageal squamous cell carcinoma |
| HGIN: High-grade intraepithelial neoplasias | ||
| LGIN: Low-grade intraepithelial neoplasias | ||
| Liver | 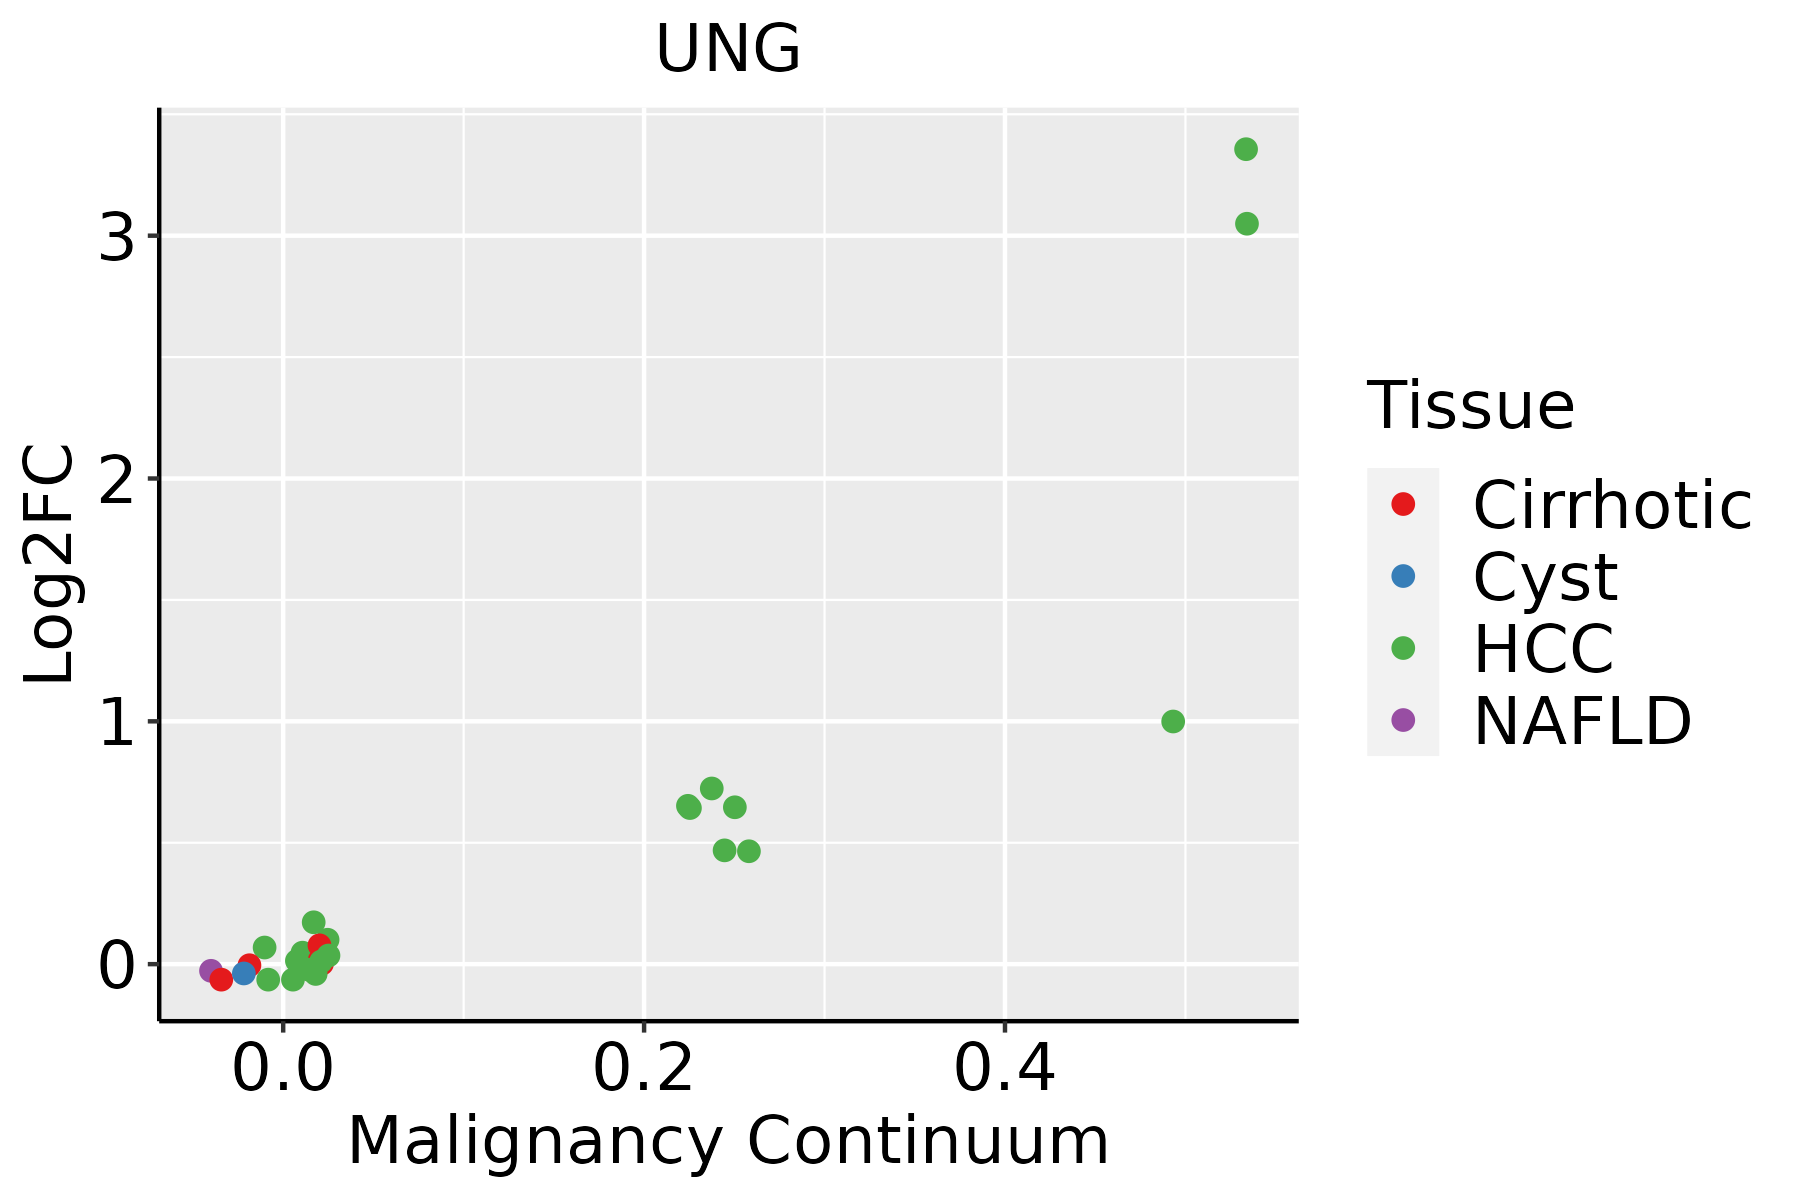 | HCC: Hepatocellular carcinoma |
| NAFLD: Non-alcoholic fatty liver disease | ||
| Oral Cavity | 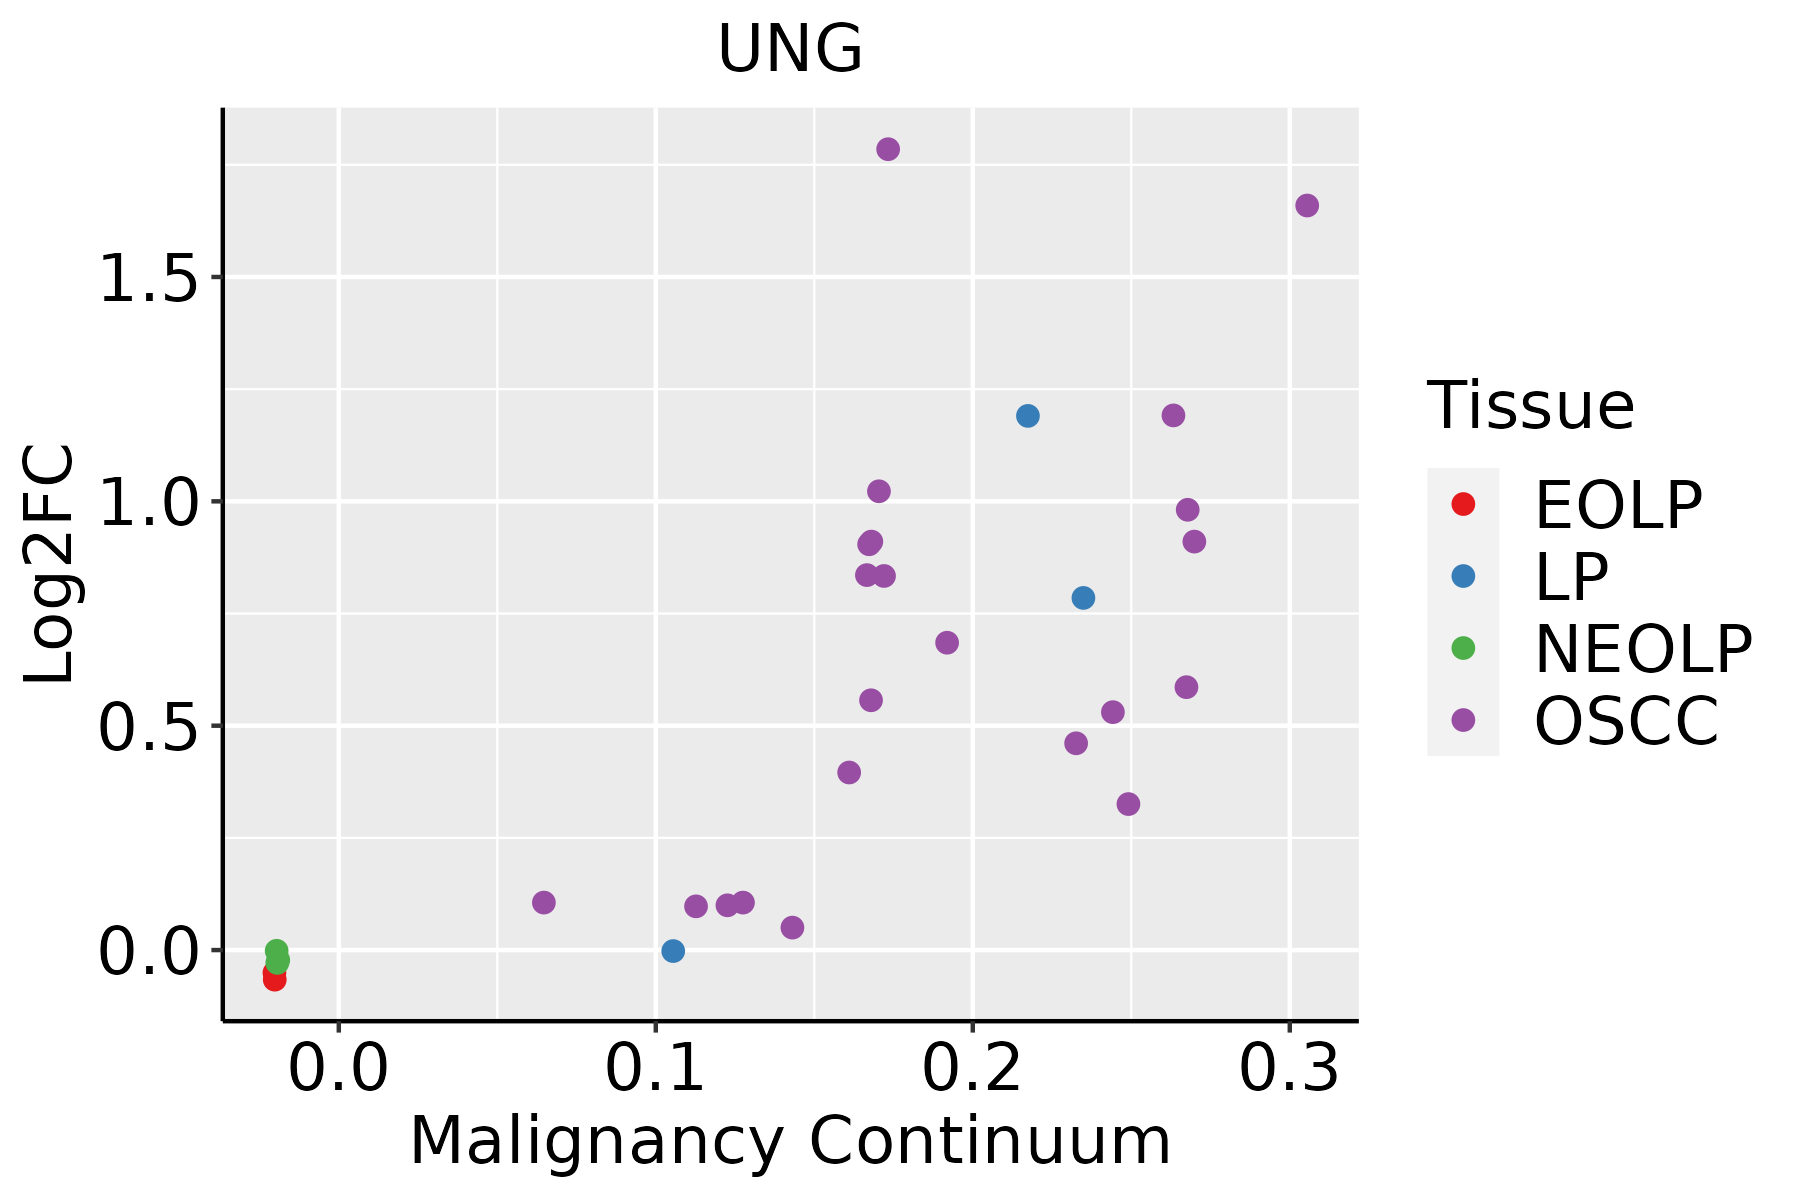 | EOLP: Erosive Oral lichen planus |
| LP: leukoplakia | ||
| NEOLP: Non-erosive oral lichen planus | ||
| OSCC: Oral squamous cell carcinoma | ||
| Skin |  | AK: Actinic keratosis |
| cSCC: Cutaneous squamous cell carcinoma | ||
| SCCIS:squamous cell carcinoma in situ |
| ∗log2FC in expression of this searched gene in stem-like cells from each diseased tissue sample relative to stem-like cells in normal samples in each tissue plotted against the malignancy continuum. Samples are colored based on if they are from different disease stage. |
Top |
Malignant transformation related pathway analysis |
| Find out the enriched GO biological processes and KEGG pathways involved in transition from healthy to precancer to cancer |
| Tissue | Disease Stage | Enriched GO biological Processes |
| Colorectum | AD |  |
| Colorectum | SER |  |
| Colorectum | MSS |  |
| Colorectum | MSI-H |  |
| Colorectum | FAP |  |
| ∗Top 15 enriched GO BP terms are showed in the bar plot of each disease state in each tissue. Each row represents a significant GO biological process which is colored according to the -log10(p.adjust). |
| Page: 1 2 3 4 5 6 7 8 9 |
| GO ID | Tissue | Disease Stage | Description | Gene Ratio | Bg Ratio | pvalue | p.adjust | Count |
| GO:004427021 | Liver | HCC | cellular nitrogen compound catabolic process | 303/7958 | 451/18723 | 9.76e-27 | 3.64e-24 | 303 |
| GO:004670021 | Liver | HCC | heterocycle catabolic process | 299/7958 | 445/18723 | 2.07e-26 | 7.29e-24 | 299 |
| GO:190136121 | Liver | HCC | organic cyclic compound catabolic process | 325/7958 | 495/18723 | 6.52e-26 | 2.18e-23 | 325 |
| GO:001943921 | Liver | HCC | aromatic compound catabolic process | 309/7958 | 467/18723 | 1.56e-25 | 4.94e-23 | 309 |
| GO:003465521 | Liver | HCC | nucleobase-containing compound catabolic process | 273/7958 | 407/18723 | 4.84e-24 | 1.23e-21 | 273 |
| GO:000911722 | Liver | HCC | nucleotide metabolic process | 300/7958 | 489/18723 | 1.61e-17 | 1.71e-15 | 300 |
| GO:000675322 | Liver | HCC | nucleoside phosphate metabolic process | 304/7958 | 497/18723 | 1.78e-17 | 1.85e-15 | 304 |
| GO:00062201 | Liver | HCC | pyrimidine nucleotide metabolic process | 36/7958 | 50/18723 | 2.28e-05 | 2.41e-04 | 36 |
| GO:1901136 | Liver | HCC | carbohydrate derivative catabolic process | 98/7958 | 172/18723 | 8.71e-05 | 7.62e-04 | 98 |
| GO:00464342 | Liver | HCC | organophosphate catabolic process | 89/7958 | 155/18723 | 1.24e-04 | 1.03e-03 | 89 |
| GO:00092621 | Liver | HCC | deoxyribonucleotide metabolic process | 31/7958 | 44/18723 | 1.63e-04 | 1.30e-03 | 31 |
| GO:00092191 | Liver | HCC | pyrimidine deoxyribonucleotide metabolic process | 19/7958 | 24/18723 | 2.80e-04 | 2.02e-03 | 19 |
| GO:00093941 | Liver | HCC | 2'-deoxyribonucleotide metabolic process | 28/7958 | 40/18723 | 4.01e-04 | 2.71e-03 | 28 |
| GO:00196921 | Liver | HCC | deoxyribose phosphate metabolic process | 29/7958 | 42/18723 | 4.57e-04 | 3.04e-03 | 29 |
| GO:00725271 | Liver | HCC | pyrimidine-containing compound metabolic process | 49/7958 | 82/18723 | 1.20e-03 | 6.68e-03 | 49 |
| GO:19012921 | Liver | HCC | nucleoside phosphate catabolic process | 49/7958 | 83/18723 | 1.73e-03 | 9.02e-03 | 49 |
| GO:00092641 | Liver | HCC | deoxyribonucleotide catabolic process | 21/7958 | 30/18723 | 2.15e-03 | 1.08e-02 | 21 |
| GO:00091661 | Liver | HCC | nucleotide catabolic process | 43/7958 | 73/18723 | 3.43e-03 | 1.55e-02 | 43 |
| GO:00463861 | Liver | HCC | deoxyribose phosphate catabolic process | 21/7958 | 31/18723 | 4.01e-03 | 1.76e-02 | 21 |
| GO:0006284 | Liver | HCC | base-excision repair | 27/7958 | 43/18723 | 5.79e-03 | 2.40e-02 | 27 |
| Page: 1 2 3 4 5 6 |
| Pathway ID | Tissue | Disease Stage | Description | Gene Ratio | Bg Ratio | pvalue | p.adjust | qvalue | Count |
| hsa034104 | Esophagus | ESCC | Base excision repair | 38/4205 | 44/8465 | 3.59e-07 | 2.62e-06 | 1.34e-06 | 38 |
| hsa0341011 | Esophagus | ESCC | Base excision repair | 38/4205 | 44/8465 | 3.59e-07 | 2.62e-06 | 1.34e-06 | 38 |
| hsa03410 | Oral cavity | OSCC | Base excision repair | 32/3704 | 44/8465 | 9.11e-05 | 3.25e-04 | 1.65e-04 | 32 |
| hsa034101 | Oral cavity | OSCC | Base excision repair | 32/3704 | 44/8465 | 9.11e-05 | 3.25e-04 | 1.65e-04 | 32 |
| hsa034102 | Oral cavity | LP | Base excision repair | 23/2418 | 44/8465 | 7.66e-04 | 3.75e-03 | 2.42e-03 | 23 |
| hsa034103 | Oral cavity | LP | Base excision repair | 23/2418 | 44/8465 | 7.66e-04 | 3.75e-03 | 2.42e-03 | 23 |
| Page: 1 |
Top |
Cell-cell communication analysis |
| Identification of potential cell-cell interactions between two cell types and their ligand-receptor pairs for different disease states |
| Ligand | Receptor | LRpair | Pathway | Tissue | Disease Stage |
| Page: 1 |
Top |
Single-cell gene regulatory network inference analysis |
| Find out the significant the regulons (TFs) and the target genes of each regulon across cell types for different disease states |
| TF | Cell Type | Tissue | Disease Stage | Target Gene | RSS | Regulon Activity |
| ∗The dot plots of a searched regulon are shown for all cell subpopulations in each disease state of each tissue based on the regulon specific score inferred using pySCENIC and by calculating the average expression. |
| Page: 1 |
Top |
Somatic mutation of malignant transformation related genes |
| Annotation of somatic variants for genes involved in malignant transformation |
| Hugo Symbol | Variant Class | Variant Classification | dbSNP RS | HGVSc | HGVSp | HGVSp Short | SWISSPROT | BIOTYPE | SIFT | PolyPhen | Tumor Sample Barcode | Tissue | Histology | Sex | Age | Stage | Therapy Types | Drugs | Outcome |
| UNG | insertion | Frame_Shift_Ins | novel | c.531_532insCTTGATCTCAGGAATTTGAGACCAGCCTCAGCAACATA | p.Ser178LeufsTer13 | p.S178Lfs*13 | P13051 | protein_coding | TCGA-AQ-A04J-01 | Breast | breast invasive carcinoma | Female | <65 | I/II | Chemotherapy | cytoxan | SD | ||
| UNG | SNV | Missense_Mutation | c.487N>T | p.His163Tyr | p.H163Y | P13051 | protein_coding | deleterious(0) | probably_damaging(0.999) | TCGA-C5-A1BK-01 | Cervix | cervical & endocervical cancer | Female | <65 | I/II | Unknown | Unknown | SD | |
| UNG | SNV | Missense_Mutation | c.296N>T | p.Lys99Met | p.K99M | P13051 | protein_coding | tolerated(0.23) | benign(0.044) | TCGA-AA-A010-01 | Colorectum | colon adenocarcinoma | Female | <65 | I/II | Chemotherapy | folinic | CR | |
| UNG | SNV | Missense_Mutation | c.640N>A | p.Ala214Thr | p.A214T | P13051 | protein_coding | tolerated(0.51) | benign(0.228) | TCGA-CM-6171-01 | Colorectum | colon adenocarcinoma | Female | >=65 | I/II | Unknown | Unknown | SD | |
| UNG | SNV | Missense_Mutation | rs143034537 | c.805N>T | p.Arg269Trp | p.R269W | P13051 | protein_coding | deleterious(0) | probably_damaging(0.978) | TCGA-DM-A280-01 | Colorectum | colon adenocarcinoma | Female | >=65 | I/II | Unknown | Unknown | SD |
| UNG | insertion | Frame_Shift_Ins | novel | c.309_310insG | p.Glu105GlyfsTer38 | p.E105Gfs*38 | P13051 | protein_coding | TCGA-A6-5665-01 | Colorectum | colon adenocarcinoma | Female | >=65 | I/II | Unknown | Unknown | PD | ||
| UNG | insertion | Nonsense_Mutation | novel | c.685_686insTAAATCCAT | p.Arg229delinsLeuAsnProTer | p.R229delinsLNP* | P13051 | protein_coding | TCGA-AM-5820-01 | Colorectum | colon adenocarcinoma | Female | <65 | I/II | Unknown | Unknown | SD | ||
| UNG | SNV | Missense_Mutation | rs143034537 | c.805N>T | p.Arg269Trp | p.R269W | P13051 | protein_coding | deleterious(0) | probably_damaging(0.978) | TCGA-A5-A0GH-01 | Endometrium | uterine corpus endometrioid carcinoma | Female | <65 | I/II | Unknown | Unknown | SD |
| UNG | SNV | Missense_Mutation | novel | c.38C>A | p.Pro13His | p.P13H | P13051 | protein_coding | deleterious(0) | possibly_damaging(0.557) | TCGA-AJ-A2QO-01 | Endometrium | uterine corpus endometrioid carcinoma | Female | >=65 | I/II | Unknown | Unknown | SD |
| UNG | SNV | Missense_Mutation | novel | c.346N>A | p.Gly116Arg | p.G116R | P13051 | protein_coding | tolerated(0.24) | benign(0.001) | TCGA-AJ-A3EK-01 | Endometrium | uterine corpus endometrioid carcinoma | Female | <65 | I/II | Chemotherapy | carboplatin | CR |
| Page: 1 2 3 |
Top |
Related drugs of malignant transformation related genes |
| Identification of chemicals and drugs interact with genes involved in malignant transfromation |
| (DGIdb 4.0) |
| Entrez ID | Symbol | Category | Interaction Types | Drug Claim Name | Drug Name | PMIDs |
| Page: 1 |

Copyright 2023-Present -The University of Texas Health Science Center at Houston |