
|
|||||
|
 | |
| |
| |
| |
| |
| |
|
Gene: UCK2 |
Gene summary for UCK2 |
| Gene information | Species | Human | Gene symbol | UCK2 | Gene ID | 7371 |
| Gene name | uridine-cytidine kinase 2 | |
| Gene Alias | TSA903 | |
| Cytomap | 1q24.1 | |
| Gene Type | protein-coding | GO ID | GO:0006139 | UniProtAcc | A0A024R912 |
Top |
Malignant transformation analysis |
| Identification of the aberrant gene expression in precancerous and cancerous lesions by comparing the gene expression of stem-like cells in diseased tissues with normal stem cells |
| Entrez ID | Symbol | Replicates | Species | Organ | Tissue | Adj P-value | Log2FC | Malignancy |
| 7371 | UCK2 | CCI_1 | Human | Cervix | CC | 9.37e-07 | 5.87e-01 | 0.528 |
| 7371 | UCK2 | CCI_2 | Human | Cervix | CC | 2.74e-07 | 8.45e-01 | 0.5249 |
| 7371 | UCK2 | CCI_3 | Human | Cervix | CC | 3.48e-06 | 4.63e-01 | 0.516 |
| 7371 | UCK2 | HTA11_347_2000001011 | Human | Colorectum | AD | 8.03e-03 | 2.93e-01 | -0.1954 |
| 7371 | UCK2 | HTA11_99999974143_84620 | Human | Colorectum | MSS | 9.79e-07 | -3.10e-01 | 0.3005 |
| 7371 | UCK2 | A002-C-010 | Human | Colorectum | FAP | 1.83e-02 | -2.22e-01 | 0.242 |
| 7371 | UCK2 | A001-C-207 | Human | Colorectum | FAP | 3.82e-03 | -2.52e-01 | 0.1278 |
| 7371 | UCK2 | A015-C-203 | Human | Colorectum | FAP | 1.69e-25 | -4.70e-01 | -0.1294 |
| 7371 | UCK2 | A015-C-204 | Human | Colorectum | FAP | 4.49e-05 | -3.26e-01 | -0.0228 |
| 7371 | UCK2 | A002-C-201 | Human | Colorectum | FAP | 1.42e-11 | -3.62e-01 | 0.0324 |
| 7371 | UCK2 | A002-C-203 | Human | Colorectum | FAP | 2.69e-05 | -2.14e-01 | 0.2786 |
| 7371 | UCK2 | A001-C-119 | Human | Colorectum | FAP | 1.74e-06 | -4.60e-01 | -0.1557 |
| 7371 | UCK2 | A001-C-108 | Human | Colorectum | FAP | 2.71e-23 | -4.73e-01 | -0.0272 |
| 7371 | UCK2 | A002-C-205 | Human | Colorectum | FAP | 8.16e-19 | -4.98e-01 | -0.1236 |
| 7371 | UCK2 | A001-C-104 | Human | Colorectum | FAP | 2.33e-09 | -3.67e-01 | 0.0184 |
| 7371 | UCK2 | A015-C-005 | Human | Colorectum | FAP | 5.22e-05 | -3.95e-01 | -0.0336 |
| 7371 | UCK2 | A015-C-006 | Human | Colorectum | FAP | 9.31e-13 | -5.07e-01 | -0.0994 |
| 7371 | UCK2 | A015-C-106 | Human | Colorectum | FAP | 8.34e-15 | -3.14e-01 | -0.0511 |
| 7371 | UCK2 | A002-C-114 | Human | Colorectum | FAP | 7.66e-17 | -5.37e-01 | -0.1561 |
| 7371 | UCK2 | A015-C-104 | Human | Colorectum | FAP | 1.58e-31 | -5.48e-01 | -0.1899 |
| Page: 1 2 3 4 5 6 7 |
| Tissue | Expression Dynamics | Abbreviation |
| Cervix | 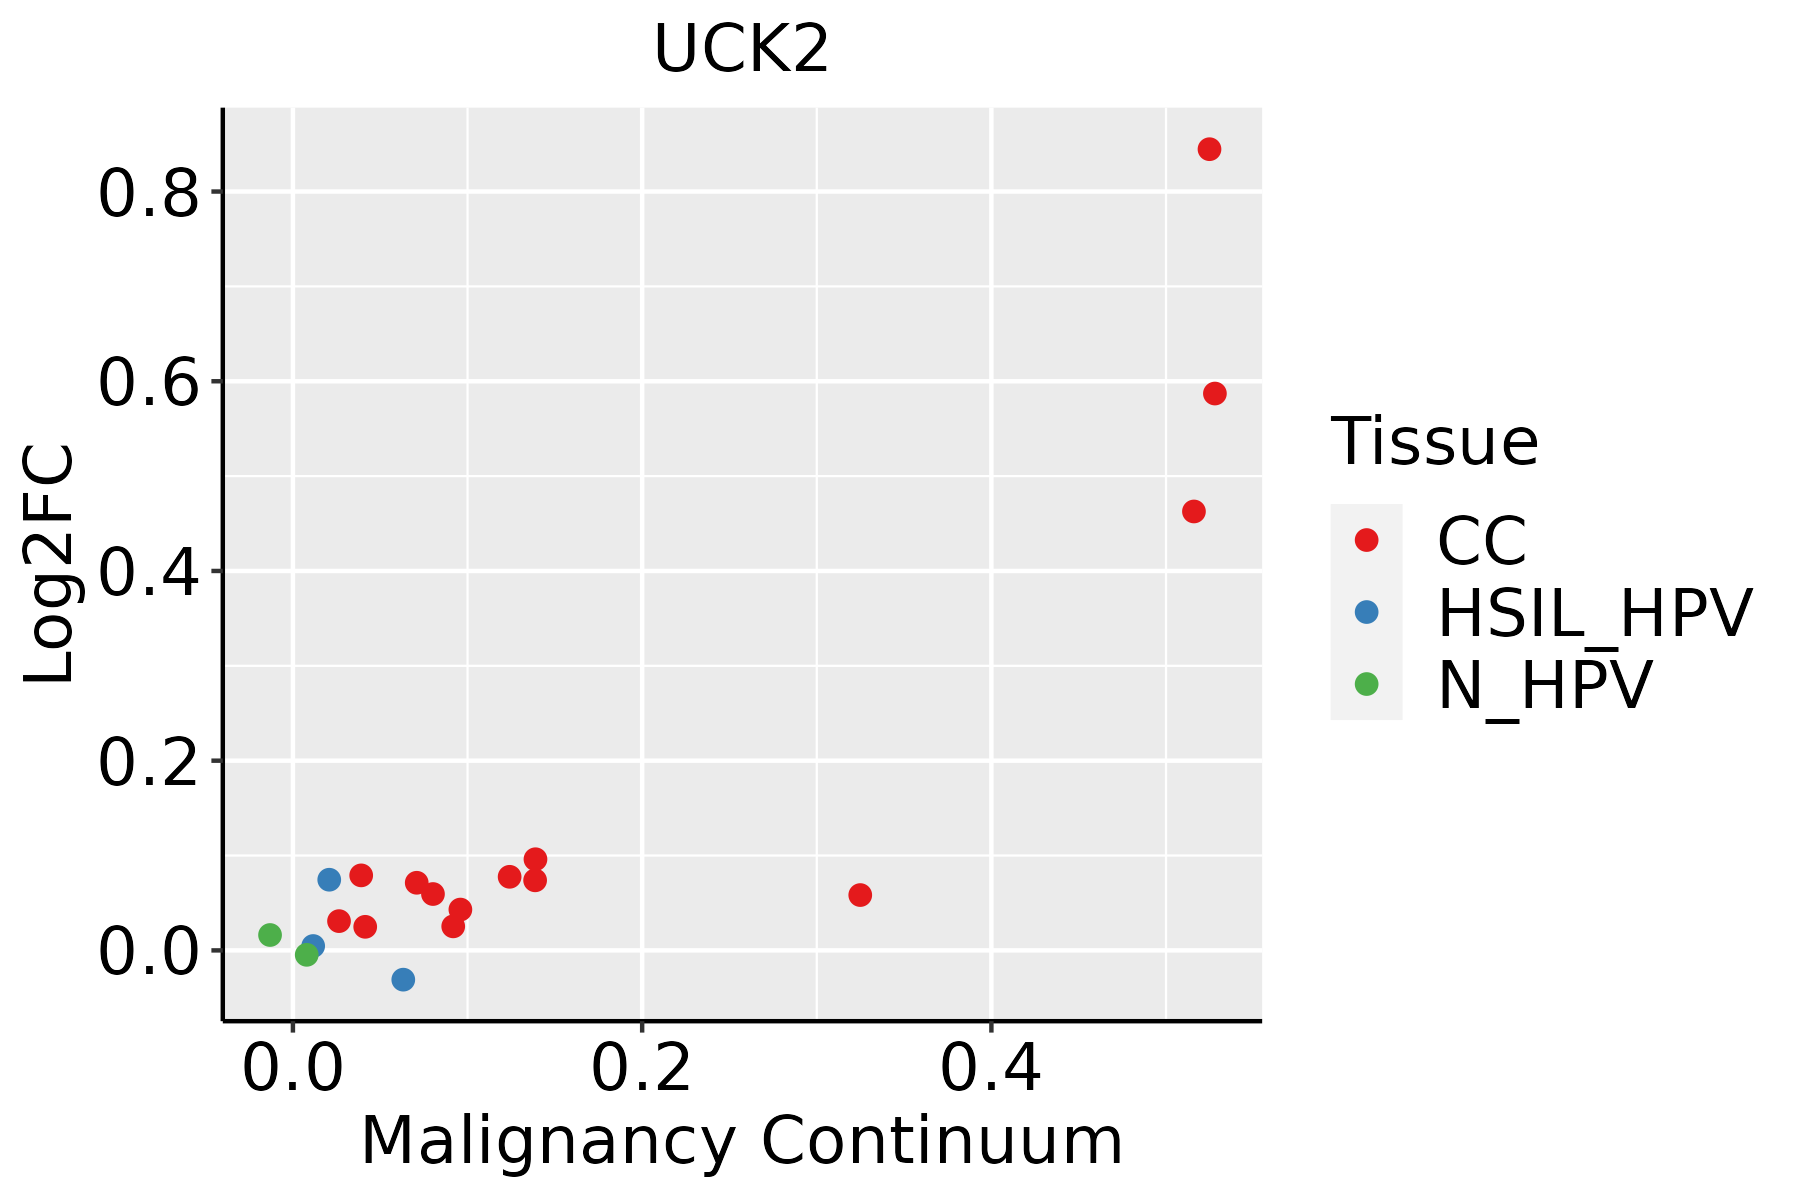 | CC: Cervix cancer |
| HSIL_HPV: HPV-infected high-grade squamous intraepithelial lesions | ||
| N_HPV: HPV-infected normal cervix | ||
| Colorectum (GSE201348) |  | FAP: Familial adenomatous polyposis |
| CRC: Colorectal cancer | ||
| Colorectum (HTA11) |  | AD: Adenomas |
| SER: Sessile serrated lesions | ||
| MSI-H: Microsatellite-high colorectal cancer | ||
| MSS: Microsatellite stable colorectal cancer | ||
| Esophagus | 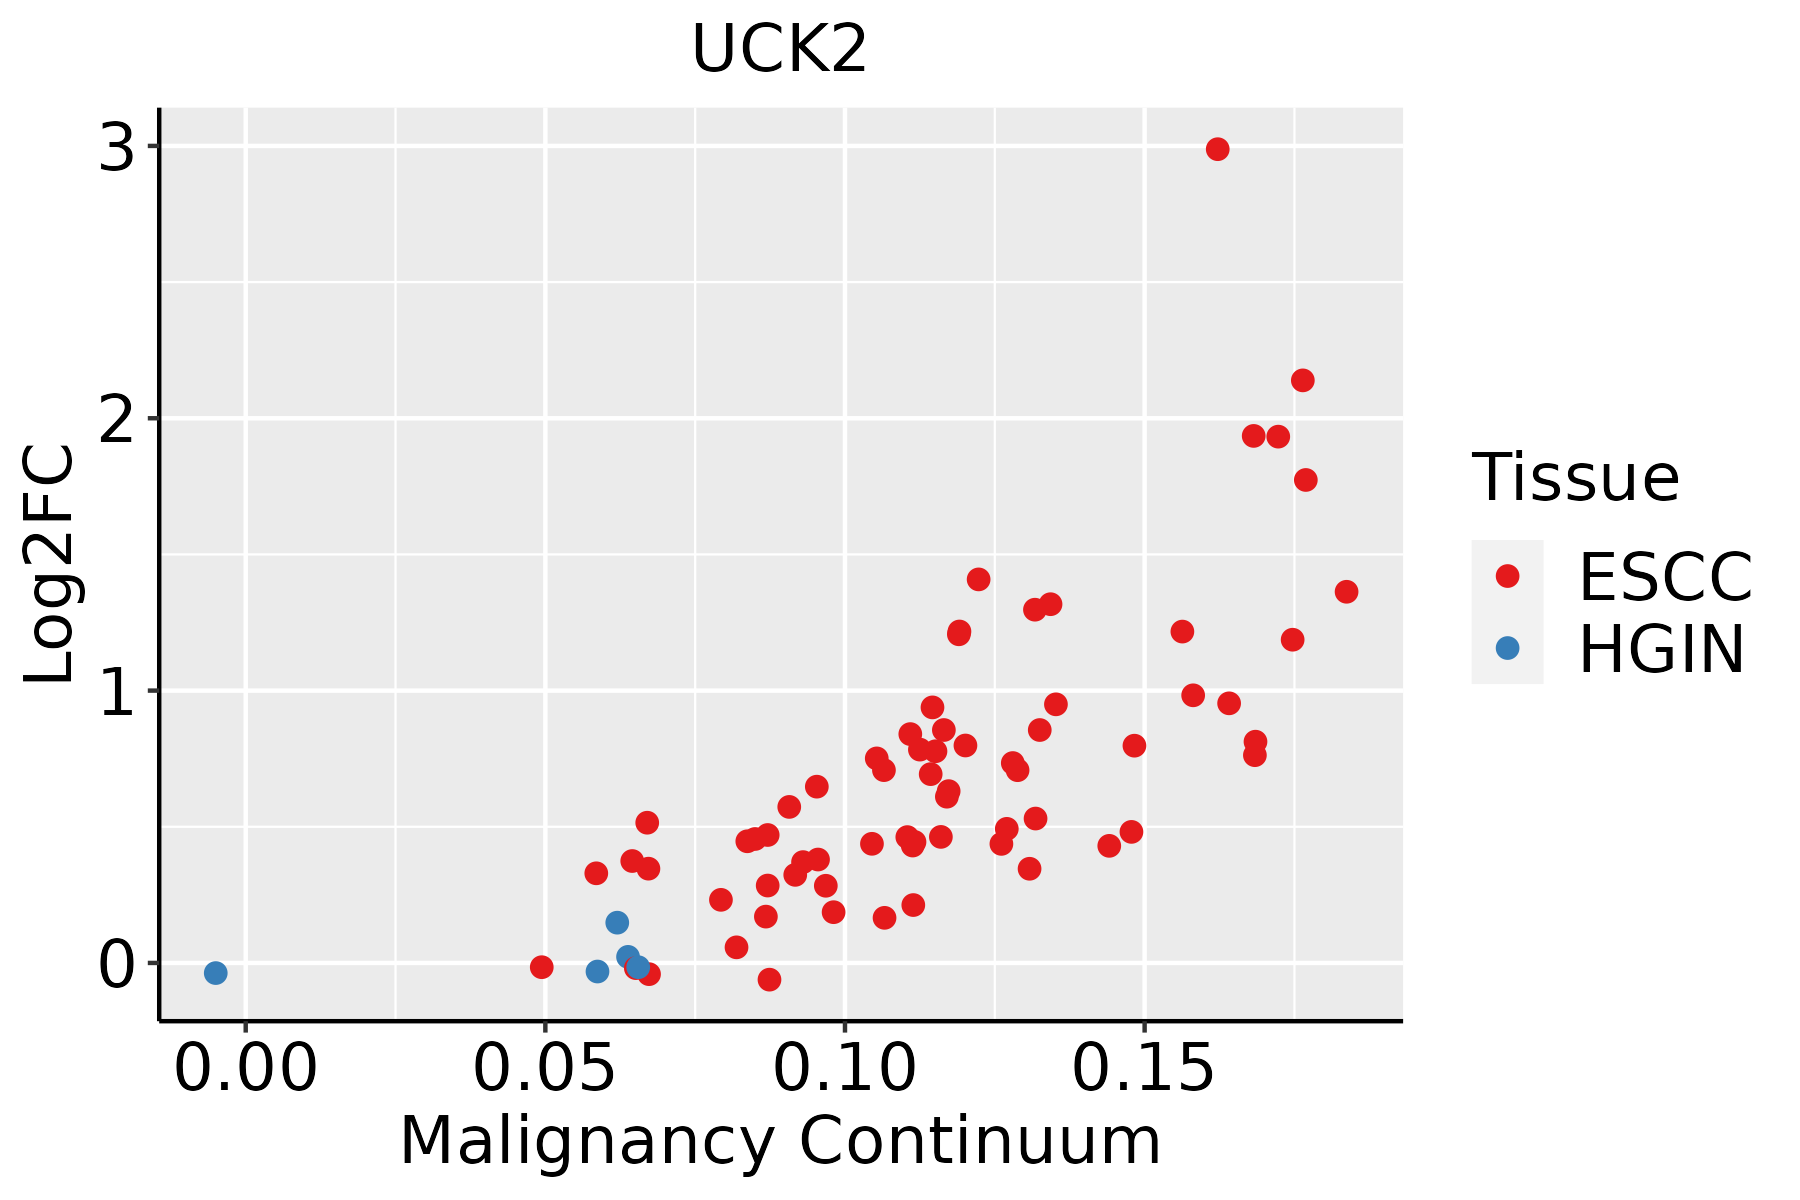 | ESCC: Esophageal squamous cell carcinoma |
| HGIN: High-grade intraepithelial neoplasias | ||
| LGIN: Low-grade intraepithelial neoplasias | ||
| Liver | 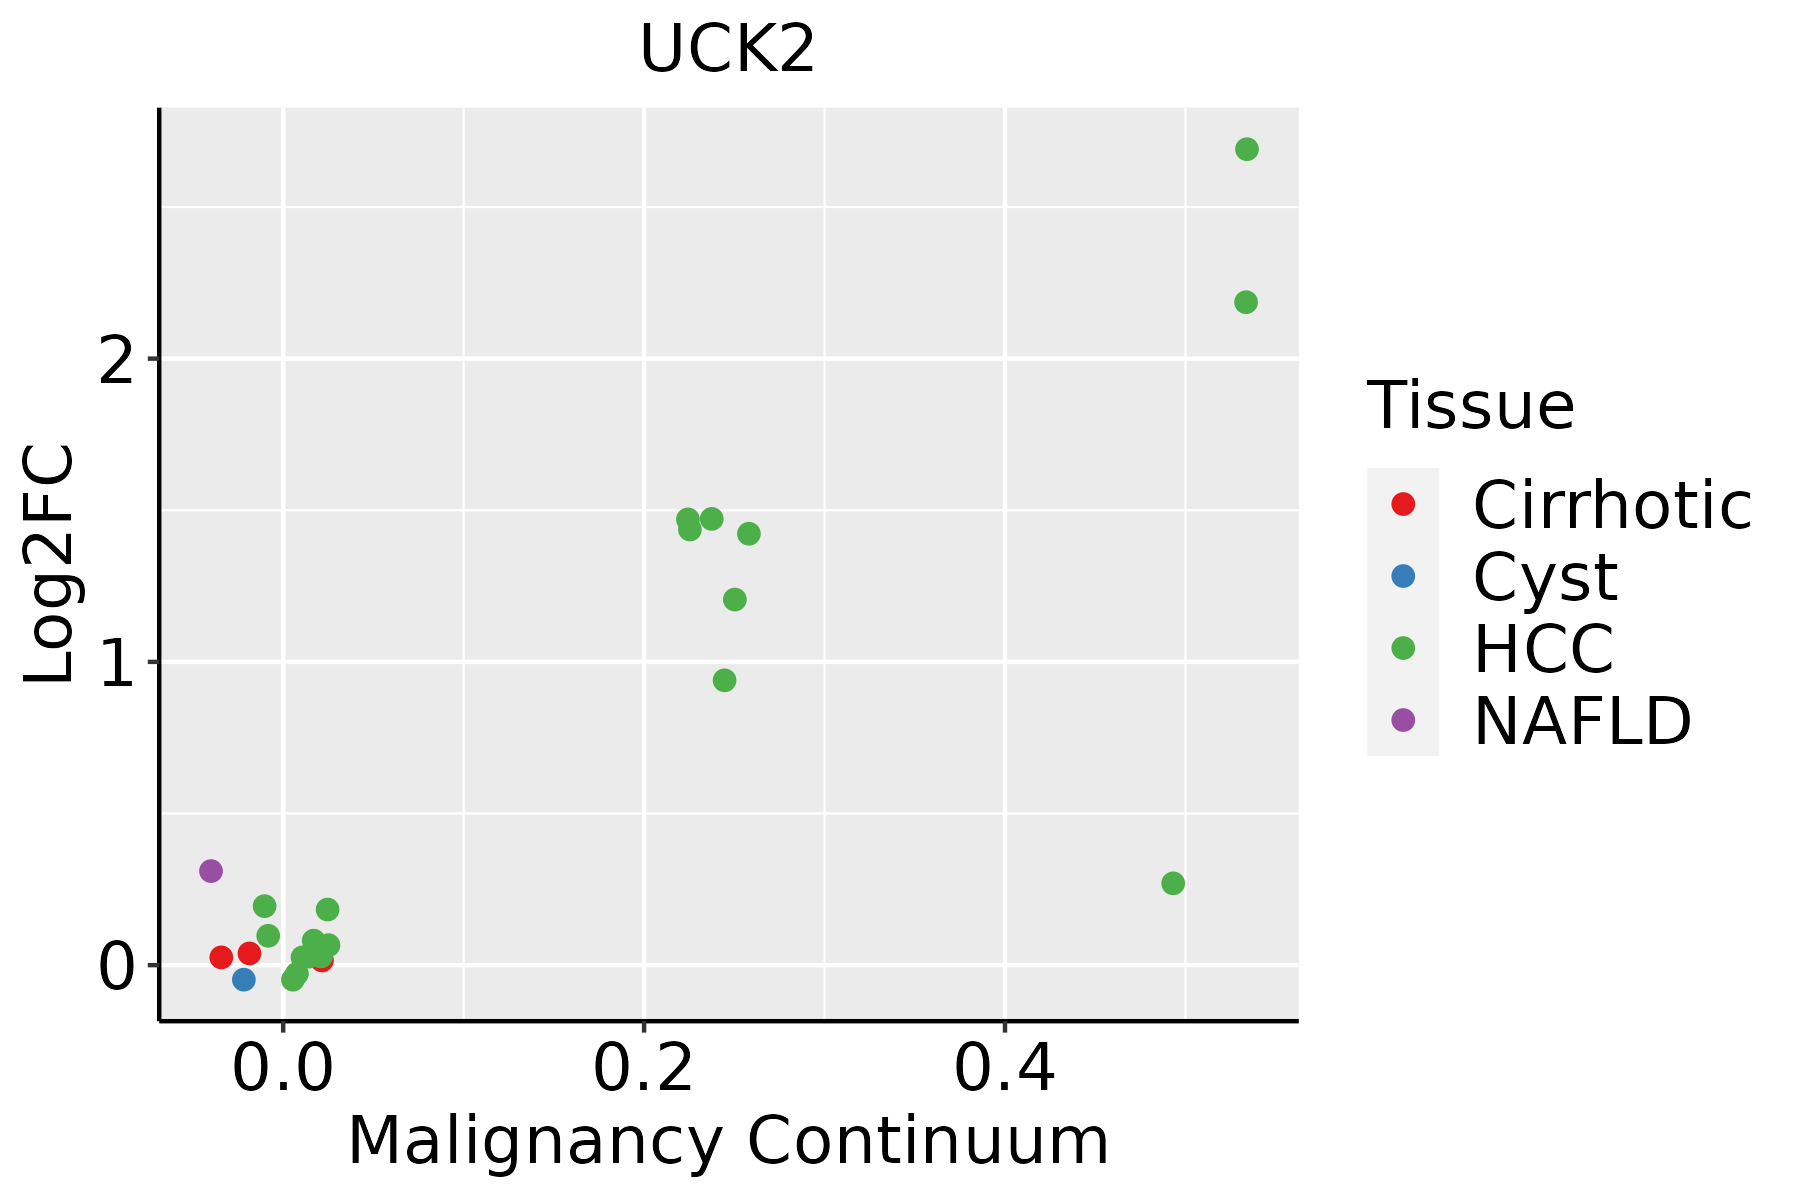 | HCC: Hepatocellular carcinoma |
| NAFLD: Non-alcoholic fatty liver disease | ||
| Oral Cavity |  | EOLP: Erosive Oral lichen planus |
| LP: leukoplakia | ||
| NEOLP: Non-erosive oral lichen planus | ||
| OSCC: Oral squamous cell carcinoma | ||
| Skin | 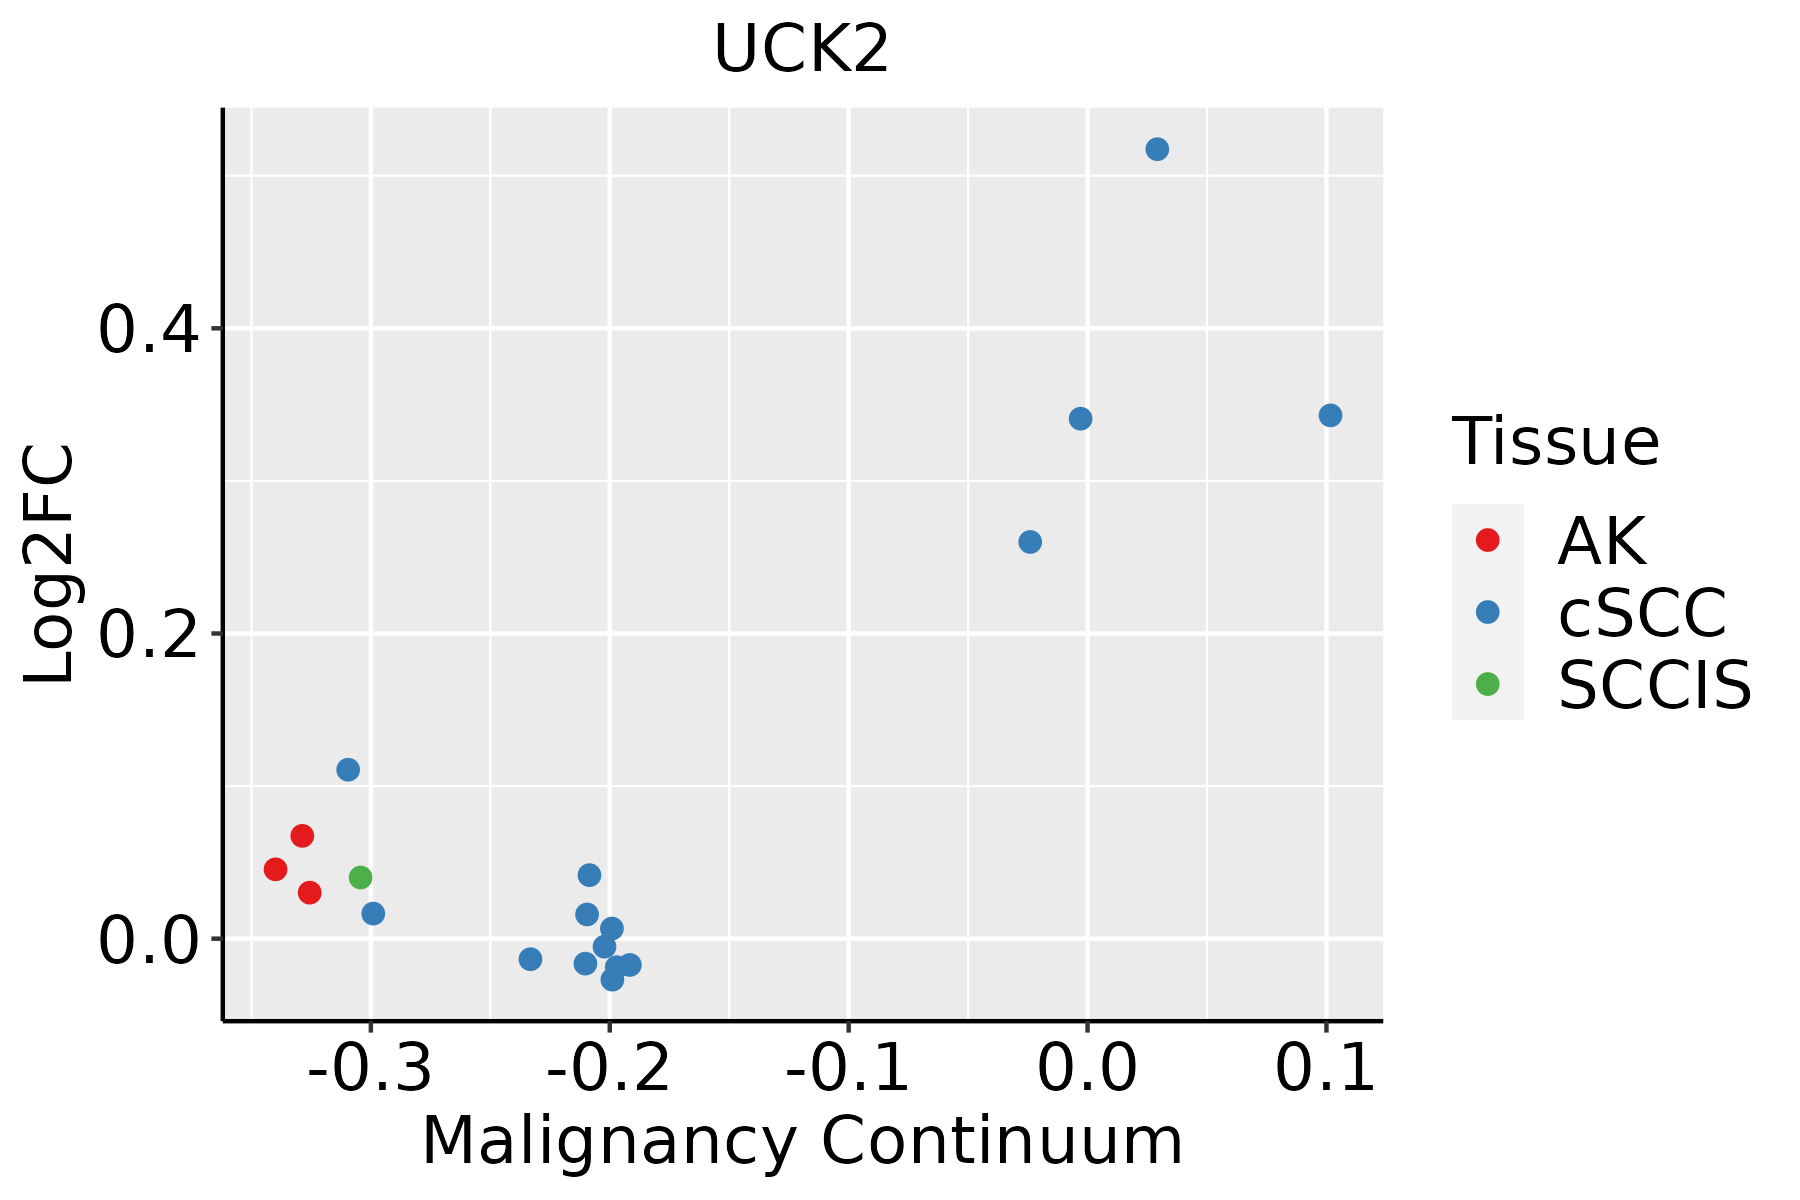 | AK: Actinic keratosis |
| cSCC: Cutaneous squamous cell carcinoma | ||
| SCCIS:squamous cell carcinoma in situ | ||
| Thyroid | 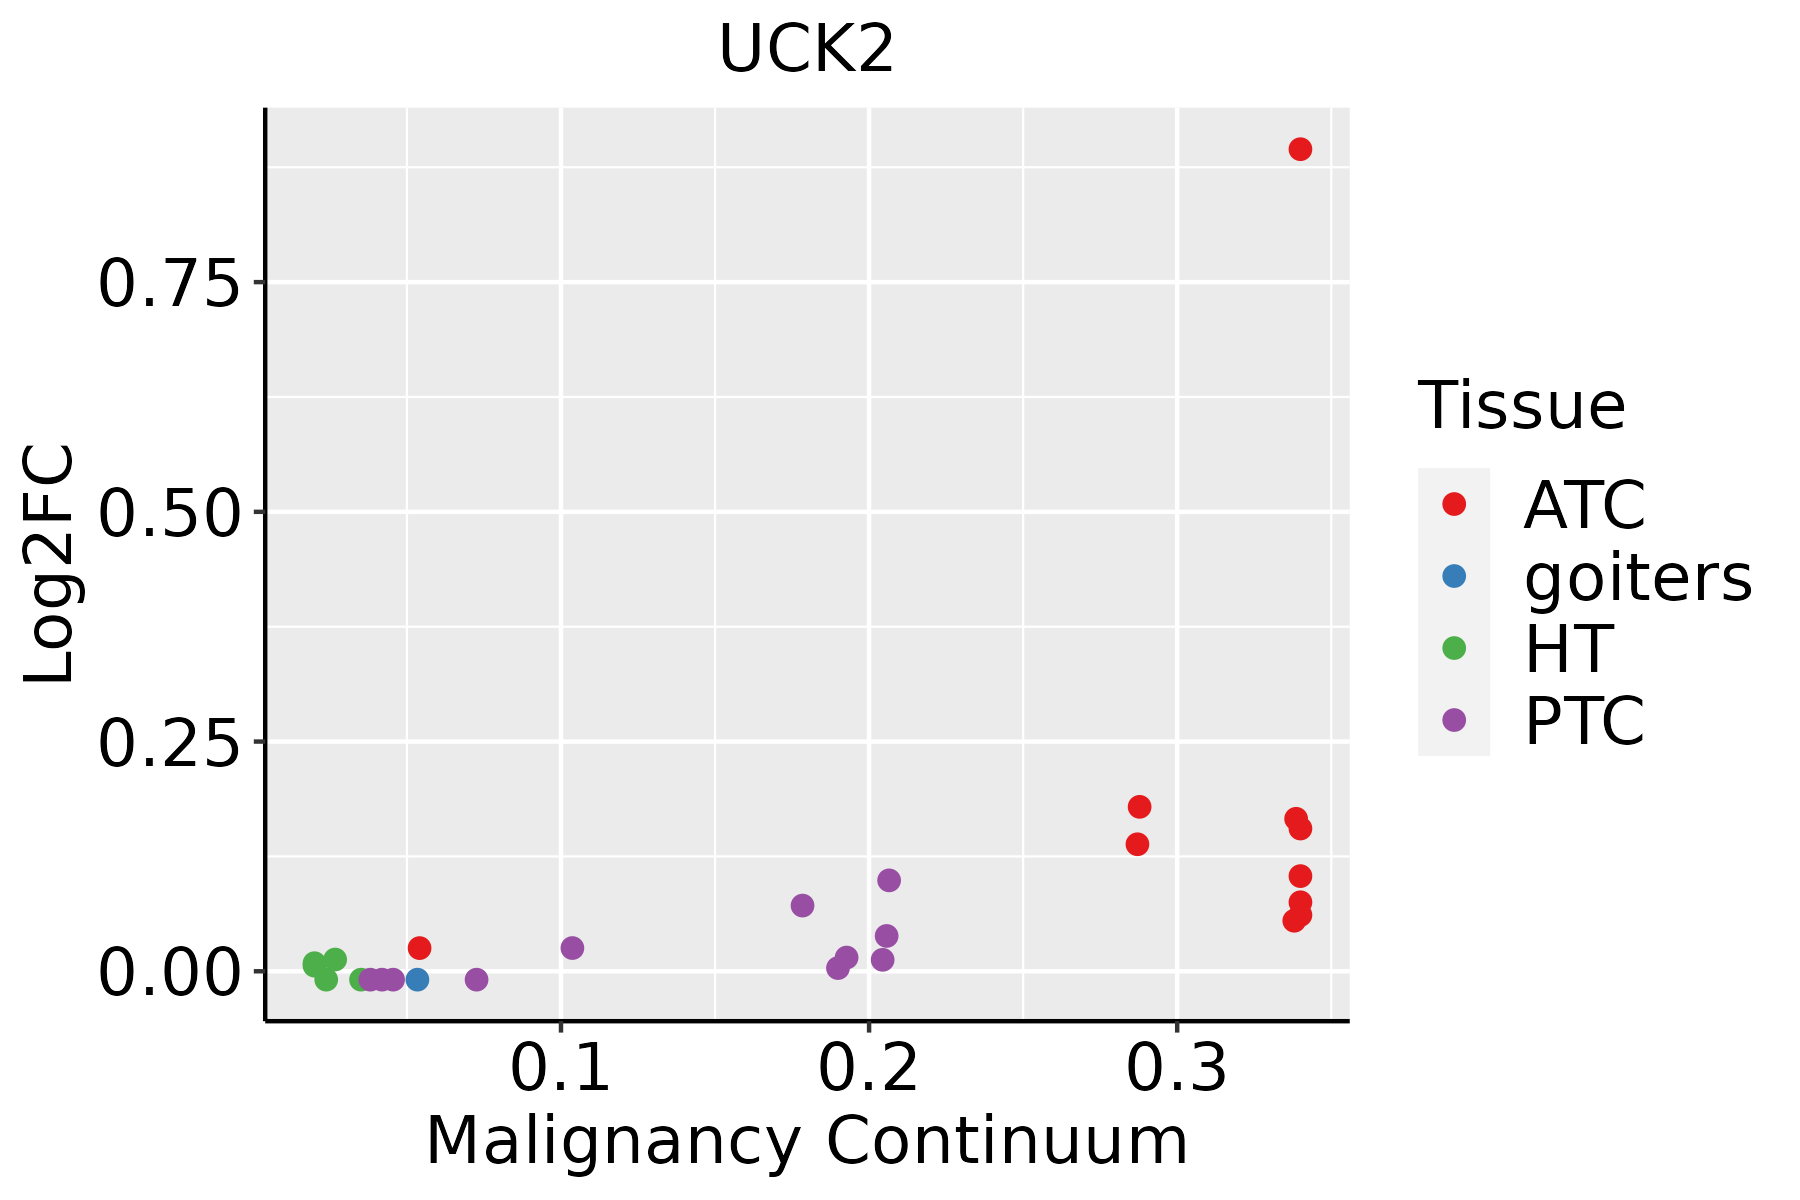 | ATC: Anaplastic thyroid cancer |
| HT: Hashimoto's thyroiditis | ||
| PTC: Papillary thyroid cancer |
| ∗log2FC in expression of this searched gene in stem-like cells from each diseased tissue sample relative to stem-like cells in normal samples in each tissue plotted against the malignancy continuum. Samples are colored based on if they are from different disease stage. |
Top |
Malignant transformation related pathway analysis |
| Find out the enriched GO biological processes and KEGG pathways involved in transition from healthy to precancer to cancer |
| Tissue | Disease Stage | Enriched GO biological Processes |
| Colorectum | AD |  |
| Colorectum | SER |  |
| Colorectum | MSS |  |
| Colorectum | MSI-H |  |
| Colorectum | FAP |  |
| ∗Top 15 enriched GO BP terms are showed in the bar plot of each disease state in each tissue. Each row represents a significant GO biological process which is colored according to the -log10(p.adjust). |
| Page: 1 2 3 4 5 6 7 8 9 |
| GO ID | Tissue | Disease Stage | Description | Gene Ratio | Bg Ratio | pvalue | p.adjust | Count |
| GO:00091993 | Colorectum | FAP | ribonucleoside triphosphate metabolic process | 25/2622 | 89/18723 | 3.85e-04 | 4.74e-03 | 25 |
| GO:00463903 | Colorectum | FAP | ribose phosphate biosynthetic process | 43/2622 | 190/18723 | 8.40e-04 | 8.72e-03 | 43 |
| GO:00091414 | Colorectum | FAP | nucleoside triphosphate metabolic process | 28/2622 | 112/18723 | 1.35e-03 | 1.24e-02 | 28 |
| GO:00092013 | Colorectum | FAP | ribonucleoside triphosphate biosynthetic process | 20/2622 | 74/18723 | 2.36e-03 | 1.88e-02 | 20 |
| GO:00091423 | Colorectum | FAP | nucleoside triphosphate biosynthetic process | 22/2622 | 85/18723 | 2.66e-03 | 2.07e-02 | 22 |
| GO:00092594 | Colorectum | CRC | ribonucleotide metabolic process | 75/2078 | 385/18723 | 7.83e-07 | 5.04e-05 | 75 |
| GO:00196934 | Colorectum | CRC | ribose phosphate metabolic process | 75/2078 | 396/18723 | 2.36e-06 | 1.13e-04 | 75 |
| GO:00091175 | Colorectum | CRC | nucleotide metabolic process | 81/2078 | 489/18723 | 1.45e-04 | 2.65e-03 | 81 |
| GO:00067535 | Colorectum | CRC | nucleoside phosphate metabolic process | 81/2078 | 497/18723 | 2.48e-04 | 4.06e-03 | 81 |
| GO:0006753110 | Esophagus | ESCC | nucleoside phosphate metabolic process | 288/8552 | 497/18723 | 1.80e-08 | 3.50e-07 | 288 |
| GO:0019693111 | Esophagus | ESCC | ribose phosphate metabolic process | 234/8552 | 396/18723 | 4.24e-08 | 7.76e-07 | 234 |
| GO:0009117111 | Esophagus | ESCC | nucleotide metabolic process | 282/8552 | 489/18723 | 4.70e-08 | 8.50e-07 | 282 |
| GO:0009141111 | Esophagus | ESCC | nucleoside triphosphate metabolic process | 78/8552 | 112/18723 | 2.36e-07 | 3.59e-06 | 78 |
| GO:0009259111 | Esophagus | ESCC | ribonucleotide metabolic process | 224/8552 | 385/18723 | 4.41e-07 | 6.00e-06 | 224 |
| GO:0046390110 | Esophagus | ESCC | ribose phosphate biosynthetic process | 119/8552 | 190/18723 | 1.73e-06 | 2.06e-05 | 119 |
| GO:000919918 | Esophagus | ESCC | ribonucleoside triphosphate metabolic process | 61/8552 | 89/18723 | 1.07e-05 | 1.01e-04 | 61 |
| GO:000916516 | Esophagus | ESCC | nucleotide biosynthetic process | 150/8552 | 254/18723 | 1.12e-05 | 1.06e-04 | 150 |
| GO:0009260110 | Esophagus | ESCC | ribonucleotide biosynthetic process | 112/8552 | 182/18723 | 1.12e-05 | 1.06e-04 | 112 |
| GO:190129316 | Esophagus | ESCC | nucleoside phosphate biosynthetic process | 151/8552 | 256/18723 | 1.15e-05 | 1.08e-04 | 151 |
| GO:000914219 | Esophagus | ESCC | nucleoside triphosphate biosynthetic process | 58/8552 | 85/18723 | 2.16e-05 | 1.87e-04 | 58 |
| Page: 1 2 3 4 5 6 7 8 |
| Pathway ID | Tissue | Disease Stage | Description | Gene Ratio | Bg Ratio | pvalue | p.adjust | qvalue | Count |
| hsa012325 | Esophagus | ESCC | Nucleotide metabolism | 59/4205 | 85/8465 | 1.67e-04 | 6.58e-04 | 3.37e-04 | 59 |
| hsa002405 | Esophagus | ESCC | Pyrimidine metabolism | 41/4205 | 58/8465 | 9.14e-04 | 2.92e-03 | 1.49e-03 | 41 |
| hsa0123212 | Esophagus | ESCC | Nucleotide metabolism | 59/4205 | 85/8465 | 1.67e-04 | 6.58e-04 | 3.37e-04 | 59 |
| hsa0024012 | Esophagus | ESCC | Pyrimidine metabolism | 41/4205 | 58/8465 | 9.14e-04 | 2.92e-03 | 1.49e-03 | 41 |
| hsa002402 | Liver | HCC | Pyrimidine metabolism | 44/4020 | 58/8465 | 9.34e-06 | 7.11e-05 | 3.95e-05 | 44 |
| hsa012322 | Liver | HCC | Nucleotide metabolism | 59/4020 | 85/8465 | 3.30e-05 | 1.88e-04 | 1.04e-04 | 59 |
| hsa009832 | Liver | HCC | Drug metabolism - other enzymes | 54/4020 | 80/8465 | 2.25e-04 | 1.09e-03 | 6.08e-04 | 54 |
| hsa002403 | Liver | HCC | Pyrimidine metabolism | 44/4020 | 58/8465 | 9.34e-06 | 7.11e-05 | 3.95e-05 | 44 |
| hsa012323 | Liver | HCC | Nucleotide metabolism | 59/4020 | 85/8465 | 3.30e-05 | 1.88e-04 | 1.04e-04 | 59 |
| hsa009833 | Liver | HCC | Drug metabolism - other enzymes | 54/4020 | 80/8465 | 2.25e-04 | 1.09e-03 | 6.08e-04 | 54 |
| hsa012324 | Oral cavity | OSCC | Nucleotide metabolism | 54/3704 | 85/8465 | 1.78e-04 | 5.95e-04 | 3.03e-04 | 54 |
| hsa002404 | Oral cavity | OSCC | Pyrimidine metabolism | 37/3704 | 58/8465 | 1.62e-03 | 4.45e-03 | 2.26e-03 | 37 |
| hsa0123211 | Oral cavity | OSCC | Nucleotide metabolism | 54/3704 | 85/8465 | 1.78e-04 | 5.95e-04 | 3.03e-04 | 54 |
| hsa0024011 | Oral cavity | OSCC | Pyrimidine metabolism | 37/3704 | 58/8465 | 1.62e-03 | 4.45e-03 | 2.26e-03 | 37 |
| Page: 1 |
Top |
Cell-cell communication analysis |
| Identification of potential cell-cell interactions between two cell types and their ligand-receptor pairs for different disease states |
| Ligand | Receptor | LRpair | Pathway | Tissue | Disease Stage |
| Page: 1 |
Top |
Single-cell gene regulatory network inference analysis |
| Find out the significant the regulons (TFs) and the target genes of each regulon across cell types for different disease states |
| TF | Cell Type | Tissue | Disease Stage | Target Gene | RSS | Regulon Activity |
| ∗The dot plots of a searched regulon are shown for all cell subpopulations in each disease state of each tissue based on the regulon specific score inferred using pySCENIC and by calculating the average expression. |
| Page: 1 |
Top |
Somatic mutation of malignant transformation related genes |
| Annotation of somatic variants for genes involved in malignant transformation |
| Hugo Symbol | Variant Class | Variant Classification | dbSNP RS | HGVSc | HGVSp | HGVSp Short | SWISSPROT | BIOTYPE | SIFT | PolyPhen | Tumor Sample Barcode | Tissue | Histology | Sex | Age | Stage | Therapy Types | Drugs | Outcome |
| UCK2 | SNV | Missense_Mutation | novel | c.641N>G | p.Asn214Ser | p.N214S | Q9BZX2 | protein_coding | deleterious(0) | possibly_damaging(0.743) | TCGA-A8-A07G-01 | Breast | breast invasive carcinoma | Female | >=65 | I/II | Chemotherapy | 5-fluorouracil | CR |
| UCK2 | SNV | Missense_Mutation | c.443T>C | p.Leu148Pro | p.L148P | Q9BZX2 | protein_coding | deleterious(0) | probably_damaging(0.979) | TCGA-AN-A04D-01 | Breast | breast invasive carcinoma | Female | <65 | I/II | Unknown | Unknown | SD | |
| UCK2 | SNV | Missense_Mutation | novel | c.10G>T | p.Asp4Tyr | p.D4Y | Q9BZX2 | protein_coding | deleterious_low_confidence(0) | possibly_damaging(0.841) | TCGA-E2-A15M-01 | Breast | breast invasive carcinoma | Female | >=65 | I/II | Hormone Therapy | arimidex | SD |
| UCK2 | insertion | Nonsense_Mutation | novel | c.642_643insTAAGCTCTGAGACCGGGAGGAAGGAAAGGAAGAGCTTGGGA | p.Leu215Ter | p.L215* | Q9BZX2 | protein_coding | TCGA-A8-A07G-01 | Breast | breast invasive carcinoma | Female | >=65 | I/II | Chemotherapy | 5-fluorouracil | CR | ||
| UCK2 | insertion | Nonsense_Mutation | novel | c.145_146insTCATTACTTAACT | p.Asp50IlefsTer3 | p.D50Ifs*3 | Q9BZX2 | protein_coding | TCGA-AN-A04C-01 | Breast | breast invasive carcinoma | Female | <65 | I/II | Unknown | Unknown | SD | ||
| UCK2 | SNV | Missense_Mutation | novel | c.197N>A | p.Arg66His | p.R66H | Q9BZX2 | protein_coding | tolerated(0.09) | probably_damaging(0.937) | TCGA-VS-A9UJ-01 | Cervix | cervical & endocervical cancer | Female | <65 | I/II | Unknown | Unknown | PD |
| UCK2 | SNV | Missense_Mutation | rs768645050 | c.664N>A | p.Val222Met | p.V222M | Q9BZX2 | protein_coding | deleterious(0.03) | probably_damaging(0.966) | TCGA-AA-3492-01 | Colorectum | colon adenocarcinoma | Female | >=65 | I/II | Unknown | Unknown | SD |
| UCK2 | SNV | Missense_Mutation | rs757897603 | c.745C>T | p.Arg249Cys | p.R249C | Q9BZX2 | protein_coding | tolerated(0.05) | probably_damaging(0.953) | TCGA-AA-3949-01 | Colorectum | colon adenocarcinoma | Female | >=65 | III/IV | Unknown | Unknown | SD |
| UCK2 | SNV | Missense_Mutation | c.391N>A | p.Val131Met | p.V131M | Q9BZX2 | protein_coding | deleterious(0) | probably_damaging(0.997) | TCGA-AY-6197-01 | Colorectum | colon adenocarcinoma | Male | <65 | I/II | Unknown | Unknown | SD | |
| UCK2 | SNV | Missense_Mutation | novel | c.731G>A | p.Gly244Asp | p.G244D | Q9BZX2 | protein_coding | deleterious(0.02) | probably_damaging(0.955) | TCGA-AJ-A3BH-01 | Endometrium | uterine corpus endometrioid carcinoma | Female | Unknown | I/II | Unknown | Unknown | SD |
| Page: 1 2 3 4 5 |
Top |
Related drugs of malignant transformation related genes |
| Identification of chemicals and drugs interact with genes involved in malignant transfromation |
| (DGIdb 4.0) |
| Entrez ID | Symbol | Category | Interaction Types | Drug Claim Name | Drug Name | PMIDs |
| Page: 1 |

Copyright 2023-Present -The University of Texas Health Science Center at Houston |