| Tissue | Expression Dynamics | Abbreviation |
| Cervix | 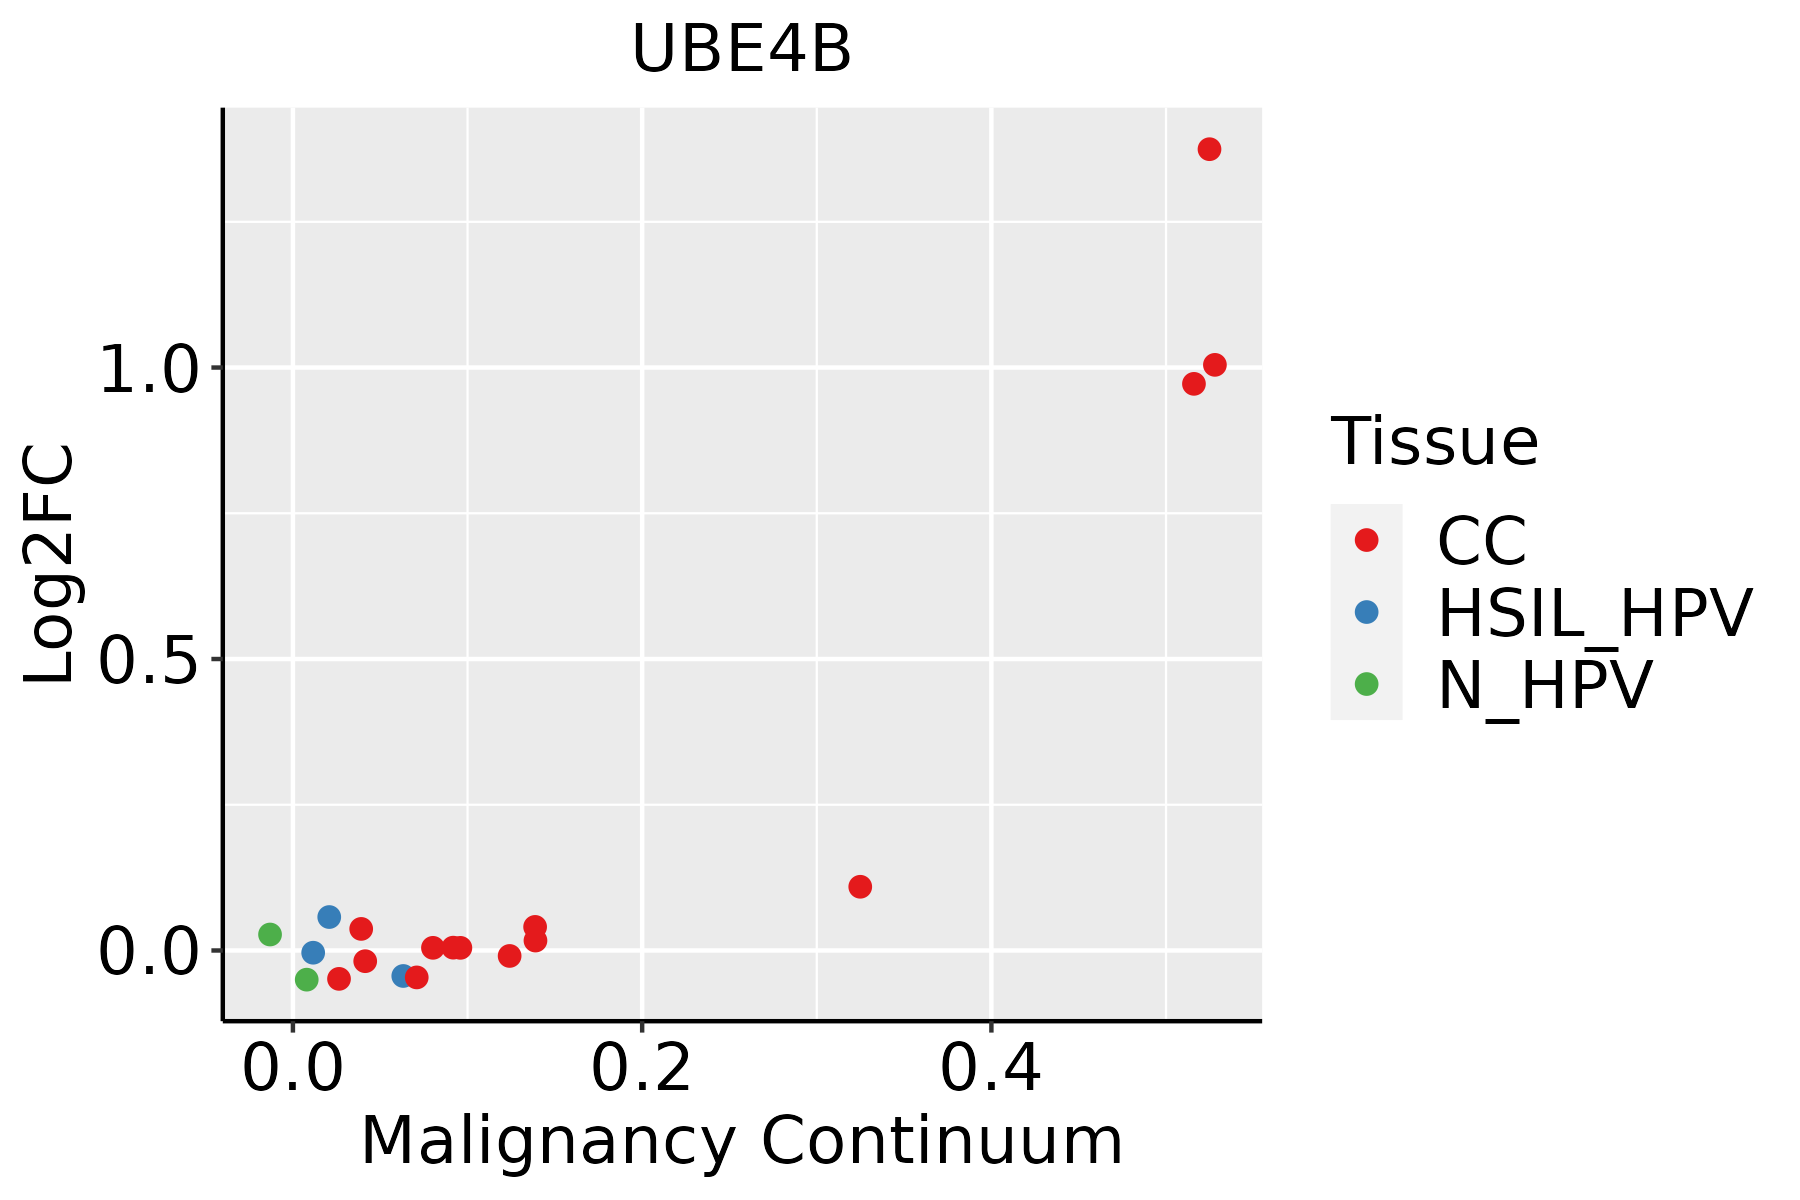 | CC: Cervix cancer |
| HSIL_HPV: HPV-infected high-grade squamous intraepithelial lesions |
| N_HPV: HPV-infected normal cervix |
| Endometrium | 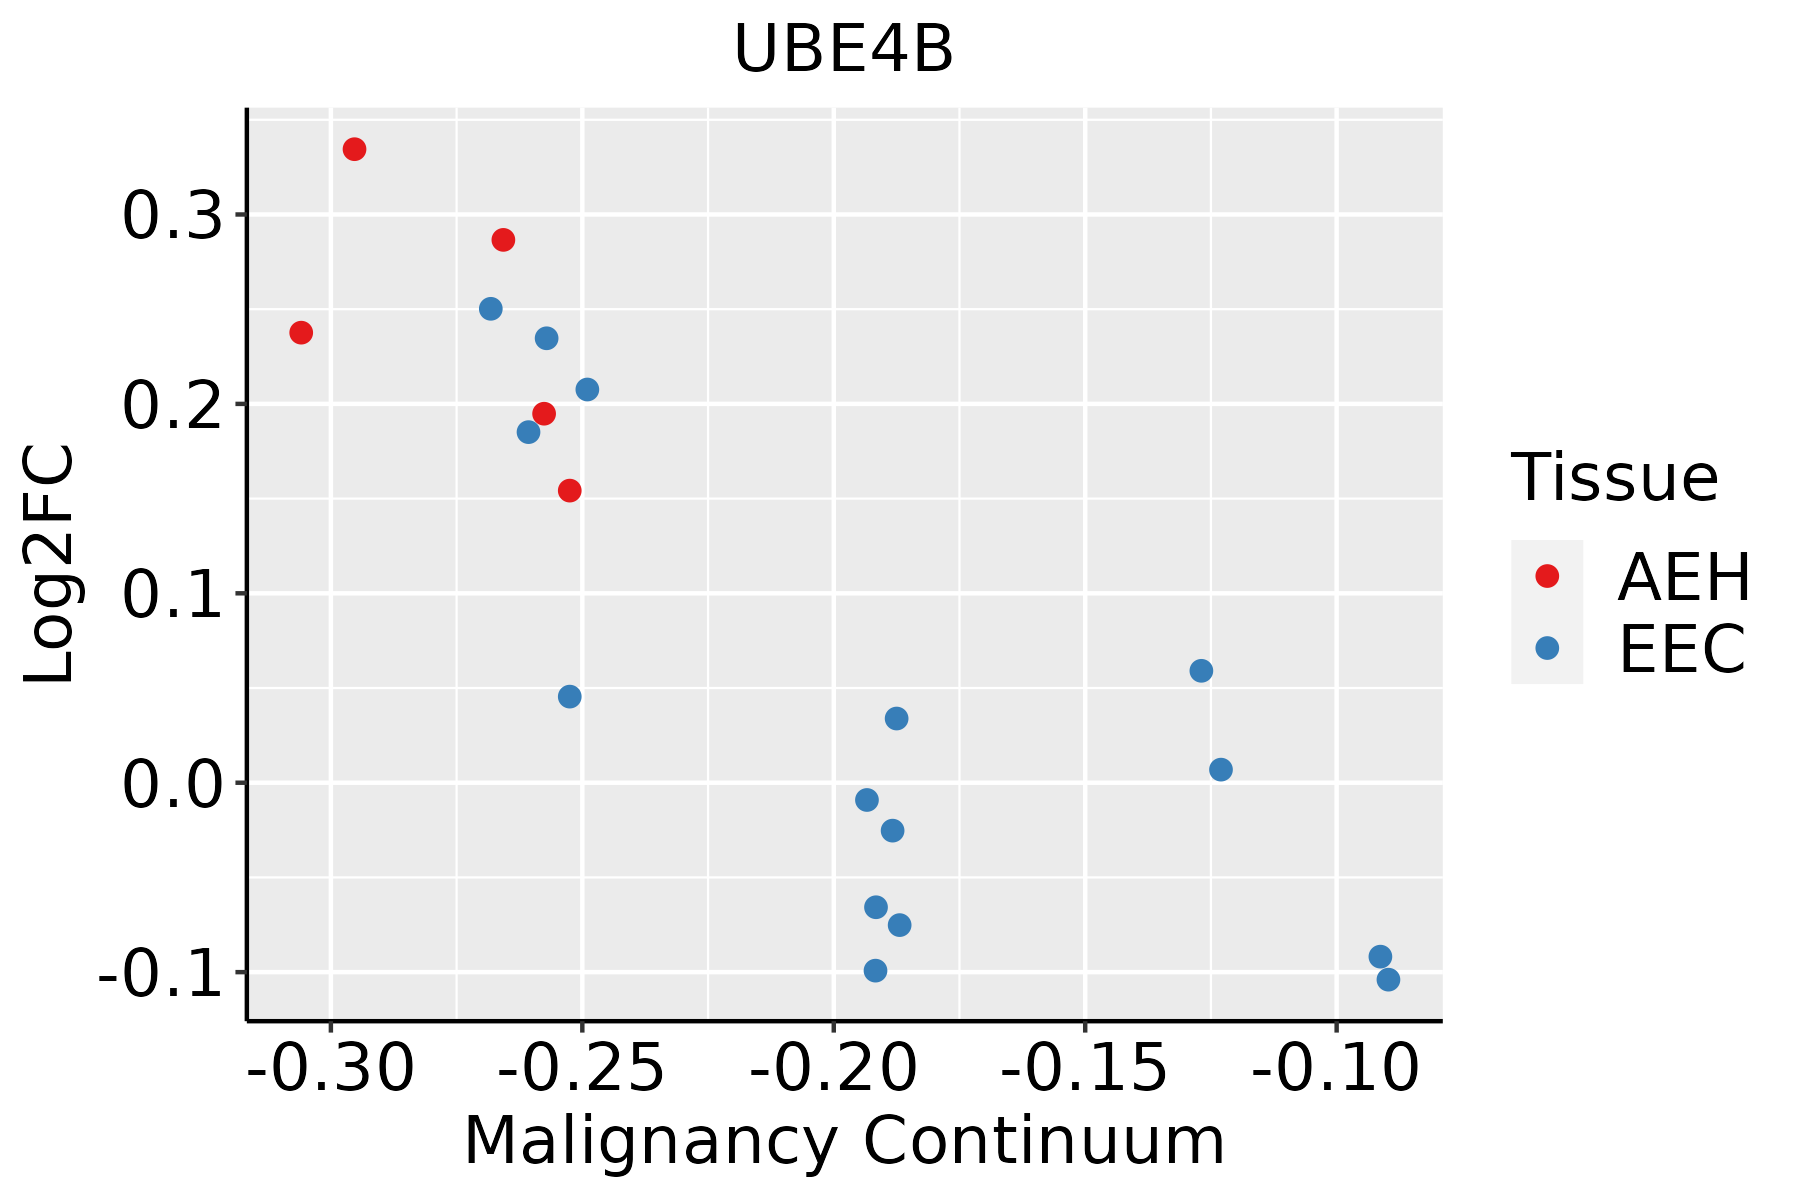 | AEH: Atypical endometrial hyperplasia |
| EEC: Endometrioid Cancer |
| Esophagus | 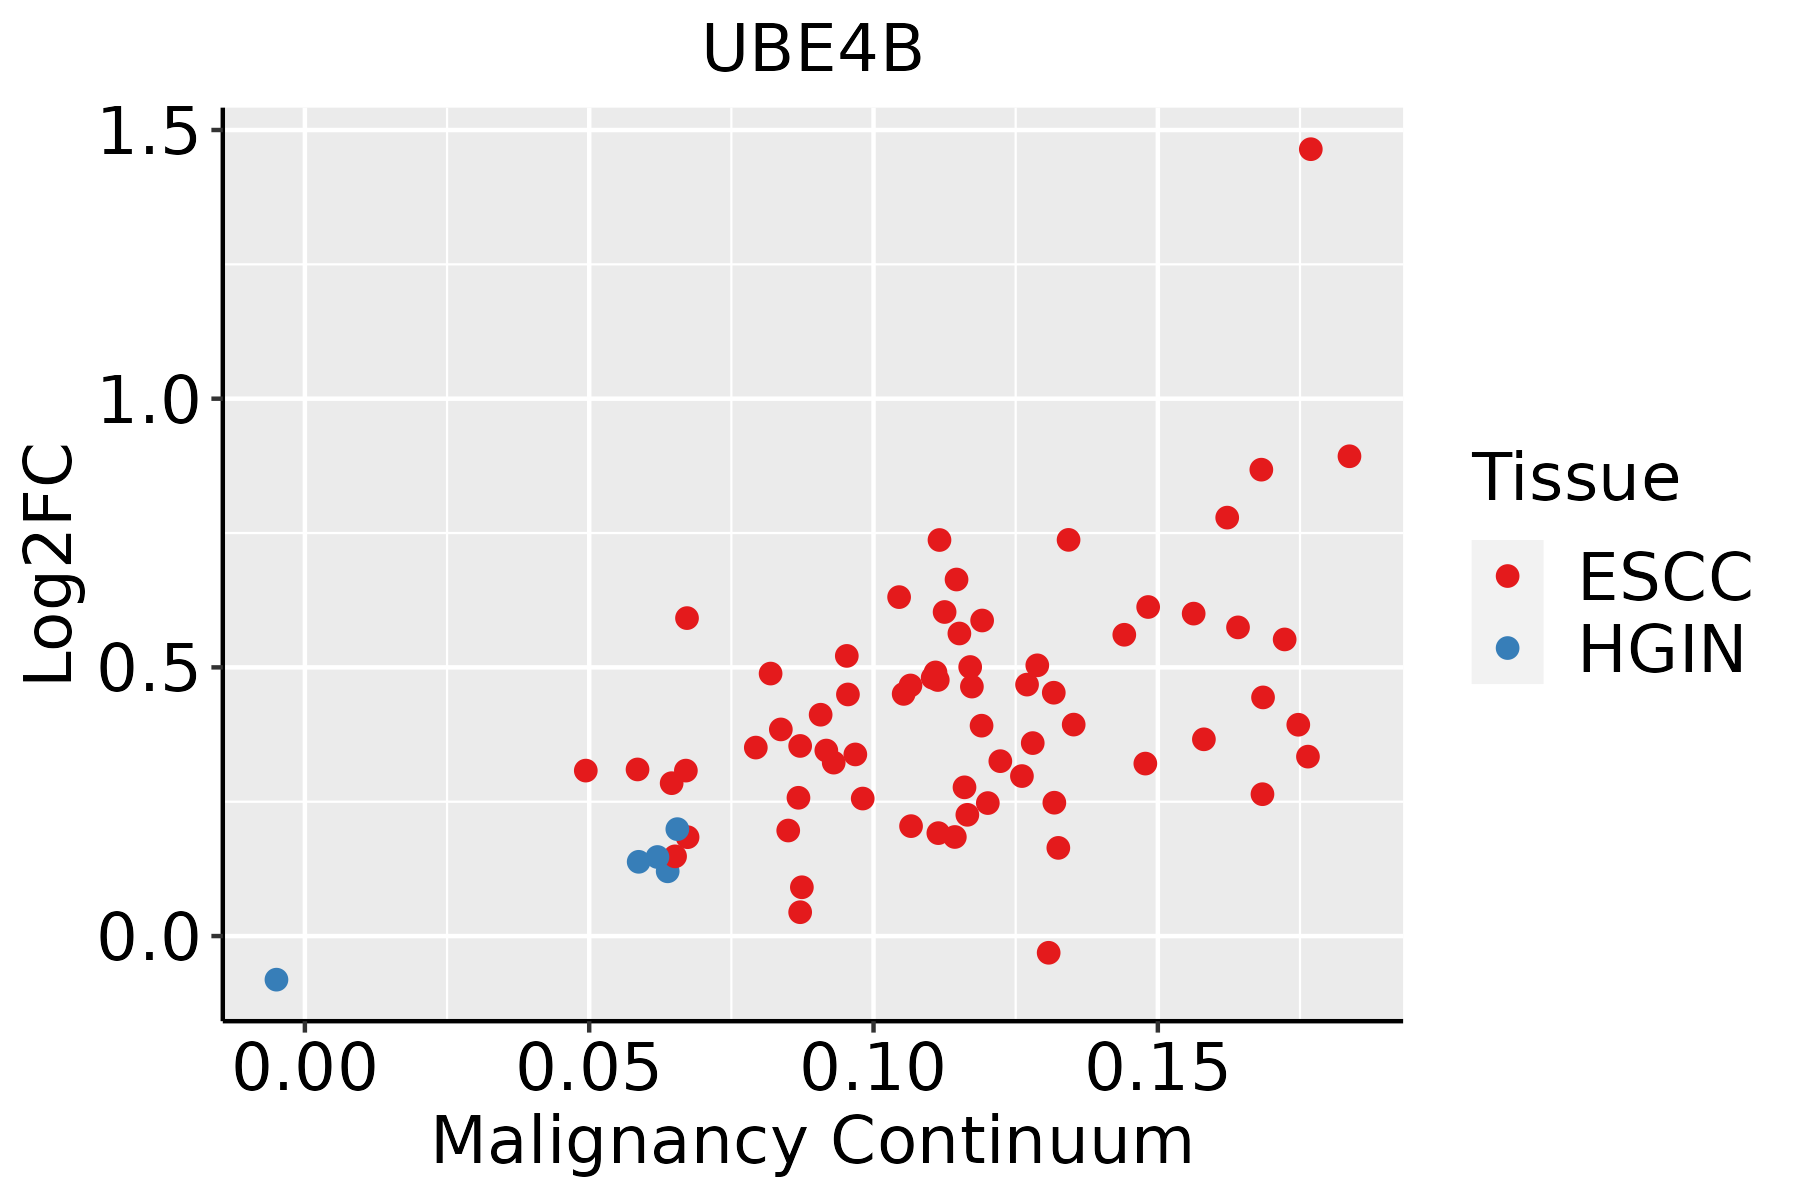 | ESCC: Esophageal squamous cell carcinoma |
| HGIN: High-grade intraepithelial neoplasias |
| LGIN: Low-grade intraepithelial neoplasias |
| Liver |  | HCC: Hepatocellular carcinoma |
| NAFLD: Non-alcoholic fatty liver disease |
| Lung | 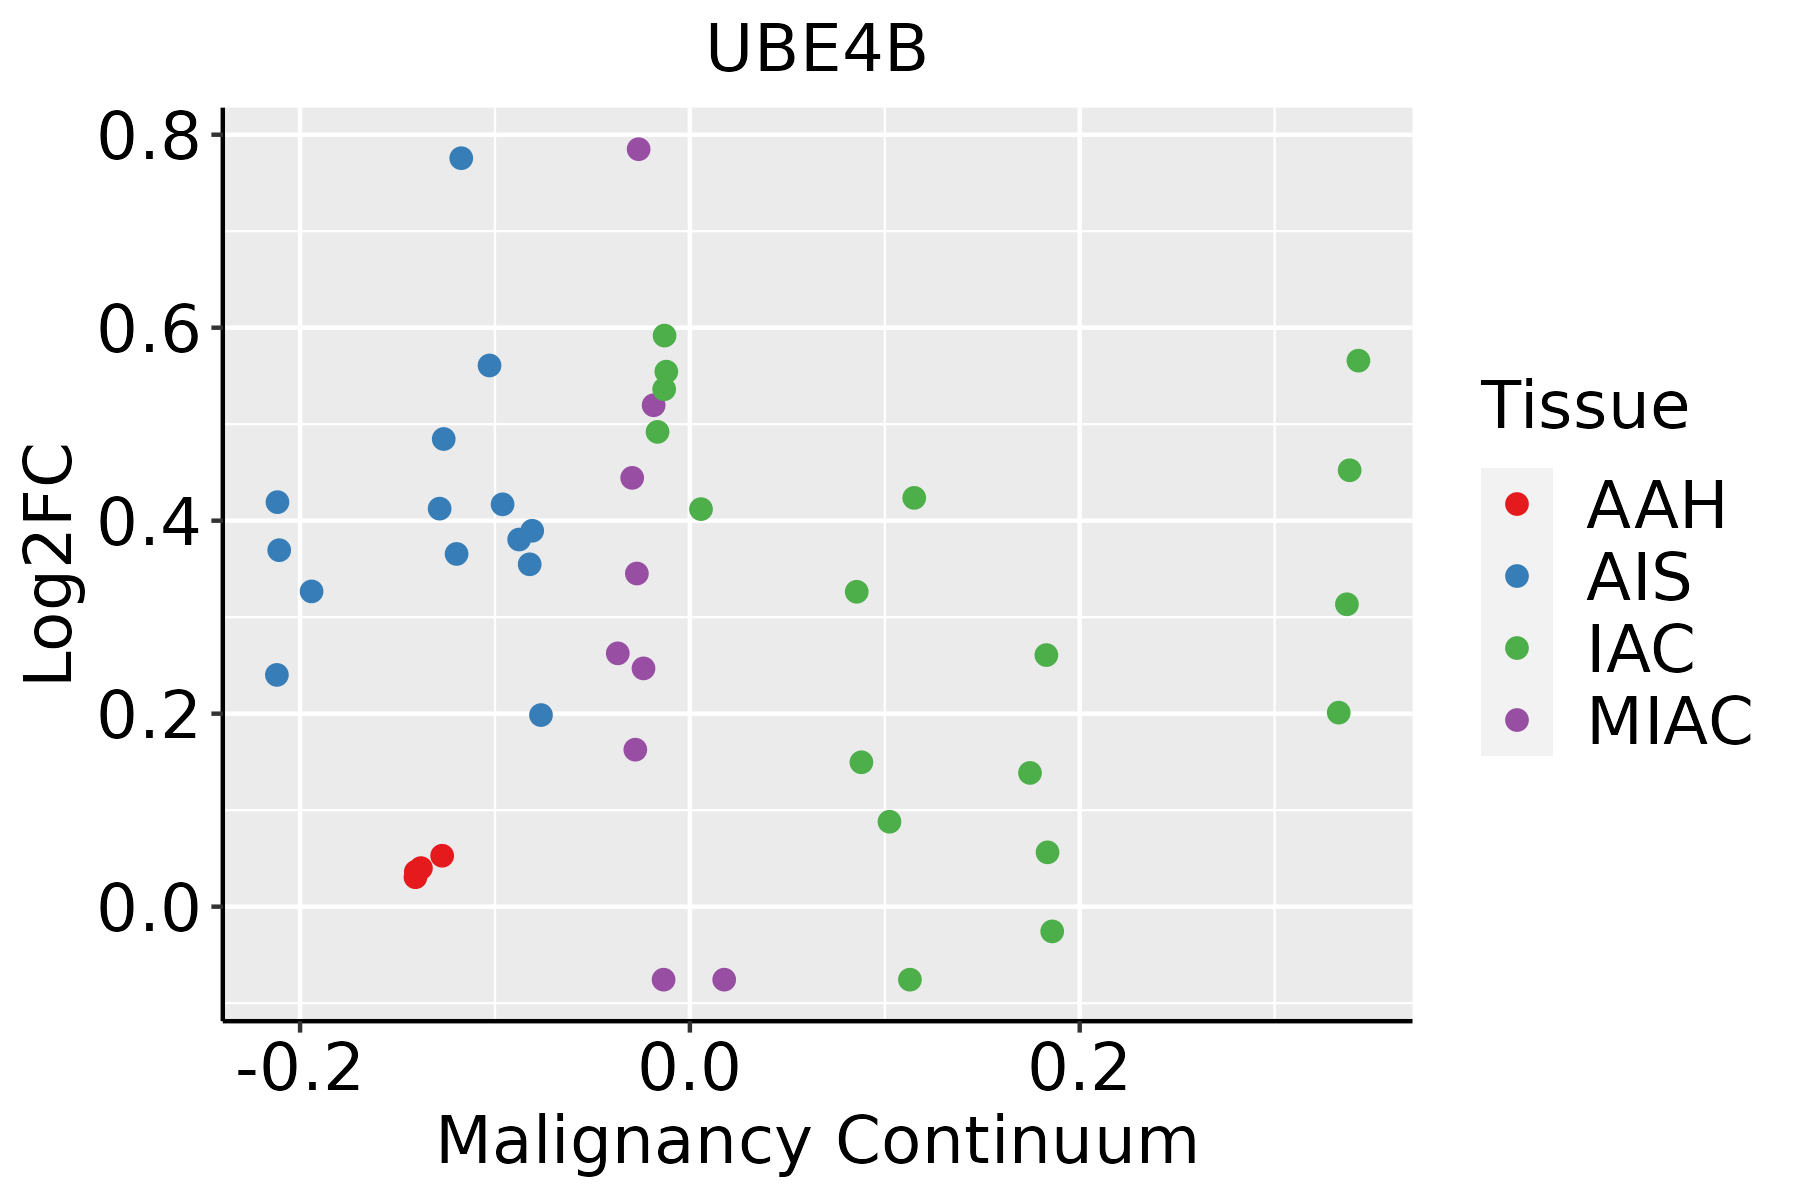 | AAH: Atypical adenomatous hyperplasia |
| AIS: Adenocarcinoma in situ |
| IAC: Invasive lung adenocarcinoma |
| MIA: Minimally invasive adenocarcinoma |
| Oral Cavity |  | EOLP: Erosive Oral lichen planus |
| LP: leukoplakia |
| NEOLP: Non-erosive oral lichen planus |
| OSCC: Oral squamous cell carcinoma |
| Thyroid |  | ATC: Anaplastic thyroid cancer |
| HT: Hashimoto's thyroiditis |
| PTC: Papillary thyroid cancer |
| GO ID | Tissue | Disease Stage | Description | Gene Ratio | Bg Ratio | pvalue | p.adjust | Count |
| GO:00093146 | Liver | HCC | response to radiation | 223/7958 | 456/18723 | 3.08e-03 | 1.43e-02 | 223 |
| GO:00104988 | Lung | IAC | proteasomal protein catabolic process | 90/2061 | 490/18723 | 6.69e-07 | 3.89e-05 | 90 |
| GO:00431618 | Lung | IAC | proteasome-mediated ubiquitin-dependent protein catabolic process | 78/2061 | 412/18723 | 1.10e-06 | 6.02e-05 | 78 |
| GO:00002096 | Lung | IAC | protein polyubiquitination | 49/2061 | 236/18723 | 8.51e-06 | 2.89e-04 | 49 |
| GO:00093147 | Lung | IAC | response to radiation | 77/2061 | 456/18723 | 8.59e-05 | 1.74e-03 | 77 |
| GO:00349768 | Lung | IAC | response to endoplasmic reticulum stress | 46/2061 | 256/18723 | 5.58e-04 | 7.76e-03 | 46 |
| GO:004316113 | Lung | AIS | proteasome-mediated ubiquitin-dependent protein catabolic process | 77/1849 | 412/18723 | 2.74e-08 | 3.47e-06 | 77 |
| GO:001049813 | Lung | AIS | proteasomal protein catabolic process | 87/1849 | 490/18723 | 4.15e-08 | 5.03e-06 | 87 |
| GO:000020912 | Lung | AIS | protein polyubiquitination | 49/1849 | 236/18723 | 3.85e-07 | 3.16e-05 | 49 |
| GO:000931411 | Lung | AIS | response to radiation | 71/1849 | 456/18723 | 7.33e-05 | 1.91e-03 | 71 |
| GO:003497613 | Lung | AIS | response to endoplasmic reticulum stress | 42/1849 | 256/18723 | 7.09e-04 | 1.04e-02 | 42 |
| GO:00094162 | Lung | AIS | response to light stimulus | 47/1849 | 320/18723 | 3.72e-03 | 3.48e-02 | 47 |
| GO:000931431 | Lung | MIAC | response to radiation | 42/967 | 456/18723 | 2.11e-04 | 7.47e-03 | 42 |
| GO:004316123 | Lung | MIAC | proteasome-mediated ubiquitin-dependent protein catabolic process | 37/967 | 412/18723 | 7.87e-04 | 1.76e-02 | 37 |
| GO:000020922 | Lung | MIAC | protein polyubiquitination | 24/967 | 236/18723 | 1.22e-03 | 2.31e-02 | 24 |
| GO:00094161 | Lung | MIAC | response to light stimulus | 29/967 | 320/18723 | 2.42e-03 | 3.56e-02 | 29 |
| GO:001049823 | Lung | MIAC | proteasomal protein catabolic process | 40/967 | 490/18723 | 2.92e-03 | 3.99e-02 | 40 |
| GO:001049820 | Oral cavity | OSCC | proteasomal protein catabolic process | 336/7305 | 490/18723 | 5.45e-41 | 8.63e-38 | 336 |
| GO:004316120 | Oral cavity | OSCC | proteasome-mediated ubiquitin-dependent protein catabolic process | 285/7305 | 412/18723 | 5.68e-36 | 5.99e-33 | 285 |
| GO:003497620 | Oral cavity | OSCC | response to endoplasmic reticulum stress | 178/7305 | 256/18723 | 2.59e-23 | 6.06e-21 | 178 |
| Pathway ID | Tissue | Disease Stage | Description | Gene Ratio | Bg Ratio | pvalue | p.adjust | qvalue | Count |
| hsa0412014 | Cervix | CC | Ubiquitin mediated proteolysis | 49/1267 | 142/8465 | 4.26e-09 | 7.68e-08 | 4.54e-08 | 49 |
| hsa0414120 | Cervix | CC | Protein processing in endoplasmic reticulum | 55/1267 | 174/8465 | 1.74e-08 | 2.68e-07 | 1.58e-07 | 55 |
| hsa0412015 | Cervix | CC | Ubiquitin mediated proteolysis | 49/1267 | 142/8465 | 4.26e-09 | 7.68e-08 | 4.54e-08 | 49 |
| hsa04141110 | Cervix | CC | Protein processing in endoplasmic reticulum | 55/1267 | 174/8465 | 1.74e-08 | 2.68e-07 | 1.58e-07 | 55 |
| hsa0414126 | Endometrium | AEH | Protein processing in endoplasmic reticulum | 62/1197 | 174/8465 | 5.97e-13 | 1.39e-11 | 1.01e-11 | 62 |
| hsa0412016 | Endometrium | AEH | Ubiquitin mediated proteolysis | 41/1197 | 142/8465 | 3.42e-06 | 4.27e-05 | 3.13e-05 | 41 |
| hsa04141111 | Endometrium | AEH | Protein processing in endoplasmic reticulum | 62/1197 | 174/8465 | 5.97e-13 | 1.39e-11 | 1.01e-11 | 62 |
| hsa0412017 | Endometrium | AEH | Ubiquitin mediated proteolysis | 41/1197 | 142/8465 | 3.42e-06 | 4.27e-05 | 3.13e-05 | 41 |
| hsa0414127 | Endometrium | EEC | Protein processing in endoplasmic reticulum | 64/1237 | 174/8465 | 2.17e-13 | 5.09e-12 | 3.80e-12 | 64 |
| hsa0412023 | Endometrium | EEC | Ubiquitin mediated proteolysis | 41/1237 | 142/8465 | 7.86e-06 | 9.58e-05 | 7.14e-05 | 41 |
| hsa0414136 | Endometrium | EEC | Protein processing in endoplasmic reticulum | 64/1237 | 174/8465 | 2.17e-13 | 5.09e-12 | 3.80e-12 | 64 |
| hsa0412033 | Endometrium | EEC | Ubiquitin mediated proteolysis | 41/1237 | 142/8465 | 7.86e-06 | 9.58e-05 | 7.14e-05 | 41 |
| hsa04141211 | Esophagus | ESCC | Protein processing in endoplasmic reticulum | 147/4205 | 174/8465 | 3.29e-22 | 1.10e-19 | 5.64e-20 | 147 |
| hsa0412027 | Esophagus | ESCC | Ubiquitin mediated proteolysis | 122/4205 | 142/8465 | 6.53e-20 | 7.29e-18 | 3.74e-18 | 122 |
| hsa04141310 | Esophagus | ESCC | Protein processing in endoplasmic reticulum | 147/4205 | 174/8465 | 3.29e-22 | 1.10e-19 | 5.64e-20 | 147 |
| hsa0412036 | Esophagus | ESCC | Ubiquitin mediated proteolysis | 122/4205 | 142/8465 | 6.53e-20 | 7.29e-18 | 3.74e-18 | 122 |
| hsa0412010 | Liver | NAFLD | Ubiquitin mediated proteolysis | 44/1043 | 142/8465 | 2.59e-09 | 1.70e-07 | 1.37e-07 | 44 |
| hsa0412011 | Liver | NAFLD | Ubiquitin mediated proteolysis | 44/1043 | 142/8465 | 2.59e-09 | 1.70e-07 | 1.37e-07 | 44 |
| hsa0414122 | Liver | HCC | Protein processing in endoplasmic reticulum | 146/4020 | 174/8465 | 7.34e-24 | 2.46e-21 | 1.37e-21 | 146 |
| hsa0412041 | Liver | HCC | Ubiquitin mediated proteolysis | 110/4020 | 142/8465 | 1.67e-13 | 3.74e-12 | 2.08e-12 | 110 |
| Hugo Symbol | Variant Class | Variant Classification | dbSNP RS | HGVSc | HGVSp | HGVSp Short | SWISSPROT | BIOTYPE | SIFT | PolyPhen | Tumor Sample Barcode | Tissue | Histology | Sex | Age | Stage | Therapy Types | Drugs | Outcome |
| UBE4B | SNV | Missense_Mutation | | c.3502N>A | p.Ala1168Thr | p.A1168T | O95155 | protein_coding | deleterious(0.01) | probably_damaging(0.996) | TCGA-A8-A096-01 | Breast | breast invasive carcinoma | Female | >=65 | I/II | Unknown | Unknown | SD |
| UBE4B | SNV | Missense_Mutation | | c.499N>A | p.Arg167Ser | p.R167S | O95155 | protein_coding | tolerated(0.16) | probably_damaging(0.982) | TCGA-A8-A09Z-01 | Breast | breast invasive carcinoma | Female | >=65 | I/II | Unknown | Unknown | SD |
| UBE4B | SNV | Missense_Mutation | | c.461C>G | p.Ser154Cys | p.S154C | O95155 | protein_coding | deleterious(0) | possibly_damaging(0.751) | TCGA-AC-A23H-01 | Breast | breast invasive carcinoma | Female | >=65 | I/II | Unknown | Unknown | PD |
| UBE4B | SNV | Missense_Mutation | rs781407095 | c.2333G>A | p.Arg778His | p.R778H | O95155 | protein_coding | deleterious(0) | probably_damaging(0.98) | TCGA-AN-A046-01 | Breast | breast invasive carcinoma | Female | >=65 | I/II | Unknown | Unknown | SD |
| UBE4B | SNV | Missense_Mutation | rs760809804 | c.407N>A | p.Arg136Gln | p.R136Q | O95155 | protein_coding | deleterious(0.02) | probably_damaging(0.968) | TCGA-AR-A250-01 | Breast | breast invasive carcinoma | Female | <65 | I/II | Chemotherapy | doxorubicin | SD |
| UBE4B | SNV | Missense_Mutation | novel | c.3061A>G | p.Lys1021Glu | p.K1021E | O95155 | protein_coding | deleterious(0.01) | possibly_damaging(0.6) | TCGA-AR-A5QN-01 | Breast | breast invasive carcinoma | Female | >=65 | III/IV | Chemotherapy | taxotere | SD |
| UBE4B | SNV | Missense_Mutation | rs372819662 | c.991N>T | p.Arg331Cys | p.R331C | O95155 | protein_coding | deleterious_low_confidence(0) | benign(0) | TCGA-BH-A0EE-01 | Breast | breast invasive carcinoma | Female | >=65 | I/II | Chemotherapy | docetaxel | SD |
| UBE4B | SNV | Missense_Mutation | | c.569N>G | p.Asn190Ser | p.N190S | O95155 | protein_coding | tolerated(0.11) | benign(0.138) | TCGA-D8-A1Y0-01 | Breast | breast invasive carcinoma | Female | >=65 | III/IV | Chemotherapy | cyclophosphamide+methotrexatum+fluorouracillum | SD |
| UBE4B | SNV | Missense_Mutation | rs750897247 | c.2443N>T | p.Arg815Cys | p.R815C | O95155 | protein_coding | deleterious(0) | probably_damaging(0.981) | TCGA-E2-A15O-01 | Breast | breast invasive carcinoma | Female | >=65 | I/II | Hormone Therapy | arimidex | PD |
| UBE4B | insertion | Frame_Shift_Ins | novel | c.1329dupA | p.Ala444SerfsTer52 | p.A444Sfs*52 | O95155 | protein_coding | | | TCGA-A2-A0SY-01 | Breast | breast invasive carcinoma | Female | <65 | III/IV | Hormone Therapy | arimidex | SD |


