| Tissue | Expression Dynamics | Abbreviation |
| Esophagus | 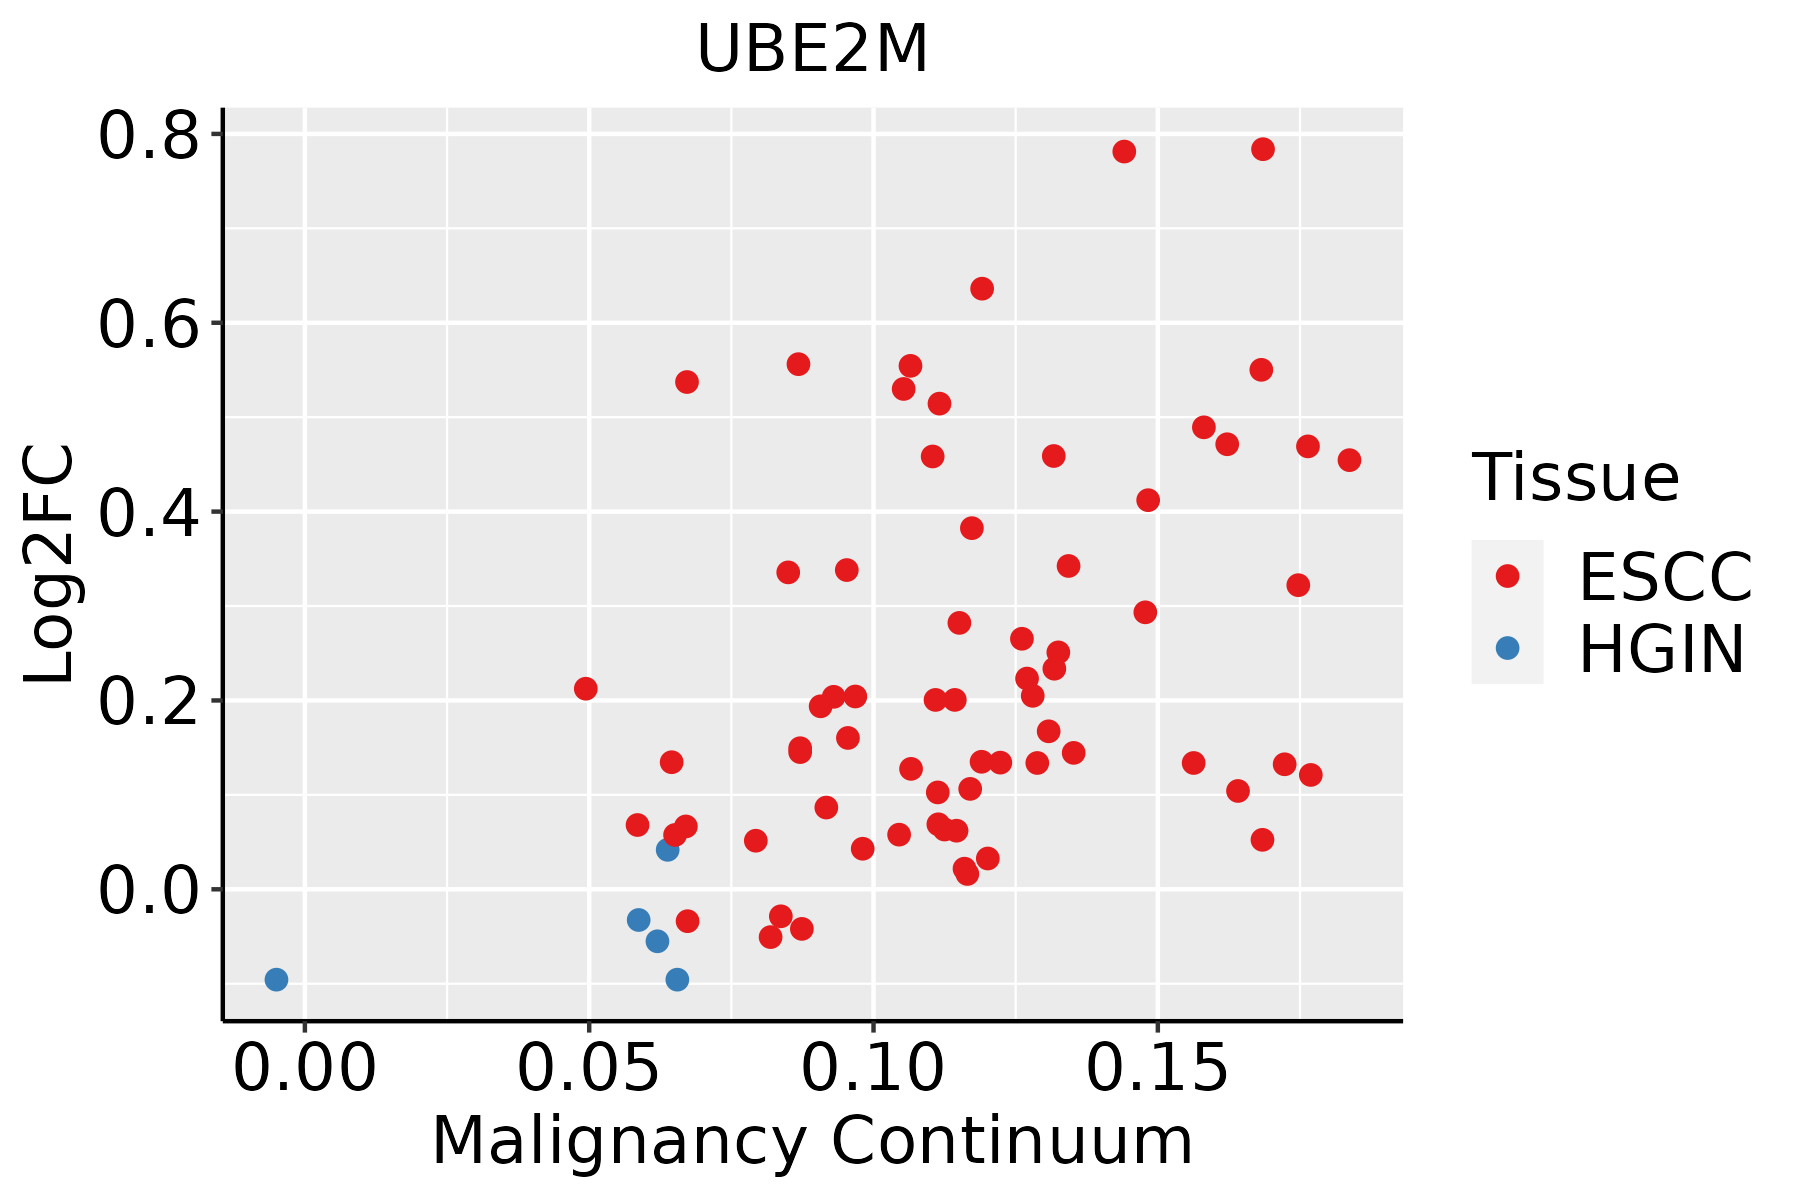 | ESCC: Esophageal squamous cell carcinoma |
| HGIN: High-grade intraepithelial neoplasias |
| LGIN: Low-grade intraepithelial neoplasias |
| Liver | 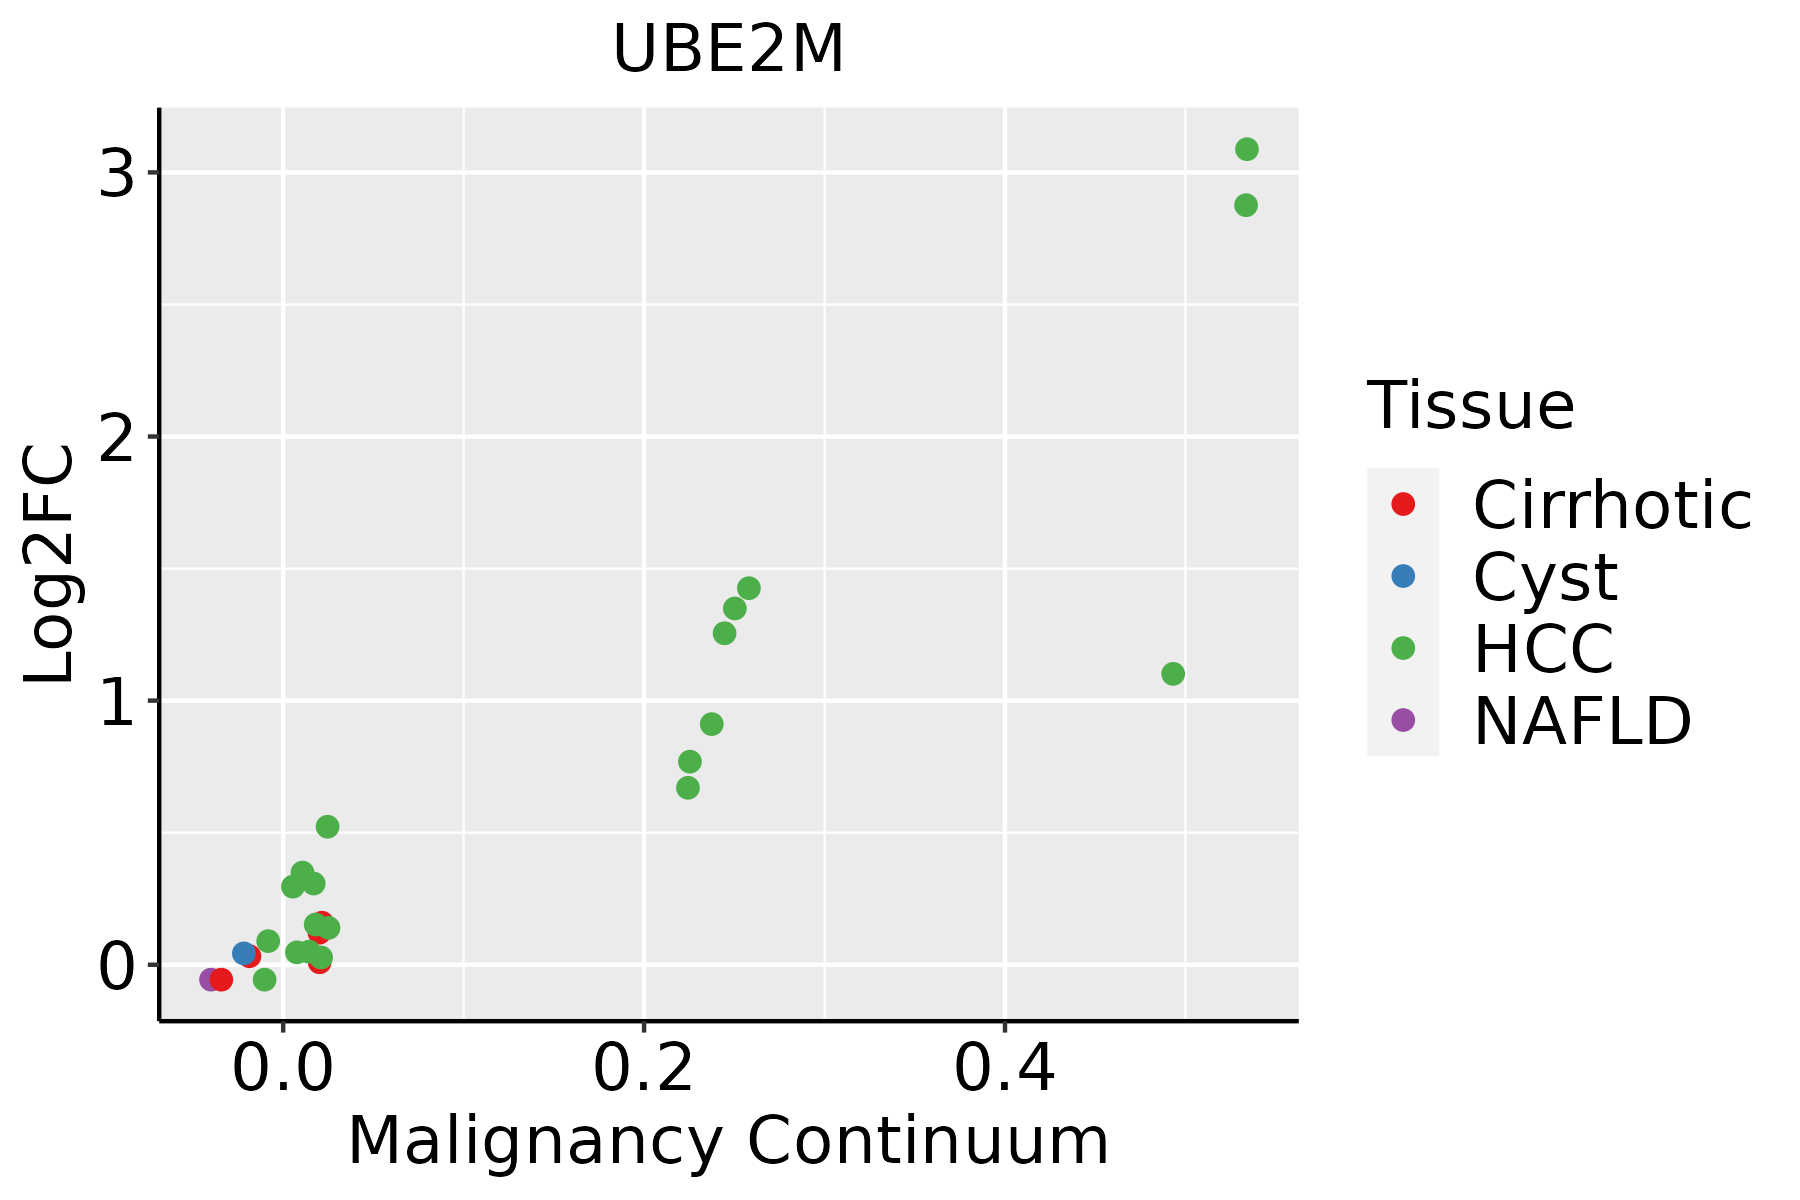 | HCC: Hepatocellular carcinoma |
| NAFLD: Non-alcoholic fatty liver disease |
| Oral Cavity | 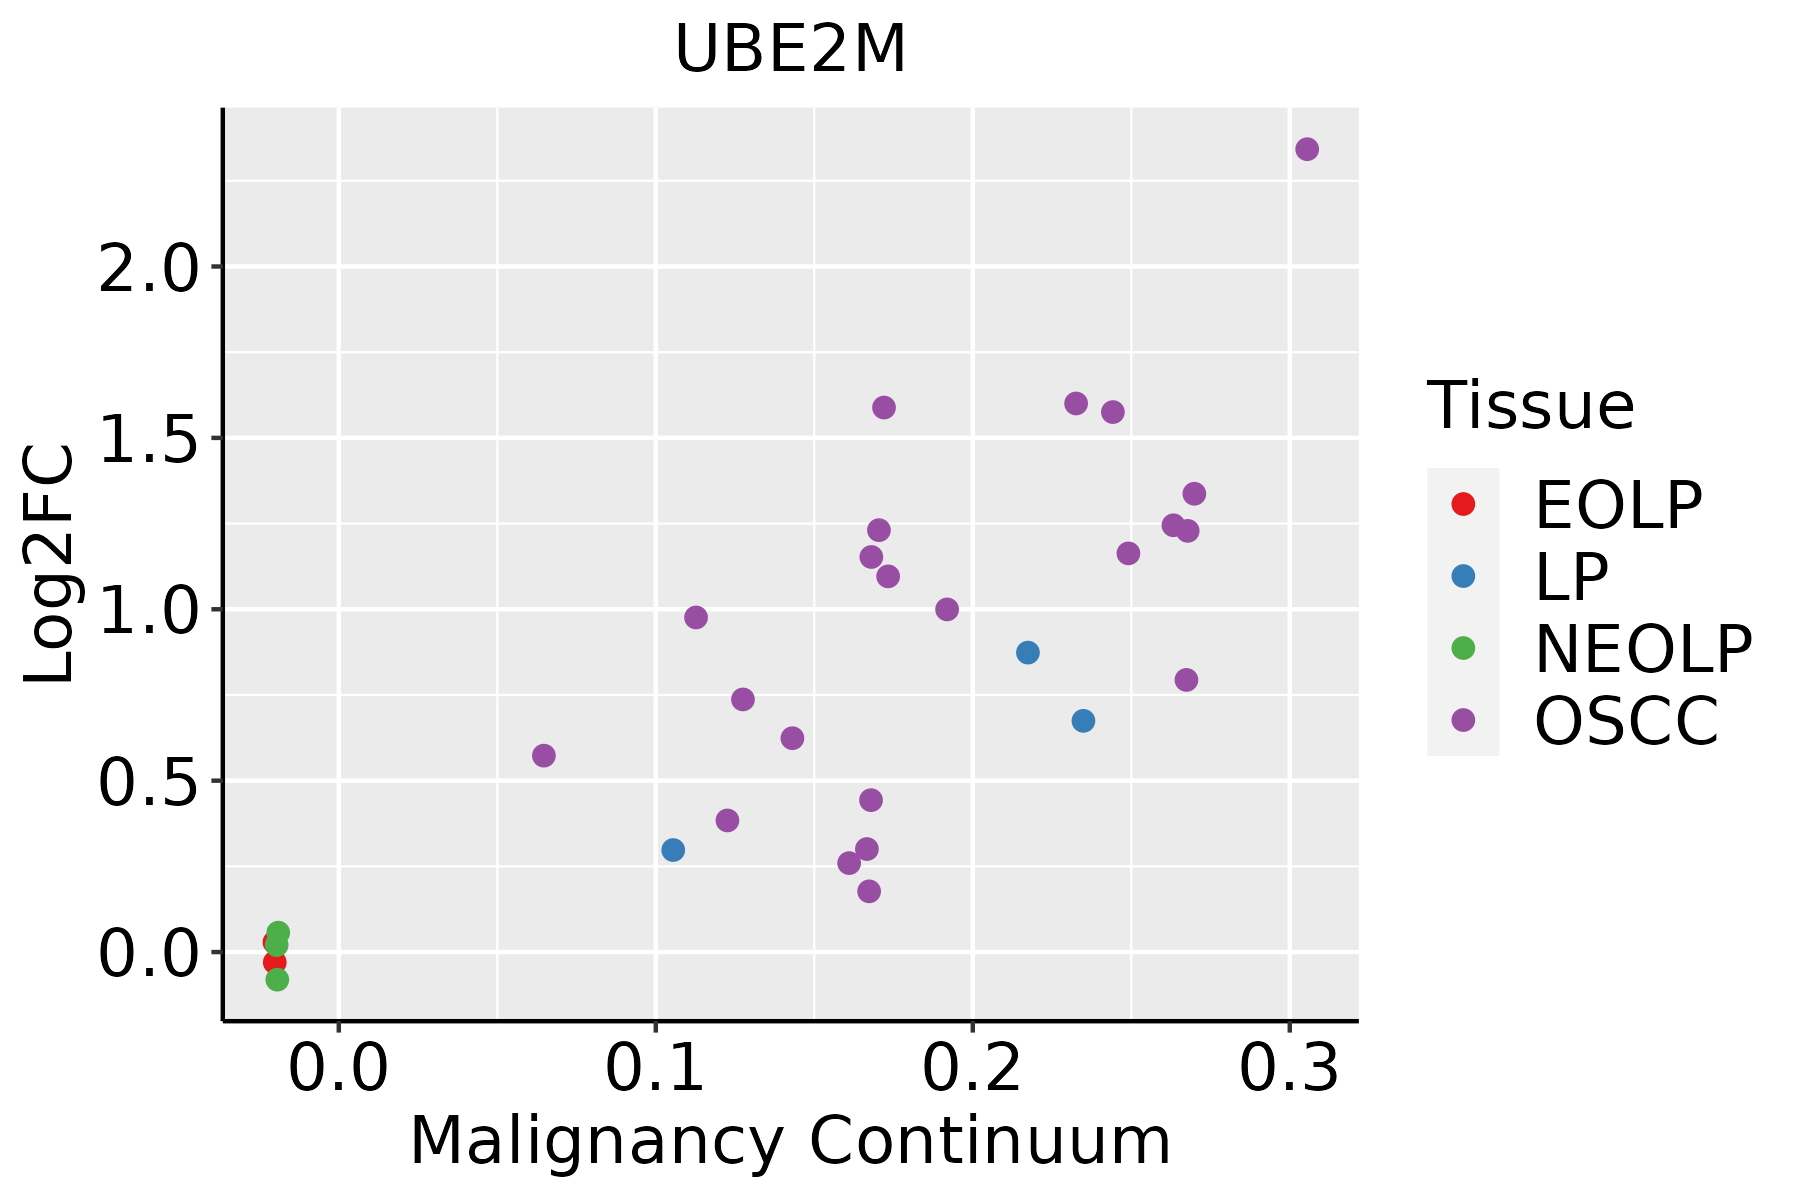 | EOLP: Erosive Oral lichen planus |
| LP: leukoplakia |
| NEOLP: Non-erosive oral lichen planus |
| OSCC: Oral squamous cell carcinoma |
| Prostate |  | BPH: Benign Prostatic Hyperplasia |
| Skin | 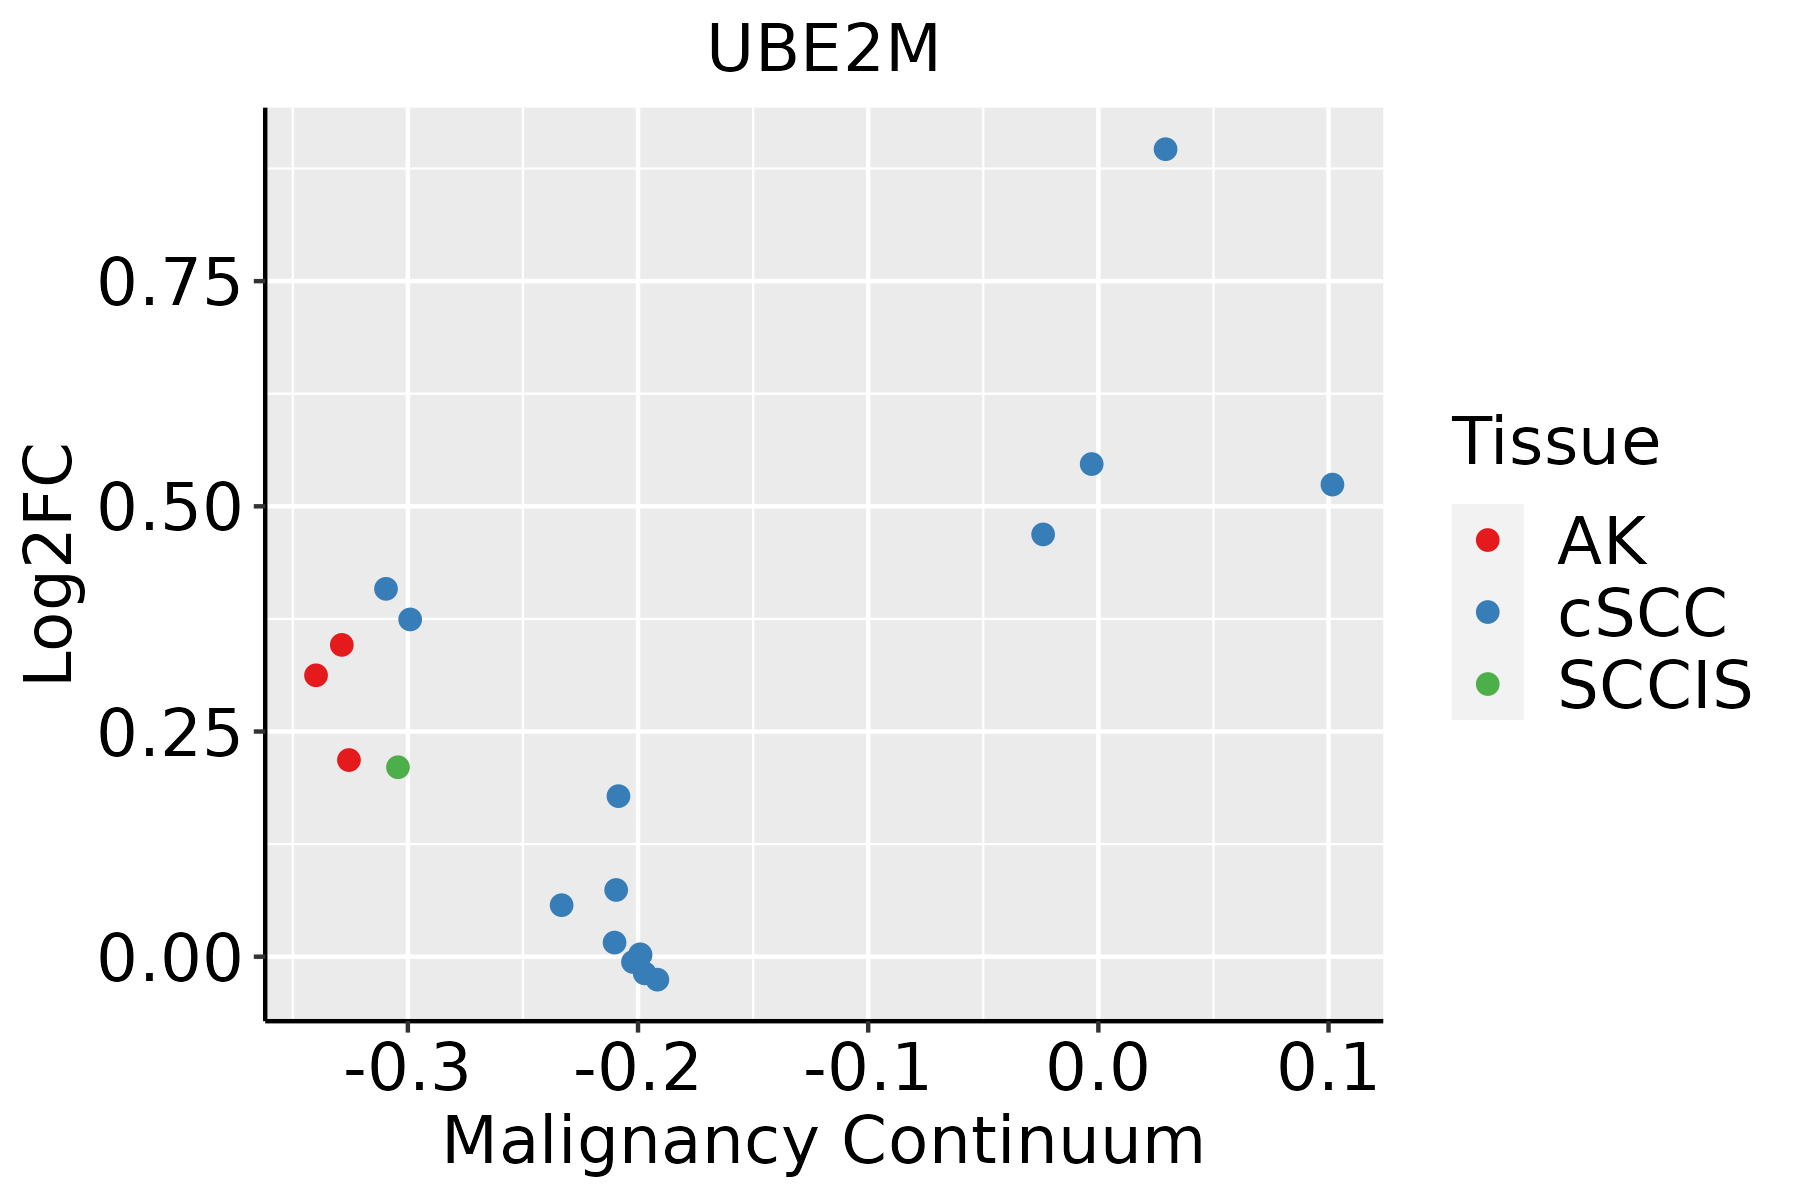 | AK: Actinic keratosis |
| cSCC: Cutaneous squamous cell carcinoma |
| SCCIS:squamous cell carcinoma in situ |
| Thyroid | 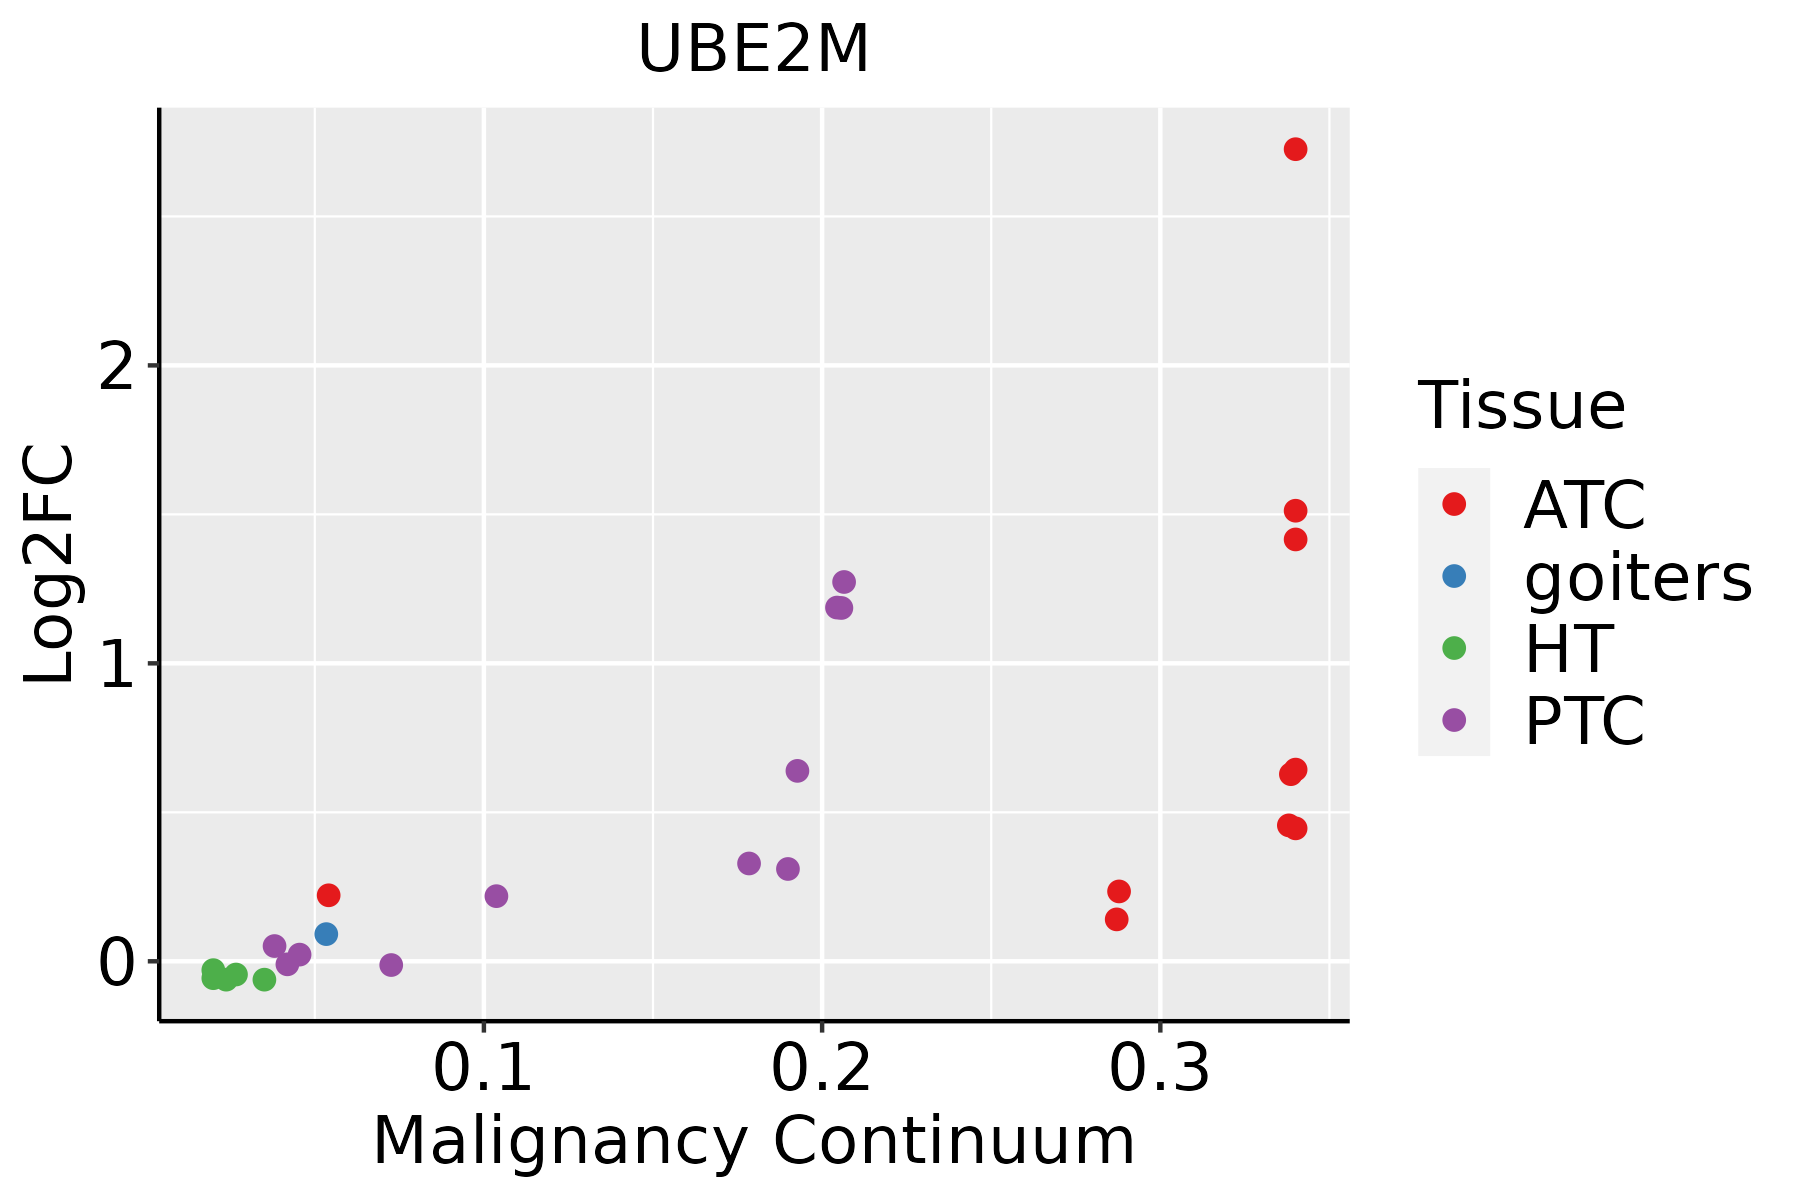 | ATC: Anaplastic thyroid cancer |
| HT: Hashimoto's thyroiditis |
| PTC: Papillary thyroid cancer |
| GO ID | Tissue | Disease Stage | Description | Gene Ratio | Bg Ratio | pvalue | p.adjust | Count |
| GO:00451164 | Prostate | BPH | protein neddylation | 10/3107 | 18/18723 | 1.87e-04 | 1.55e-03 | 10 |
| GO:00435239 | Prostate | BPH | regulation of neuron apoptotic process | 55/3107 | 212/18723 | 3.42e-04 | 2.55e-03 | 55 |
| GO:004352516 | Prostate | BPH | positive regulation of neuron apoptotic process | 20/3107 | 58/18723 | 7.05e-04 | 4.69e-03 | 20 |
| GO:190121619 | Prostate | Tumor | positive regulation of neuron death | 37/3246 | 97/18723 | 8.77e-07 | 1.73e-05 | 37 |
| GO:007099719 | Prostate | Tumor | neuron death | 98/3246 | 361/18723 | 1.81e-06 | 3.19e-05 | 98 |
| GO:190121419 | Prostate | Tumor | regulation of neuron death | 86/3246 | 319/18723 | 1.01e-05 | 1.46e-04 | 86 |
| GO:004511612 | Prostate | Tumor | protein neddylation | 10/3246 | 18/18723 | 2.72e-04 | 2.24e-03 | 10 |
| GO:005140216 | Prostate | Tumor | neuron apoptotic process | 63/3246 | 246/18723 | 6.56e-04 | 4.66e-03 | 63 |
| GO:004352315 | Prostate | Tumor | regulation of neuron apoptotic process | 53/3246 | 212/18723 | 2.92e-03 | 1.58e-02 | 53 |
| GO:004352517 | Prostate | Tumor | positive regulation of neuron apoptotic process | 19/3246 | 58/18723 | 3.18e-03 | 1.66e-02 | 19 |
| GO:007099728 | Skin | AK | neuron death | 63/1910 | 361/18723 | 1.50e-05 | 2.94e-04 | 63 |
| GO:190121425 | Skin | AK | regulation of neuron death | 57/1910 | 319/18723 | 1.87e-05 | 3.52e-04 | 57 |
| GO:190121626 | Skin | AK | positive regulation of neuron death | 22/1910 | 97/18723 | 2.51e-04 | 2.72e-03 | 22 |
| GO:00451167 | Skin | AK | protein neddylation | 7/1910 | 18/18723 | 1.31e-03 | 9.86e-03 | 7 |
| GO:004352318 | Skin | AK | regulation of neuron apoptotic process | 35/1910 | 212/18723 | 2.90e-03 | 1.84e-02 | 35 |
| GO:005140220 | Skin | AK | neuron apoptotic process | 39/1910 | 246/18723 | 3.62e-03 | 2.17e-02 | 39 |
| GO:004352522 | Skin | AK | positive regulation of neuron apoptotic process | 13/1910 | 58/18723 | 4.89e-03 | 2.77e-02 | 13 |
| GO:007099729 | Skin | cSCC | neuron death | 133/4864 | 361/18723 | 2.91e-06 | 4.58e-05 | 133 |
| GO:004511615 | Skin | cSCC | protein neddylation | 14/4864 | 18/18723 | 6.37e-06 | 8.92e-05 | 14 |
| GO:190121627 | Skin | cSCC | positive regulation of neuron death | 42/4864 | 97/18723 | 1.56e-04 | 1.37e-03 | 42 |
| Pathway ID | Tissue | Disease Stage | Description | Gene Ratio | Bg Ratio | pvalue | p.adjust | qvalue | Count |
| hsa0412027 | Esophagus | ESCC | Ubiquitin mediated proteolysis | 122/4205 | 142/8465 | 6.53e-20 | 7.29e-18 | 3.74e-18 | 122 |
| hsa0412036 | Esophagus | ESCC | Ubiquitin mediated proteolysis | 122/4205 | 142/8465 | 6.53e-20 | 7.29e-18 | 3.74e-18 | 122 |
| hsa0412021 | Liver | Cirrhotic | Ubiquitin mediated proteolysis | 72/2530 | 142/8465 | 1.32e-07 | 1.97e-06 | 1.21e-06 | 72 |
| hsa0412031 | Liver | Cirrhotic | Ubiquitin mediated proteolysis | 72/2530 | 142/8465 | 1.32e-07 | 1.97e-06 | 1.21e-06 | 72 |
| hsa0412041 | Liver | HCC | Ubiquitin mediated proteolysis | 110/4020 | 142/8465 | 1.67e-13 | 3.74e-12 | 2.08e-12 | 110 |
| hsa0412051 | Liver | HCC | Ubiquitin mediated proteolysis | 110/4020 | 142/8465 | 1.67e-13 | 3.74e-12 | 2.08e-12 | 110 |
| hsa0412020 | Oral cavity | OSCC | Ubiquitin mediated proteolysis | 105/3704 | 142/8465 | 1.83e-13 | 4.37e-12 | 2.23e-12 | 105 |
| hsa04120110 | Oral cavity | OSCC | Ubiquitin mediated proteolysis | 105/3704 | 142/8465 | 1.83e-13 | 4.37e-12 | 2.23e-12 | 105 |
| hsa0412025 | Oral cavity | LP | Ubiquitin mediated proteolysis | 66/2418 | 142/8465 | 3.74e-06 | 3.46e-05 | 2.23e-05 | 66 |
| hsa0412035 | Oral cavity | LP | Ubiquitin mediated proteolysis | 66/2418 | 142/8465 | 3.74e-06 | 3.46e-05 | 2.23e-05 | 66 |
| hsa0412018 | Prostate | BPH | Ubiquitin mediated proteolysis | 61/1718 | 142/8465 | 5.50e-10 | 9.07e-09 | 5.61e-09 | 61 |
| hsa0412019 | Prostate | BPH | Ubiquitin mediated proteolysis | 61/1718 | 142/8465 | 5.50e-10 | 9.07e-09 | 5.61e-09 | 61 |
| hsa0412024 | Prostate | Tumor | Ubiquitin mediated proteolysis | 61/1791 | 142/8465 | 3.08e-09 | 5.09e-08 | 3.16e-08 | 61 |
| hsa0412034 | Prostate | Tumor | Ubiquitin mediated proteolysis | 61/1791 | 142/8465 | 3.08e-09 | 5.09e-08 | 3.16e-08 | 61 |
| Hugo Symbol | Variant Class | Variant Classification | dbSNP RS | HGVSc | HGVSp | HGVSp Short | SWISSPROT | BIOTYPE | SIFT | PolyPhen | Tumor Sample Barcode | Tissue | Histology | Sex | Age | Stage | Therapy Types | Drugs | Outcome |
| UBE2M | SNV | Missense_Mutation | novel | c.524N>G | p.Ser175Cys | p.S175C | P61081 | protein_coding | deleterious(0.01) | benign(0.116) | TCGA-5L-AAT0-01 | Breast | breast invasive carcinoma | Female | <65 | I/II | Hormone Therapy | tamoxiphen | SD |
| UBE2M | insertion | Nonsense_Mutation | novel | c.450_451insCCAGGCTATTAAAGGGGAATGTTACTGCATG | p.Glu151ProfsTer4 | p.E151Pfs*4 | P61081 | protein_coding | | | TCGA-BH-A0B1-01 | Breast | breast invasive carcinoma | Female | >=65 | I/II | Chemotherapy | adriamycin | SD |
| UBE2M | SNV | Missense_Mutation | novel | c.244N>A | p.Val82Met | p.V82M | P61081 | protein_coding | deleterious(0.01) | probably_damaging(0.992) | TCGA-2W-A8YY-01 | Cervix | cervical & endocervical cancer | Female | <65 | I/II | Chemotherapy | cisplatin | CR |
| UBE2M | SNV | Missense_Mutation | novel | c.486N>C | p.Gln162His | p.Q162H | P61081 | protein_coding | tolerated(0.18) | benign(0.007) | TCGA-C5-A8XH-01 | Cervix | cervical & endocervical cancer | Female | <65 | I/II | Unknown | Unknown | SD |
| UBE2M | SNV | Missense_Mutation | novel | c.319N>A | p.Glu107Lys | p.E107K | P61081 | protein_coding | deleterious(0) | benign(0.275) | TCGA-DG-A2KL-01 | Cervix | cervical & endocervical cancer | Female | <65 | I/II | Chemotherapy | cisplatin | SD |
| UBE2M | SNV | Missense_Mutation | novel | c.521G>A | p.Gly174Asp | p.G174D | P61081 | protein_coding | tolerated(0.3) | benign(0.031) | TCGA-EA-A3HS-01 | Cervix | cervical & endocervical cancer | Female | <65 | I/II | Unknown | Unknown | SD |
| UBE2M | SNV | Missense_Mutation | novel | c.481N>C | p.Glu161Gln | p.E161Q | P61081 | protein_coding | tolerated(0.21) | benign(0.207) | TCGA-VS-A8EK-01 | Cervix | cervical & endocervical cancer | Female | >=65 | I/II | Chemotherapy | cisplatin | PD |
| UBE2M | SNV | Missense_Mutation | rs747189992 | c.50N>T | p.Ala17Val | p.A17V | P61081 | protein_coding | tolerated(0.1) | benign(0.003) | TCGA-AA-3492-01 | Colorectum | colon adenocarcinoma | Female | >=65 | I/II | Unknown | Unknown | SD |
| UBE2M | SNV | Missense_Mutation | | c.235N>G | p.Ser79Gly | p.S79G | P61081 | protein_coding | deleterious(0.01) | benign(0.397) | TCGA-G4-6586-01 | Colorectum | colon adenocarcinoma | Female | >=65 | I/II | Unknown | Unknown | SD |
| UBE2M | SNV | Missense_Mutation | novel | c.506G>A | p.Arg169Gln | p.R169Q | P61081 | protein_coding | tolerated(0.26) | benign(0.005) | TCGA-A5-A0G2-01 | Endometrium | uterine corpus endometrioid carcinoma | Female | <65 | III/IV | Unknown | Unknown | SD |


