
|
|||||
|
 | |
| |
| |
| |
| |
| |
|
Gene: TSPAN6 |
Gene summary for TSPAN6 |
| Gene information | Species | Human | Gene symbol | TSPAN6 | Gene ID | 7105 |
| Gene name | tetraspanin 6 | |
| Gene Alias | T245 | |
| Cytomap | Xq22.1 | |
| Gene Type | protein-coding | GO ID | GO:0002221 | UniProtAcc | A0A024RCI0 |
Top |
Malignant transformation analysis |
| Identification of the aberrant gene expression in precancerous and cancerous lesions by comparing the gene expression of stem-like cells in diseased tissues with normal stem cells |
| Entrez ID | Symbol | Replicates | Species | Organ | Tissue | Adj P-value | Log2FC | Malignancy |
| 7105 | TSPAN6 | HTA11_78_2000001011 | Human | Colorectum | AD | 2.22e-04 | 4.29e-01 | -0.1088 |
| 7105 | TSPAN6 | HTA11_347_2000001011 | Human | Colorectum | AD | 3.20e-09 | 4.86e-01 | -0.1954 |
| 7105 | TSPAN6 | HTA11_866_3004761011 | Human | Colorectum | AD | 1.91e-03 | 3.44e-01 | 0.096 |
| 7105 | TSPAN6 | HTA11_99999970781_79442 | Human | Colorectum | MSS | 4.99e-04 | 2.44e-01 | 0.294 |
| 7105 | TSPAN6 | HTA11_99999965104_69814 | Human | Colorectum | MSS | 1.55e-13 | 6.78e-01 | 0.281 |
| 7105 | TSPAN6 | HTA11_99999971662_82457 | Human | Colorectum | MSS | 5.17e-11 | 4.60e-01 | 0.3859 |
| 7105 | TSPAN6 | HTA11_99999974143_84620 | Human | Colorectum | MSS | 1.12e-07 | 3.13e-01 | 0.3005 |
| 7105 | TSPAN6 | A018-E-020 | Human | Colorectum | FAP | 2.03e-02 | -1.10e-01 | -0.2034 |
| 7105 | TSPAN6 | LZE3D | Human | Esophagus | HGIN | 4.06e-04 | 4.66e-01 | 0.0668 |
| 7105 | TSPAN6 | LZE4T | Human | Esophagus | ESCC | 2.23e-04 | 2.46e-01 | 0.0811 |
| 7105 | TSPAN6 | LZE7T | Human | Esophagus | ESCC | 2.32e-04 | 9.09e-01 | 0.0667 |
| 7105 | TSPAN6 | LZE8T | Human | Esophagus | ESCC | 1.90e-10 | 4.23e-01 | 0.067 |
| 7105 | TSPAN6 | LZE20T | Human | Esophagus | ESCC | 6.61e-11 | 9.30e-01 | 0.0662 |
| 7105 | TSPAN6 | LZE22T | Human | Esophagus | ESCC | 2.27e-02 | 7.54e-01 | 0.068 |
| 7105 | TSPAN6 | LZE24T | Human | Esophagus | ESCC | 3.92e-29 | 1.32e+00 | 0.0596 |
| 7105 | TSPAN6 | P1T-E | Human | Esophagus | ESCC | 4.22e-03 | 9.82e-01 | 0.0875 |
| 7105 | TSPAN6 | P2T-E | Human | Esophagus | ESCC | 4.35e-63 | 1.20e+00 | 0.1177 |
| 7105 | TSPAN6 | P4T-E | Human | Esophagus | ESCC | 9.97e-33 | 1.05e+00 | 0.1323 |
| 7105 | TSPAN6 | P5T-E | Human | Esophagus | ESCC | 1.66e-18 | 1.94e-01 | 0.1327 |
| 7105 | TSPAN6 | P8T-E | Human | Esophagus | ESCC | 7.49e-50 | 1.26e+00 | 0.0889 |
| Page: 1 2 3 4 5 6 7 |
| Tissue | Expression Dynamics | Abbreviation |
| Colorectum (GSE201348) |  | FAP: Familial adenomatous polyposis |
| CRC: Colorectal cancer | ||
| Colorectum (HTA11) |  | AD: Adenomas |
| SER: Sessile serrated lesions | ||
| MSI-H: Microsatellite-high colorectal cancer | ||
| MSS: Microsatellite stable colorectal cancer | ||
| Esophagus | 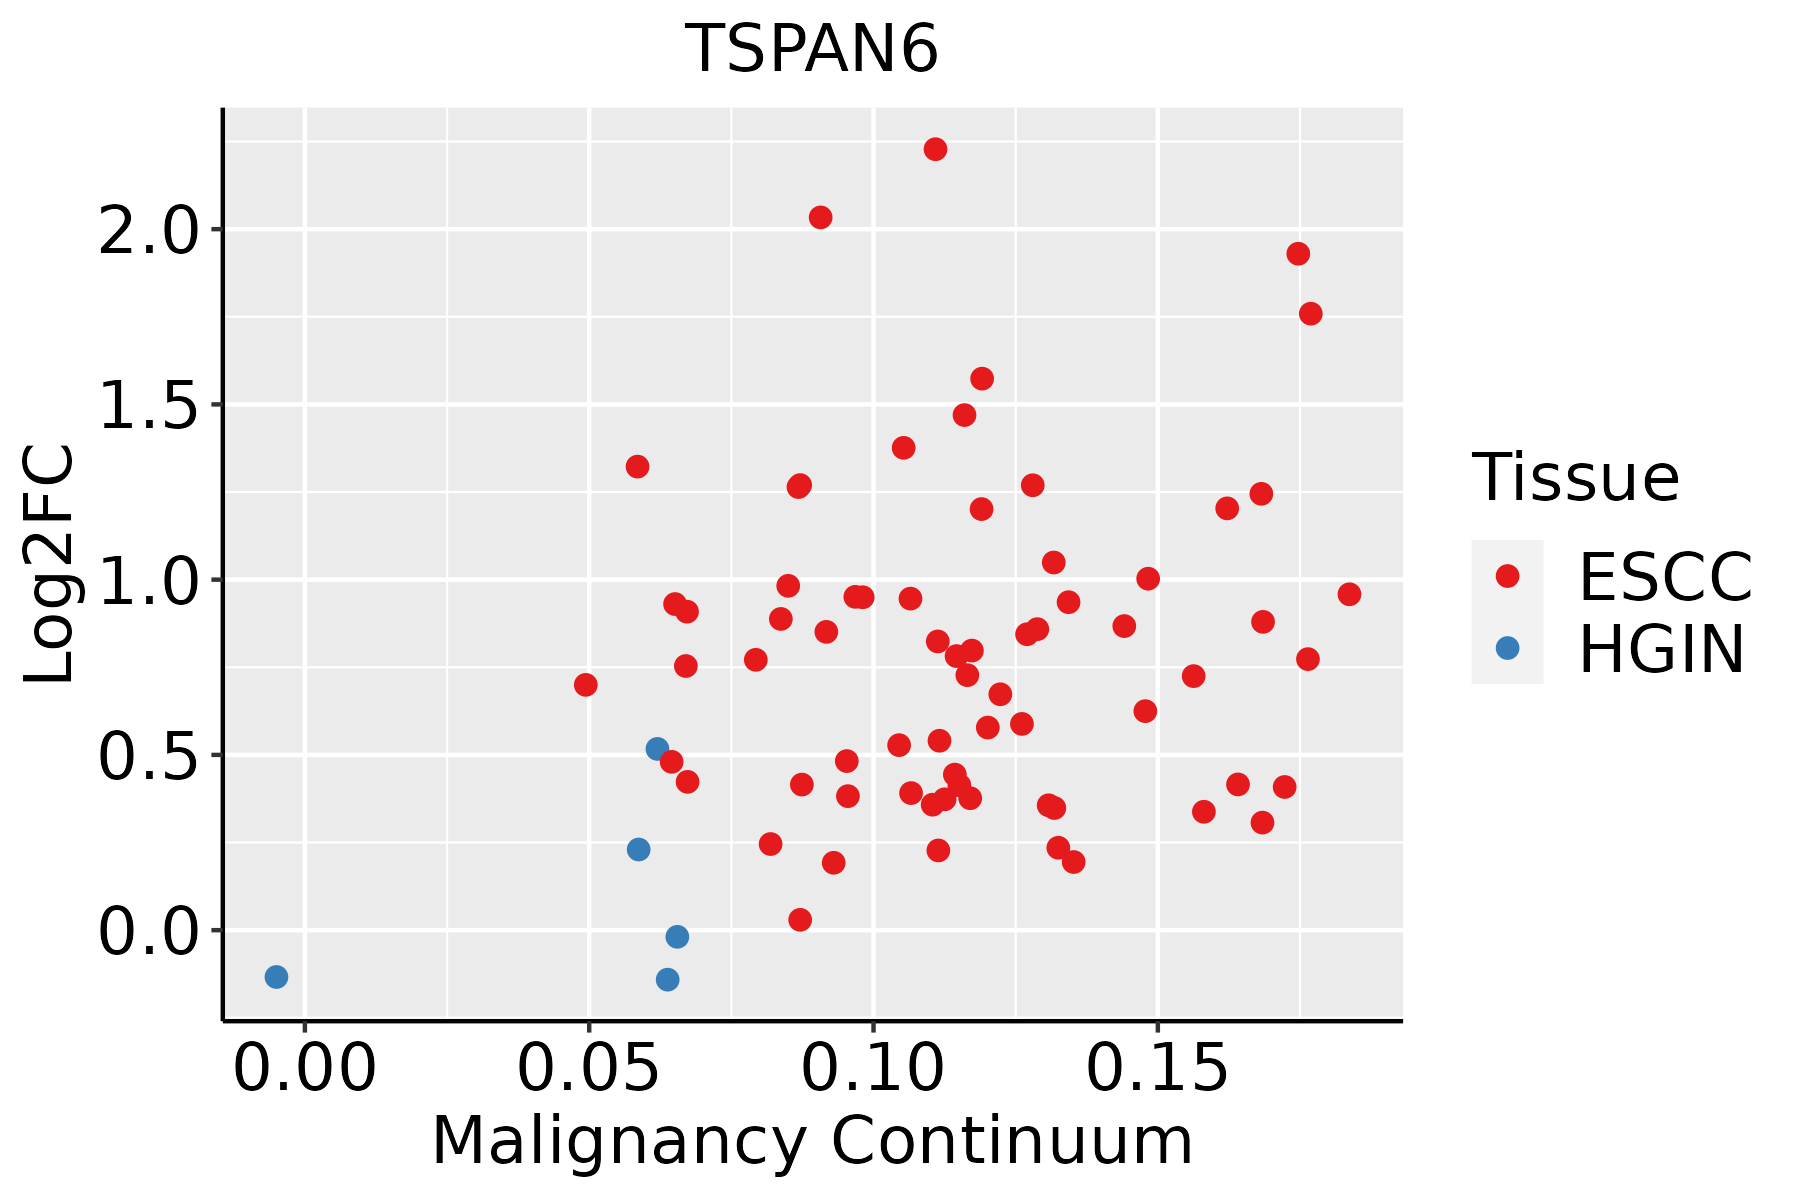 | ESCC: Esophageal squamous cell carcinoma |
| HGIN: High-grade intraepithelial neoplasias | ||
| LGIN: Low-grade intraepithelial neoplasias | ||
| Liver | 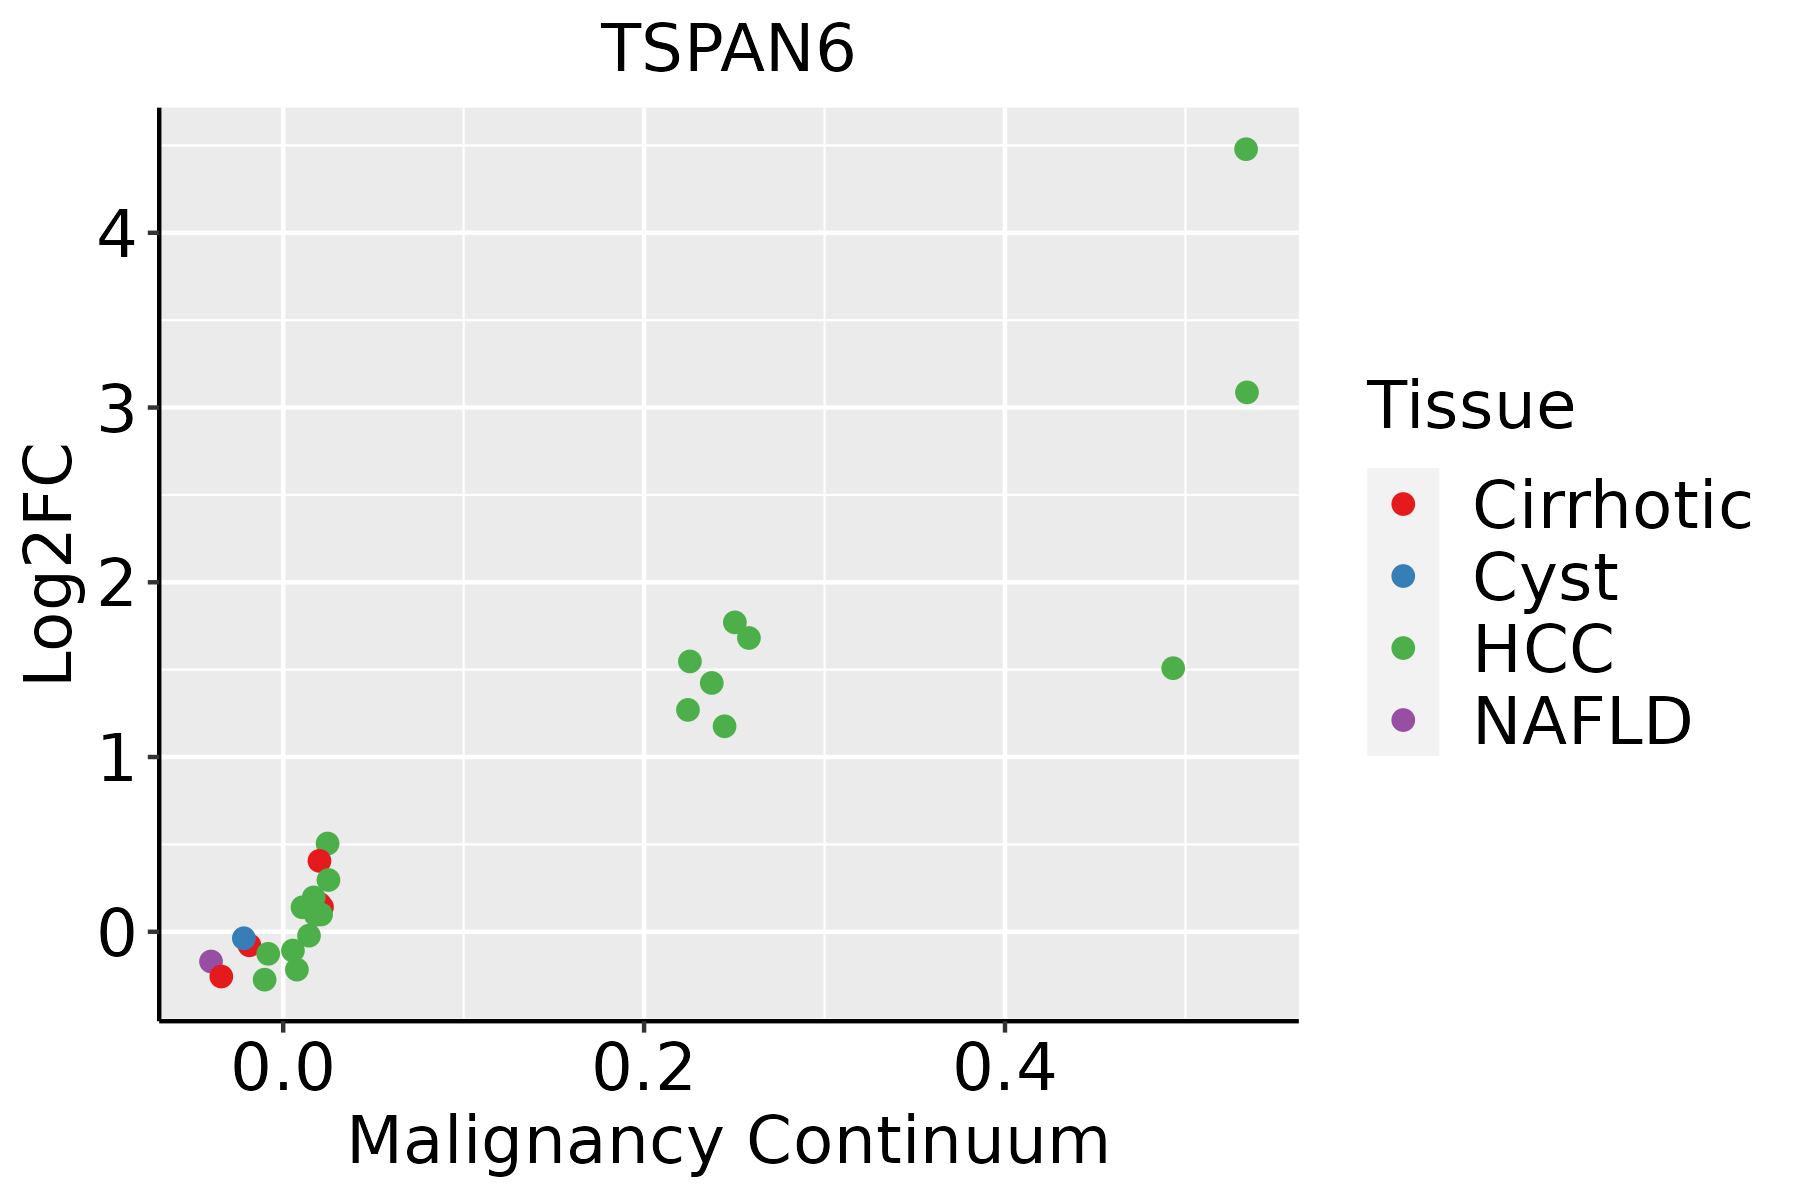 | HCC: Hepatocellular carcinoma |
| NAFLD: Non-alcoholic fatty liver disease | ||
| Oral Cavity | 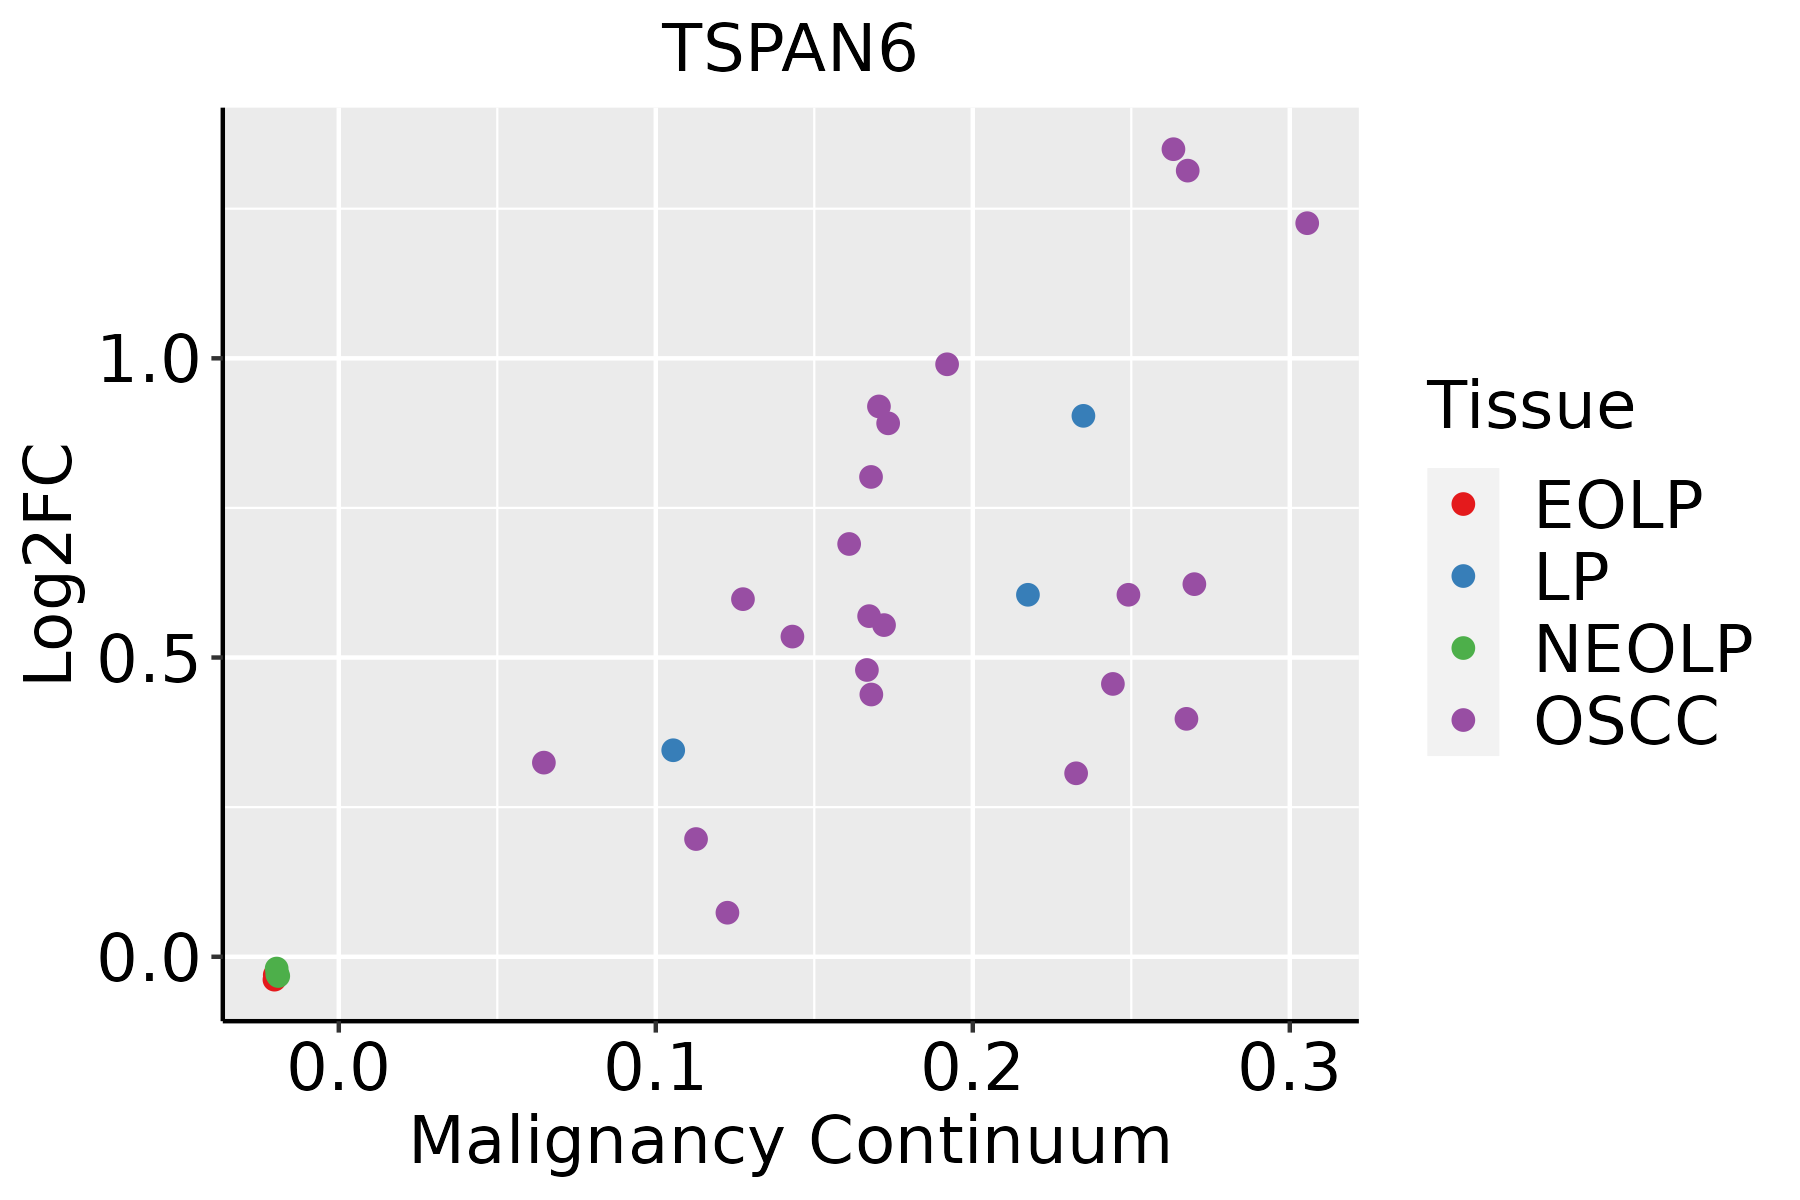 | EOLP: Erosive Oral lichen planus |
| LP: leukoplakia | ||
| NEOLP: Non-erosive oral lichen planus | ||
| OSCC: Oral squamous cell carcinoma | ||
| Skin | 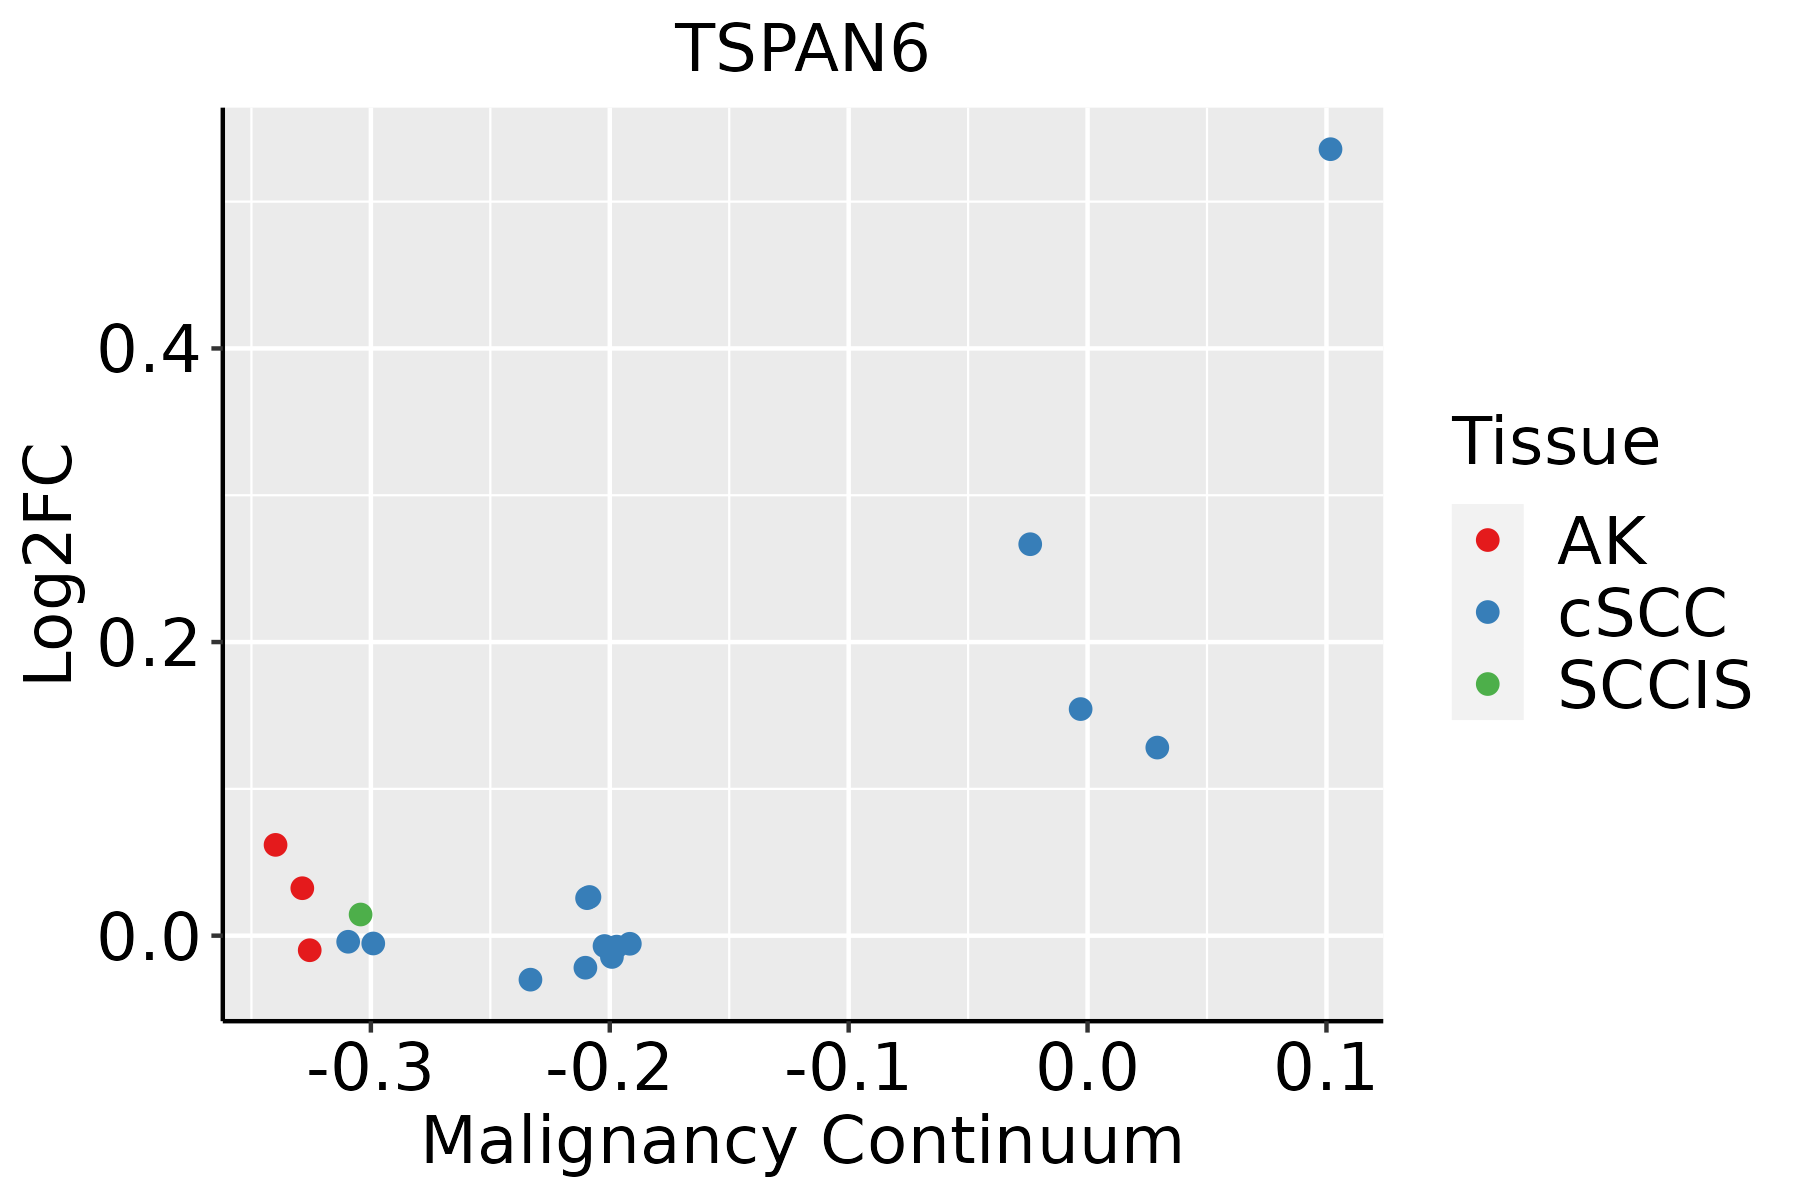 | AK: Actinic keratosis |
| cSCC: Cutaneous squamous cell carcinoma | ||
| SCCIS:squamous cell carcinoma in situ | ||
| Thyroid |  | ATC: Anaplastic thyroid cancer |
| HT: Hashimoto's thyroiditis | ||
| PTC: Papillary thyroid cancer |
| ∗log2FC in expression of this searched gene in stem-like cells from each diseased tissue sample relative to stem-like cells in normal samples in each tissue plotted against the malignancy continuum. Samples are colored based on if they are from different disease stage. |
Top |
Malignant transformation related pathway analysis |
| Find out the enriched GO biological processes and KEGG pathways involved in transition from healthy to precancer to cancer |
| Tissue | Disease Stage | Enriched GO biological Processes |
| Colorectum | AD |  |
| Colorectum | SER |  |
| Colorectum | MSS |  |
| Colorectum | MSI-H |  |
| Colorectum | FAP |  |
| ∗Top 15 enriched GO BP terms are showed in the bar plot of each disease state in each tissue. Each row represents a significant GO biological process which is colored according to the -log10(p.adjust). |
| Page: 1 2 3 4 5 6 7 8 9 |
| GO ID | Tissue | Disease Stage | Description | Gene Ratio | Bg Ratio | pvalue | p.adjust | Count |
| GO:0140546 | Liver | Cirrhotic | defense response to symbiont | 84/4634 | 265/18723 | 6.02e-03 | 3.00e-02 | 84 |
| GO:00028311 | Liver | Cirrhotic | regulation of response to biotic stimulus | 101/4634 | 327/18723 | 6.58e-03 | 3.25e-02 | 101 |
| GO:00985862 | Liver | Cirrhotic | cellular response to virus | 31/4634 | 84/18723 | 8.75e-03 | 4.04e-02 | 31 |
| GO:003052222 | Liver | HCC | intracellular receptor signaling pathway | 171/7958 | 265/18723 | 3.00e-13 | 1.61e-11 | 171 |
| GO:000961511 | Liver | HCC | response to virus | 210/7958 | 367/18723 | 7.32e-09 | 1.86e-07 | 210 |
| GO:0039528 | Liver | HCC | cytoplasmic pattern recognition receptor signaling pathway in response to virus | 30/7958 | 34/18723 | 3.88e-08 | 8.39e-07 | 30 |
| GO:00027533 | Liver | HCC | cytoplasmic pattern recognition receptor signaling pathway | 46/7958 | 60/18723 | 7.37e-08 | 1.49e-06 | 46 |
| GO:00022211 | Liver | HCC | pattern recognition receptor signaling pathway | 107/7958 | 172/18723 | 1.37e-07 | 2.58e-06 | 107 |
| GO:00516071 | Liver | HCC | defense response to virus | 151/7958 | 265/18723 | 1.27e-06 | 1.85e-05 | 151 |
| GO:01405461 | Liver | HCC | defense response to symbiont | 151/7958 | 265/18723 | 1.27e-06 | 1.85e-05 | 151 |
| GO:00985861 | Liver | HCC | cellular response to virus | 57/7958 | 84/18723 | 2.30e-06 | 3.11e-05 | 57 |
| GO:000724912 | Liver | HCC | I-kappaB kinase/NF-kappaB signaling | 156/7958 | 281/18723 | 6.66e-06 | 8.00e-05 | 156 |
| GO:004312312 | Liver | HCC | positive regulation of I-kappaB kinase/NF-kappaB signaling | 108/7958 | 186/18723 | 1.28e-05 | 1.43e-04 | 108 |
| GO:004312212 | Liver | HCC | regulation of I-kappaB kinase/NF-kappaB signaling | 138/7958 | 249/18723 | 2.47e-05 | 2.58e-04 | 138 |
| GO:0039531 | Liver | HCC | regulation of viral-induced cytoplasmic pattern recognition receptor signaling pathway | 20/7958 | 24/18723 | 4.92e-05 | 4.70e-04 | 20 |
| GO:00028321 | Liver | HCC | negative regulation of response to biotic stimulus | 66/7958 | 108/18723 | 7.24e-05 | 6.50e-04 | 66 |
| GO:00028312 | Liver | HCC | regulation of response to biotic stimulus | 173/7958 | 327/18723 | 8.55e-05 | 7.48e-04 | 173 |
| GO:0050687 | Liver | HCC | negative regulation of defense response to virus | 18/7958 | 24/18723 | 1.27e-03 | 6.92e-03 | 18 |
| GO:00622072 | Liver | HCC | regulation of pattern recognition receptor signaling pathway | 59/7958 | 105/18723 | 3.18e-03 | 1.47e-02 | 59 |
| GO:0050688 | Liver | HCC | regulation of defense response to virus | 41/7958 | 69/18723 | 3.38e-03 | 1.54e-02 | 41 |
| Page: 1 2 3 4 5 6 7 8 |
| Pathway ID | Tissue | Disease Stage | Description | Gene Ratio | Bg Ratio | pvalue | p.adjust | qvalue | Count |
| Page: 1 |
Top |
Cell-cell communication analysis |
| Identification of potential cell-cell interactions between two cell types and their ligand-receptor pairs for different disease states |
| Ligand | Receptor | LRpair | Pathway | Tissue | Disease Stage |
| Page: 1 |
Top |
Single-cell gene regulatory network inference analysis |
| Find out the significant the regulons (TFs) and the target genes of each regulon across cell types for different disease states |
| TF | Cell Type | Tissue | Disease Stage | Target Gene | RSS | Regulon Activity |
| ∗The dot plots of a searched regulon are shown for all cell subpopulations in each disease state of each tissue based on the regulon specific score inferred using pySCENIC and by calculating the average expression. |
| Page: 1 |
Top |
Somatic mutation of malignant transformation related genes |
| Annotation of somatic variants for genes involved in malignant transformation |
| Hugo Symbol | Variant Class | Variant Classification | dbSNP RS | HGVSc | HGVSp | HGVSp Short | SWISSPROT | BIOTYPE | SIFT | PolyPhen | Tumor Sample Barcode | Tissue | Histology | Sex | Age | Stage | Therapy Types | Drugs | Outcome |
| TSPAN6 | SNV | Missense_Mutation | novel | c.251N>A | p.Arg84Gln | p.R84Q | O43657 | protein_coding | deleterious(0.05) | benign(0.054) | TCGA-E9-A5FL-01 | Breast | breast invasive carcinoma | Female | >=65 | I/II | Unknown | Unknown | SD |
| TSPAN6 | SNV | Missense_Mutation | novel | c.349N>A | p.Glu117Lys | p.E117K | O43657 | protein_coding | tolerated(0.3) | benign(0.163) | TCGA-VS-A9UD-01 | Cervix | cervical & endocervical cancer | Female | >=65 | III/IV | Chemotherapy | cisplatin | CR |
| TSPAN6 | SNV | Missense_Mutation | novel | c.89N>C | p.Ile30Thr | p.I30T | O43657 | protein_coding | deleterious(0) | possibly_damaging(0.77) | TCGA-5M-AAT6-01 | Colorectum | colon adenocarcinoma | Female | <65 | III/IV | Unknown | Unknown | PD |
| TSPAN6 | SNV | Missense_Mutation | c.59N>C | p.Val20Ala | p.V20A | O43657 | protein_coding | deleterious(0.01) | benign(0.015) | TCGA-AA-A01P-01 | Colorectum | colon adenocarcinoma | Female | >=65 | III/IV | Unknown | Unknown | PD | |
| TSPAN6 | SNV | Missense_Mutation | c.386N>A | p.Ala129Asp | p.A129D | O43657 | protein_coding | deleterious(0.03) | benign(0.156) | TCGA-CM-5861-01 | Colorectum | colon adenocarcinoma | Female | <65 | I/II | Unknown | Unknown | PD | |
| TSPAN6 | SNV | Missense_Mutation | novel | c.618G>T | p.Glu206Asp | p.E206D | O43657 | protein_coding | tolerated(0.08) | benign(0.378) | TCGA-AG-A002-01 | Colorectum | rectum adenocarcinoma | Male | <65 | I/II | Unknown | Unknown | SD |
| TSPAN6 | SNV | Missense_Mutation | c.364N>G | p.Phe122Val | p.F122V | O43657 | protein_coding | deleterious(0) | possibly_damaging(0.741) | TCGA-A5-A0GU-01 | Endometrium | uterine corpus endometrioid carcinoma | Female | <65 | I/II | Unknown | Unknown | SD | |
| TSPAN6 | SNV | Missense_Mutation | rs371334172 | c.620N>T | p.Ser207Leu | p.S207L | O43657 | protein_coding | deleterious(0.02) | possibly_damaging(0.806) | TCGA-A5-A0VP-01 | Endometrium | uterine corpus endometrioid carcinoma | Female | >=65 | I/II | Unknown | Unknown | SD |
| TSPAN6 | SNV | Missense_Mutation | c.136N>G | p.Leu46Val | p.L46V | O43657 | protein_coding | deleterious(0) | possibly_damaging(0.897) | TCGA-AJ-A23M-01 | Endometrium | uterine corpus endometrioid carcinoma | Female | <65 | I/II | Chemotherapy | unknown | PD | |
| TSPAN6 | SNV | Missense_Mutation | rs745504645 | c.704N>A | p.Arg235His | p.R235H | O43657 | protein_coding | deleterious(0.04) | benign(0.031) | TCGA-AP-A1DV-01 | Endometrium | uterine corpus endometrioid carcinoma | Female | <65 | I/II | Unknown | Unknown | SD |
| Page: 1 2 3 |
Top |
Related drugs of malignant transformation related genes |
| Identification of chemicals and drugs interact with genes involved in malignant transfromation |
| (DGIdb 4.0) |
| Entrez ID | Symbol | Category | Interaction Types | Drug Claim Name | Drug Name | PMIDs |
| Page: 1 |

Copyright 2023-Present -The University of Texas Health Science Center at Houston |