
|
|||||
|
 | |
| |
| |
| |
| |
| |
|
Gene: TRIM11 |
Gene summary for TRIM11 |
| Gene information | Species | Human | Gene symbol | TRIM11 | Gene ID | 81559 |
| Gene name | tripartite motif containing 11 | |
| Gene Alias | BIA1 | |
| Cytomap | 1q42.13 | |
| Gene Type | protein-coding | GO ID | GO:0002376 | UniProtAcc | Q96F44 |
Top |
Malignant transformation analysis |
| Identification of the aberrant gene expression in precancerous and cancerous lesions by comparing the gene expression of stem-like cells in diseased tissues with normal stem cells |
| Entrez ID | Symbol | Replicates | Species | Organ | Tissue | Adj P-value | Log2FC | Malignancy |
| 81559 | TRIM11 | LZE7T | Human | Esophagus | ESCC | 4.35e-07 | 2.01e-01 | 0.0667 |
| 81559 | TRIM11 | LZE20T | Human | Esophagus | ESCC | 1.09e-07 | 1.95e-01 | 0.0662 |
| 81559 | TRIM11 | LZE21D1 | Human | Esophagus | HGIN | 1.49e-02 | 1.98e-01 | 0.0632 |
| 81559 | TRIM11 | LZE24T | Human | Esophagus | ESCC | 4.30e-09 | 3.32e-01 | 0.0596 |
| 81559 | TRIM11 | LZE22D3 | Human | Esophagus | HGIN | 4.34e-02 | 3.75e-01 | 0.0653 |
| 81559 | TRIM11 | LZE21T | Human | Esophagus | ESCC | 1.98e-02 | 2.78e-01 | 0.0655 |
| 81559 | TRIM11 | P1T-E | Human | Esophagus | ESCC | 1.99e-10 | 5.34e-01 | 0.0875 |
| 81559 | TRIM11 | P2T-E | Human | Esophagus | ESCC | 6.69e-20 | 2.76e-01 | 0.1177 |
| 81559 | TRIM11 | P4T-E | Human | Esophagus | ESCC | 6.84e-08 | 1.44e-01 | 0.1323 |
| 81559 | TRIM11 | P5T-E | Human | Esophagus | ESCC | 9.50e-18 | 3.65e-01 | 0.1327 |
| 81559 | TRIM11 | P8T-E | Human | Esophagus | ESCC | 1.98e-13 | 1.58e-01 | 0.0889 |
| 81559 | TRIM11 | P9T-E | Human | Esophagus | ESCC | 6.06e-13 | 2.31e-01 | 0.1131 |
| 81559 | TRIM11 | P10T-E | Human | Esophagus | ESCC | 1.11e-19 | 2.23e-01 | 0.116 |
| 81559 | TRIM11 | P11T-E | Human | Esophagus | ESCC | 1.92e-06 | 3.10e-01 | 0.1426 |
| 81559 | TRIM11 | P12T-E | Human | Esophagus | ESCC | 9.70e-14 | 2.06e-01 | 0.1122 |
| 81559 | TRIM11 | P15T-E | Human | Esophagus | ESCC | 1.69e-20 | 5.00e-01 | 0.1149 |
| 81559 | TRIM11 | P16T-E | Human | Esophagus | ESCC | 3.82e-08 | 2.26e-01 | 0.1153 |
| 81559 | TRIM11 | P17T-E | Human | Esophagus | ESCC | 5.87e-04 | 2.78e-01 | 0.1278 |
| 81559 | TRIM11 | P20T-E | Human | Esophagus | ESCC | 1.65e-14 | 3.62e-01 | 0.1124 |
| 81559 | TRIM11 | P21T-E | Human | Esophagus | ESCC | 1.05e-20 | 3.35e-01 | 0.1617 |
| Page: 1 2 3 4 5 |
| Tissue | Expression Dynamics | Abbreviation |
| Esophagus | 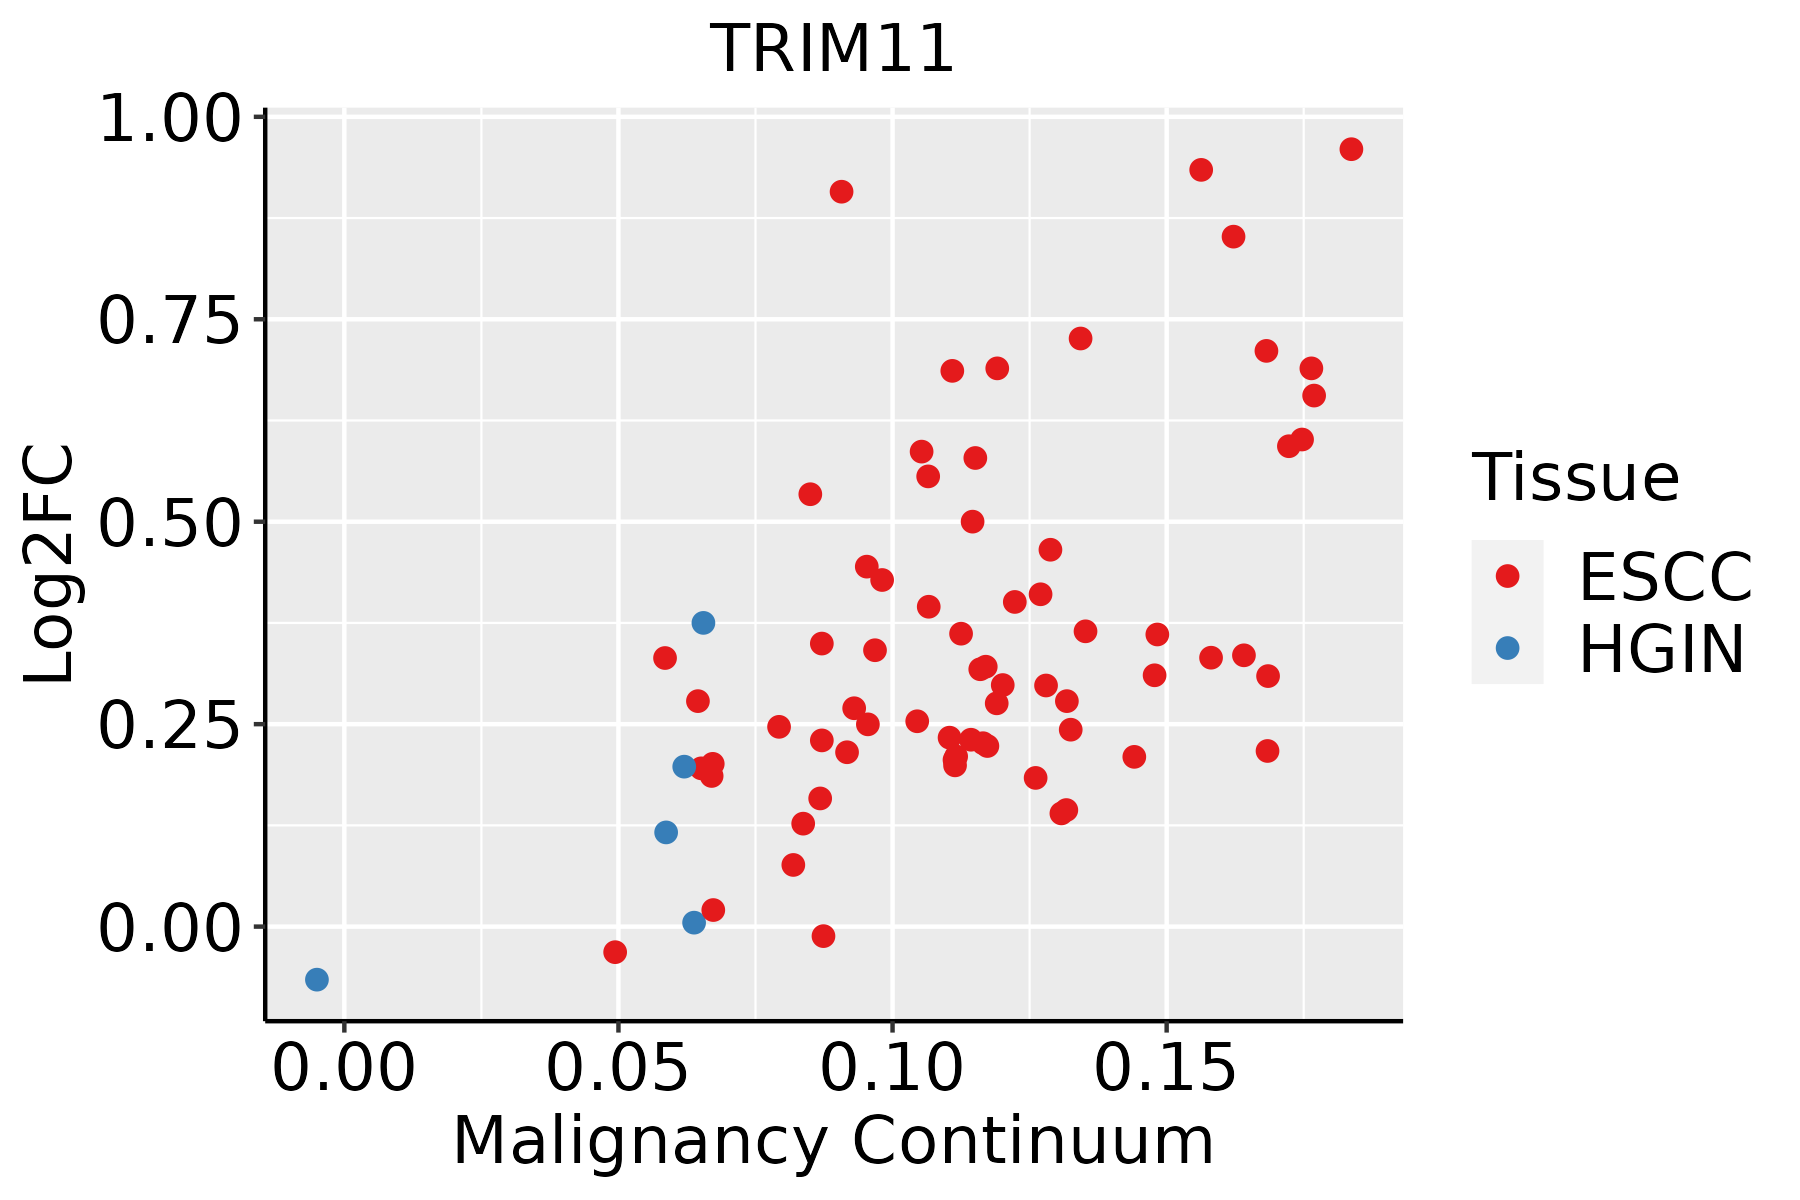 | ESCC: Esophageal squamous cell carcinoma |
| HGIN: High-grade intraepithelial neoplasias | ||
| LGIN: Low-grade intraepithelial neoplasias | ||
| Liver | 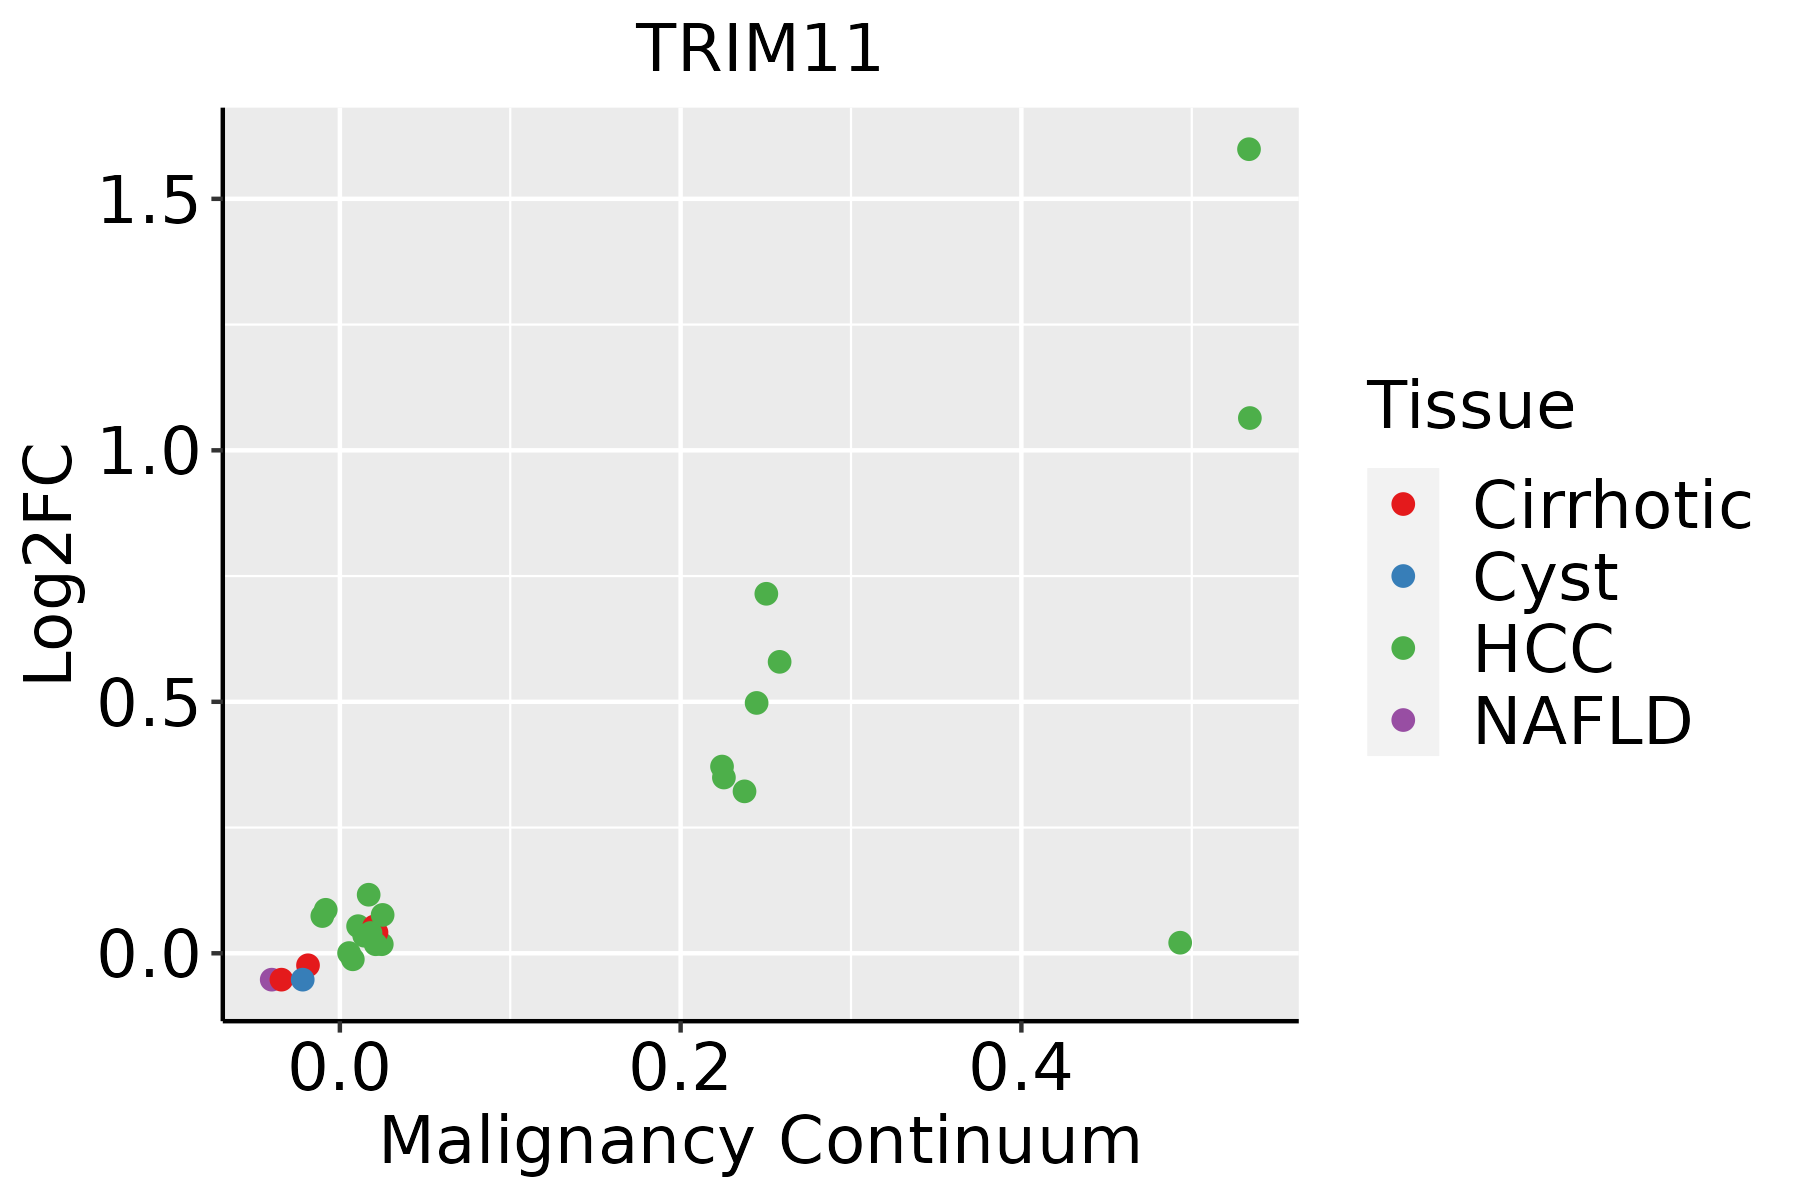 | HCC: Hepatocellular carcinoma |
| NAFLD: Non-alcoholic fatty liver disease | ||
| Oral Cavity |  | EOLP: Erosive Oral lichen planus |
| LP: leukoplakia | ||
| NEOLP: Non-erosive oral lichen planus | ||
| OSCC: Oral squamous cell carcinoma |
| ∗log2FC in expression of this searched gene in stem-like cells from each diseased tissue sample relative to stem-like cells in normal samples in each tissue plotted against the malignancy continuum. Samples are colored based on if they are from different disease stage. |
Top |
Malignant transformation related pathway analysis |
| Find out the enriched GO biological processes and KEGG pathways involved in transition from healthy to precancer to cancer |
| Tissue | Disease Stage | Enriched GO biological Processes |
| Colorectum | AD |  |
| Colorectum | SER |  |
| Colorectum | MSS |  |
| Colorectum | MSI-H |  |
| Colorectum | FAP |  |
| ∗Top 15 enriched GO BP terms are showed in the bar plot of each disease state in each tissue. Each row represents a significant GO biological process which is colored according to the -log10(p.adjust). |
| Page: 1 2 3 4 5 6 7 8 9 |
| GO ID | Tissue | Disease Stage | Description | Gene Ratio | Bg Ratio | pvalue | p.adjust | Count |
| GO:004671827 | Esophagus | ESCC | viral entry into host cell | 89/8552 | 144/18723 | 6.84e-05 | 5.18e-04 | 89 |
| GO:0043903111 | Esophagus | ESCC | regulation of biological process involved in symbiotic interaction | 49/8552 | 72/18723 | 1.03e-04 | 7.26e-04 | 49 |
| GO:00519606 | Esophagus | ESCC | regulation of nervous system development | 237/8552 | 443/18723 | 5.02e-04 | 2.78e-03 | 237 |
| GO:19021864 | Esophagus | ESCC | regulation of viral release from host cell | 20/8552 | 26/18723 | 1.19e-03 | 5.88e-03 | 20 |
| GO:004659816 | Esophagus | ESCC | positive regulation of viral entry into host cell | 10/8552 | 11/18723 | 2.54e-03 | 1.08e-02 | 10 |
| GO:007529416 | Esophagus | ESCC | positive regulation by symbiont of entry into host | 10/8552 | 11/18723 | 2.54e-03 | 1.08e-02 | 10 |
| GO:005237219 | Esophagus | ESCC | modulation by symbiont of entry into host | 32/8552 | 49/18723 | 4.39e-03 | 1.73e-02 | 32 |
| GO:00467822 | Esophagus | ESCC | regulation of viral transcription | 14/8552 | 19/18723 | 1.27e-02 | 4.21e-02 | 14 |
| GO:001603222 | Liver | HCC | viral process | 286/7958 | 415/18723 | 4.41e-28 | 1.86e-25 | 286 |
| GO:001905822 | Liver | HCC | viral life cycle | 209/7958 | 317/18723 | 2.05e-17 | 2.09e-15 | 209 |
| GO:001908021 | Liver | HCC | viral gene expression | 77/7958 | 94/18723 | 4.33e-15 | 3.12e-13 | 77 |
| GO:004440322 | Liver | HCC | biological process involved in symbiotic interaction | 183/7958 | 290/18723 | 9.13e-13 | 4.59e-11 | 183 |
| GO:005079212 | Liver | HCC | regulation of viral process | 109/7958 | 164/18723 | 4.52e-10 | 1.45e-08 | 109 |
| GO:004852411 | Liver | HCC | positive regulation of viral process | 52/7958 | 65/18723 | 6.70e-10 | 2.11e-08 | 52 |
| GO:005170122 | Liver | HCC | biological process involved in interaction with host | 128/7958 | 203/18723 | 2.51e-09 | 6.91e-08 | 128 |
| GO:000961511 | Liver | HCC | response to virus | 210/7958 | 367/18723 | 7.32e-09 | 1.86e-07 | 210 |
| GO:00190831 | Liver | HCC | viral transcription | 40/7958 | 50/18723 | 6.50e-08 | 1.35e-06 | 40 |
| GO:005212612 | Liver | HCC | movement in host environment | 109/7958 | 175/18723 | 9.58e-08 | 1.89e-06 | 109 |
| GO:190390012 | Liver | HCC | regulation of viral life cycle | 94/7958 | 148/18723 | 1.93e-07 | 3.49e-06 | 94 |
| GO:00516071 | Liver | HCC | defense response to virus | 151/7958 | 265/18723 | 1.27e-06 | 1.85e-05 | 151 |
| Page: 1 2 3 4 5 6 7 |
| Pathway ID | Tissue | Disease Stage | Description | Gene Ratio | Bg Ratio | pvalue | p.adjust | qvalue | Count |
| Page: 1 |
Top |
Cell-cell communication analysis |
| Identification of potential cell-cell interactions between two cell types and their ligand-receptor pairs for different disease states |
| Ligand | Receptor | LRpair | Pathway | Tissue | Disease Stage |
| Page: 1 |
Top |
Single-cell gene regulatory network inference analysis |
| Find out the significant the regulons (TFs) and the target genes of each regulon across cell types for different disease states |
| TF | Cell Type | Tissue | Disease Stage | Target Gene | RSS | Regulon Activity |
| ∗The dot plots of a searched regulon are shown for all cell subpopulations in each disease state of each tissue based on the regulon specific score inferred using pySCENIC and by calculating the average expression. |
| Page: 1 |
Top |
Somatic mutation of malignant transformation related genes |
| Annotation of somatic variants for genes involved in malignant transformation |
| Hugo Symbol | Variant Class | Variant Classification | dbSNP RS | HGVSc | HGVSp | HGVSp Short | SWISSPROT | BIOTYPE | SIFT | PolyPhen | Tumor Sample Barcode | Tissue | Histology | Sex | Age | Stage | Therapy Types | Drugs | Outcome |
| TRIM11 | SNV | Missense_Mutation | novel | c.1289C>T | p.Pro430Leu | p.P430L | Q96F44 | protein_coding | deleterious(0.03) | benign(0.1) | TCGA-A7-A26G-01 | Breast | breast invasive carcinoma | Female | <65 | I/II | Chemotherapy | taxotere | SD |
| TRIM11 | SNV | Missense_Mutation | rs759457960 | c.982N>A | p.Gly328Ser | p.G328S | Q96F44 | protein_coding | tolerated(0.69) | benign(0.007) | TCGA-D8-A141-01 | Breast | breast invasive carcinoma | Female | <65 | I/II | Chemotherapy | doxorubicine | SD |
| TRIM11 | SNV | Missense_Mutation | rs765073440 | c.1208G>A | p.Arg403His | p.R403H | Q96F44 | protein_coding | tolerated(0.48) | possibly_damaging(0.485) | TCGA-2W-A8YY-01 | Cervix | cervical & endocervical cancer | Female | <65 | I/II | Chemotherapy | cisplatin | CR |
| TRIM11 | SNV | Missense_Mutation | c.430G>C | p.Glu144Gln | p.E144Q | Q96F44 | protein_coding | tolerated(0.21) | benign(0.065) | TCGA-EK-A2RA-01 | Cervix | cervical & endocervical cancer | Female | >=65 | I/II | Unknown | Unknown | SD | |
| TRIM11 | SNV | Missense_Mutation | novel | c.1312N>A | p.Leu438Met | p.L438M | Q96F44 | protein_coding | deleterious(0) | probably_damaging(1) | TCGA-5M-AAT6-01 | Colorectum | colon adenocarcinoma | Female | <65 | III/IV | Unknown | Unknown | PD |
| TRIM11 | SNV | Missense_Mutation | c.812C>T | p.Thr271Ile | p.T271I | Q96F44 | protein_coding | deleterious(0.01) | possibly_damaging(0.459) | TCGA-AZ-4315-01 | Colorectum | colon adenocarcinoma | Male | <65 | I/II | Unknown | Unknown | SD | |
| TRIM11 | SNV | Missense_Mutation | rs766842071 | c.1231N>A | p.Glu411Lys | p.E411K | Q96F44 | protein_coding | deleterious(0) | possibly_damaging(0.546) | TCGA-A5-A0G2-01 | Endometrium | uterine corpus endometrioid carcinoma | Female | <65 | III/IV | Unknown | Unknown | SD |
| TRIM11 | SNV | Missense_Mutation | rs766187778 | c.1087N>A | p.Val363Met | p.V363M | Q96F44 | protein_coding | deleterious(0.03) | possibly_damaging(0.47) | TCGA-A5-A0G2-01 | Endometrium | uterine corpus endometrioid carcinoma | Female | <65 | III/IV | Unknown | Unknown | SD |
| TRIM11 | SNV | Missense_Mutation | rs766986706 | c.1315C>T | p.Arg439Trp | p.R439W | Q96F44 | protein_coding | tolerated(0.17) | probably_damaging(1) | TCGA-AP-A051-01 | Endometrium | uterine corpus endometrioid carcinoma | Female | >=65 | I/II | Unknown | Unknown | SD |
| TRIM11 | SNV | Missense_Mutation | rs751530642 | c.557G>A | p.Arg186His | p.R186H | Q96F44 | protein_coding | tolerated(0.8) | benign(0.007) | TCGA-AP-A051-01 | Endometrium | uterine corpus endometrioid carcinoma | Female | >=65 | I/II | Unknown | Unknown | SD |
| Page: 1 2 3 4 5 |
Top |
Related drugs of malignant transformation related genes |
| Identification of chemicals and drugs interact with genes involved in malignant transfromation |
| (DGIdb 4.0) |
| Entrez ID | Symbol | Category | Interaction Types | Drug Claim Name | Drug Name | PMIDs |
| Page: 1 |

Copyright 2023-Present -The University of Texas Health Science Center at Houston |