
|
|||||
|
 | |
| |
| |
| |
| |
| |
|
Gene: TRIAP1 |
Gene summary for TRIAP1 |
| Gene information | Species | Human | Gene symbol | TRIAP1 | Gene ID | 51499 |
| Gene name | TP53 regulated inhibitor of apoptosis 1 | |
| Gene Alias | HSPC132 | |
| Cytomap | 12q24.31 | |
| Gene Type | protein-coding | GO ID | GO:0000075 | UniProtAcc | O43715 |
Top |
Malignant transformation analysis |
| Identification of the aberrant gene expression in precancerous and cancerous lesions by comparing the gene expression of stem-like cells in diseased tissues with normal stem cells |
| Entrez ID | Symbol | Replicates | Species | Organ | Tissue | Adj P-value | Log2FC | Malignancy |
| 51499 | TRIAP1 | LZE4T | Human | Esophagus | ESCC | 7.44e-09 | 2.53e-01 | 0.0811 |
| 51499 | TRIAP1 | LZE7T | Human | Esophagus | ESCC | 5.02e-05 | 6.95e-01 | 0.0667 |
| 51499 | TRIAP1 | LZE8T | Human | Esophagus | ESCC | 4.80e-10 | 4.74e-01 | 0.067 |
| 51499 | TRIAP1 | LZE20T | Human | Esophagus | ESCC | 3.99e-02 | 4.79e-02 | 0.0662 |
| 51499 | TRIAP1 | LZE24T | Human | Esophagus | ESCC | 5.53e-10 | 3.34e-01 | 0.0596 |
| 51499 | TRIAP1 | LZE6T | Human | Esophagus | ESCC | 2.19e-06 | 4.02e-01 | 0.0845 |
| 51499 | TRIAP1 | P1T-E | Human | Esophagus | ESCC | 1.20e-03 | 4.28e-01 | 0.0875 |
| 51499 | TRIAP1 | P2T-E | Human | Esophagus | ESCC | 2.68e-67 | 1.35e+00 | 0.1177 |
| 51499 | TRIAP1 | P4T-E | Human | Esophagus | ESCC | 5.37e-21 | 7.26e-01 | 0.1323 |
| 51499 | TRIAP1 | P5T-E | Human | Esophagus | ESCC | 1.92e-17 | 2.89e-01 | 0.1327 |
| 51499 | TRIAP1 | P8T-E | Human | Esophagus | ESCC | 1.86e-28 | 6.16e-01 | 0.0889 |
| 51499 | TRIAP1 | P9T-E | Human | Esophagus | ESCC | 2.77e-09 | 1.93e-01 | 0.1131 |
| 51499 | TRIAP1 | P10T-E | Human | Esophagus | ESCC | 3.03e-38 | 5.22e-01 | 0.116 |
| 51499 | TRIAP1 | P11T-E | Human | Esophagus | ESCC | 4.89e-18 | 6.20e-01 | 0.1426 |
| 51499 | TRIAP1 | P12T-E | Human | Esophagus | ESCC | 8.97e-25 | 4.24e-01 | 0.1122 |
| 51499 | TRIAP1 | P15T-E | Human | Esophagus | ESCC | 4.94e-15 | 3.98e-01 | 0.1149 |
| 51499 | TRIAP1 | P16T-E | Human | Esophagus | ESCC | 5.77e-45 | 6.34e-01 | 0.1153 |
| 51499 | TRIAP1 | P17T-E | Human | Esophagus | ESCC | 2.01e-08 | 5.06e-01 | 0.1278 |
| 51499 | TRIAP1 | P19T-E | Human | Esophagus | ESCC | 2.52e-07 | 7.50e-01 | 0.1662 |
| 51499 | TRIAP1 | P20T-E | Human | Esophagus | ESCC | 8.67e-26 | 5.17e-01 | 0.1124 |
| Page: 1 2 3 4 5 6 |
| Tissue | Expression Dynamics | Abbreviation |
| Esophagus | 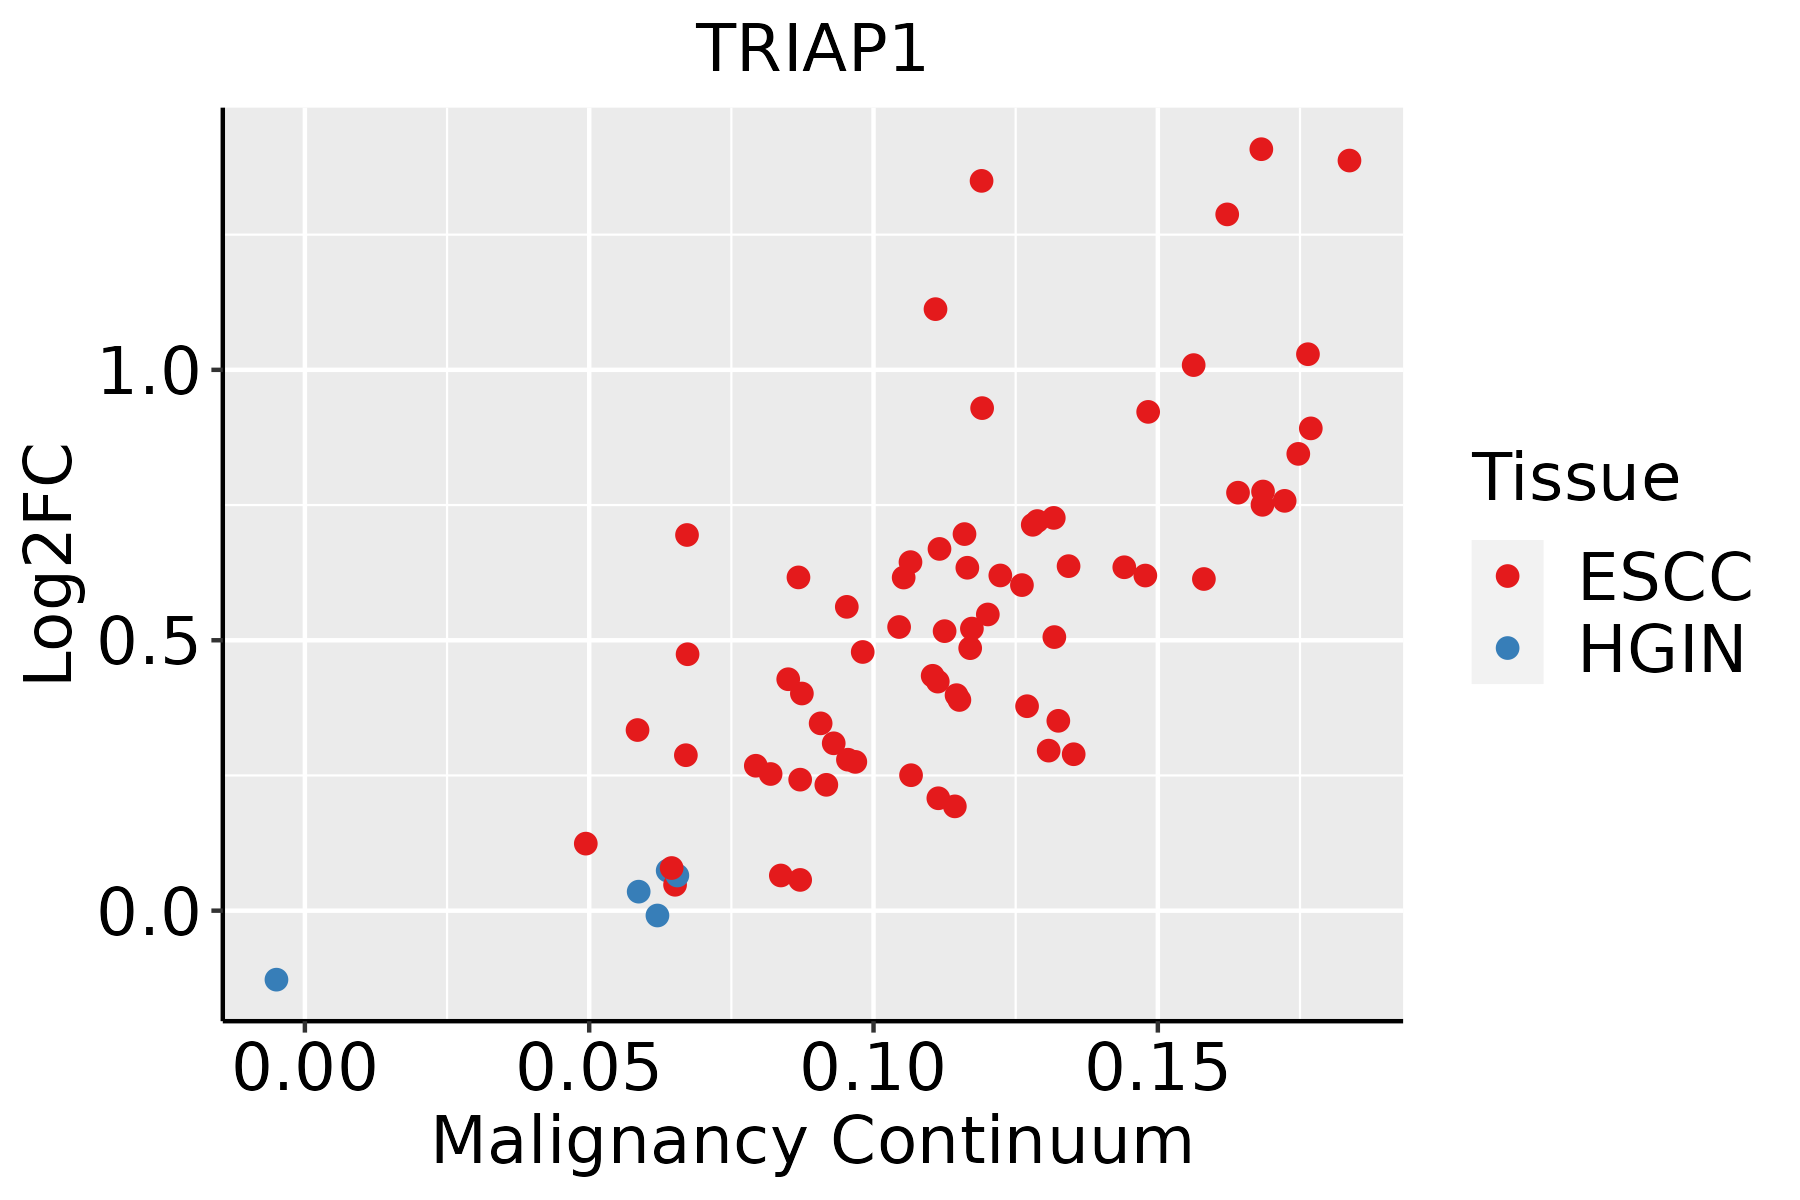 | ESCC: Esophageal squamous cell carcinoma |
| HGIN: High-grade intraepithelial neoplasias | ||
| LGIN: Low-grade intraepithelial neoplasias | ||
| Liver | 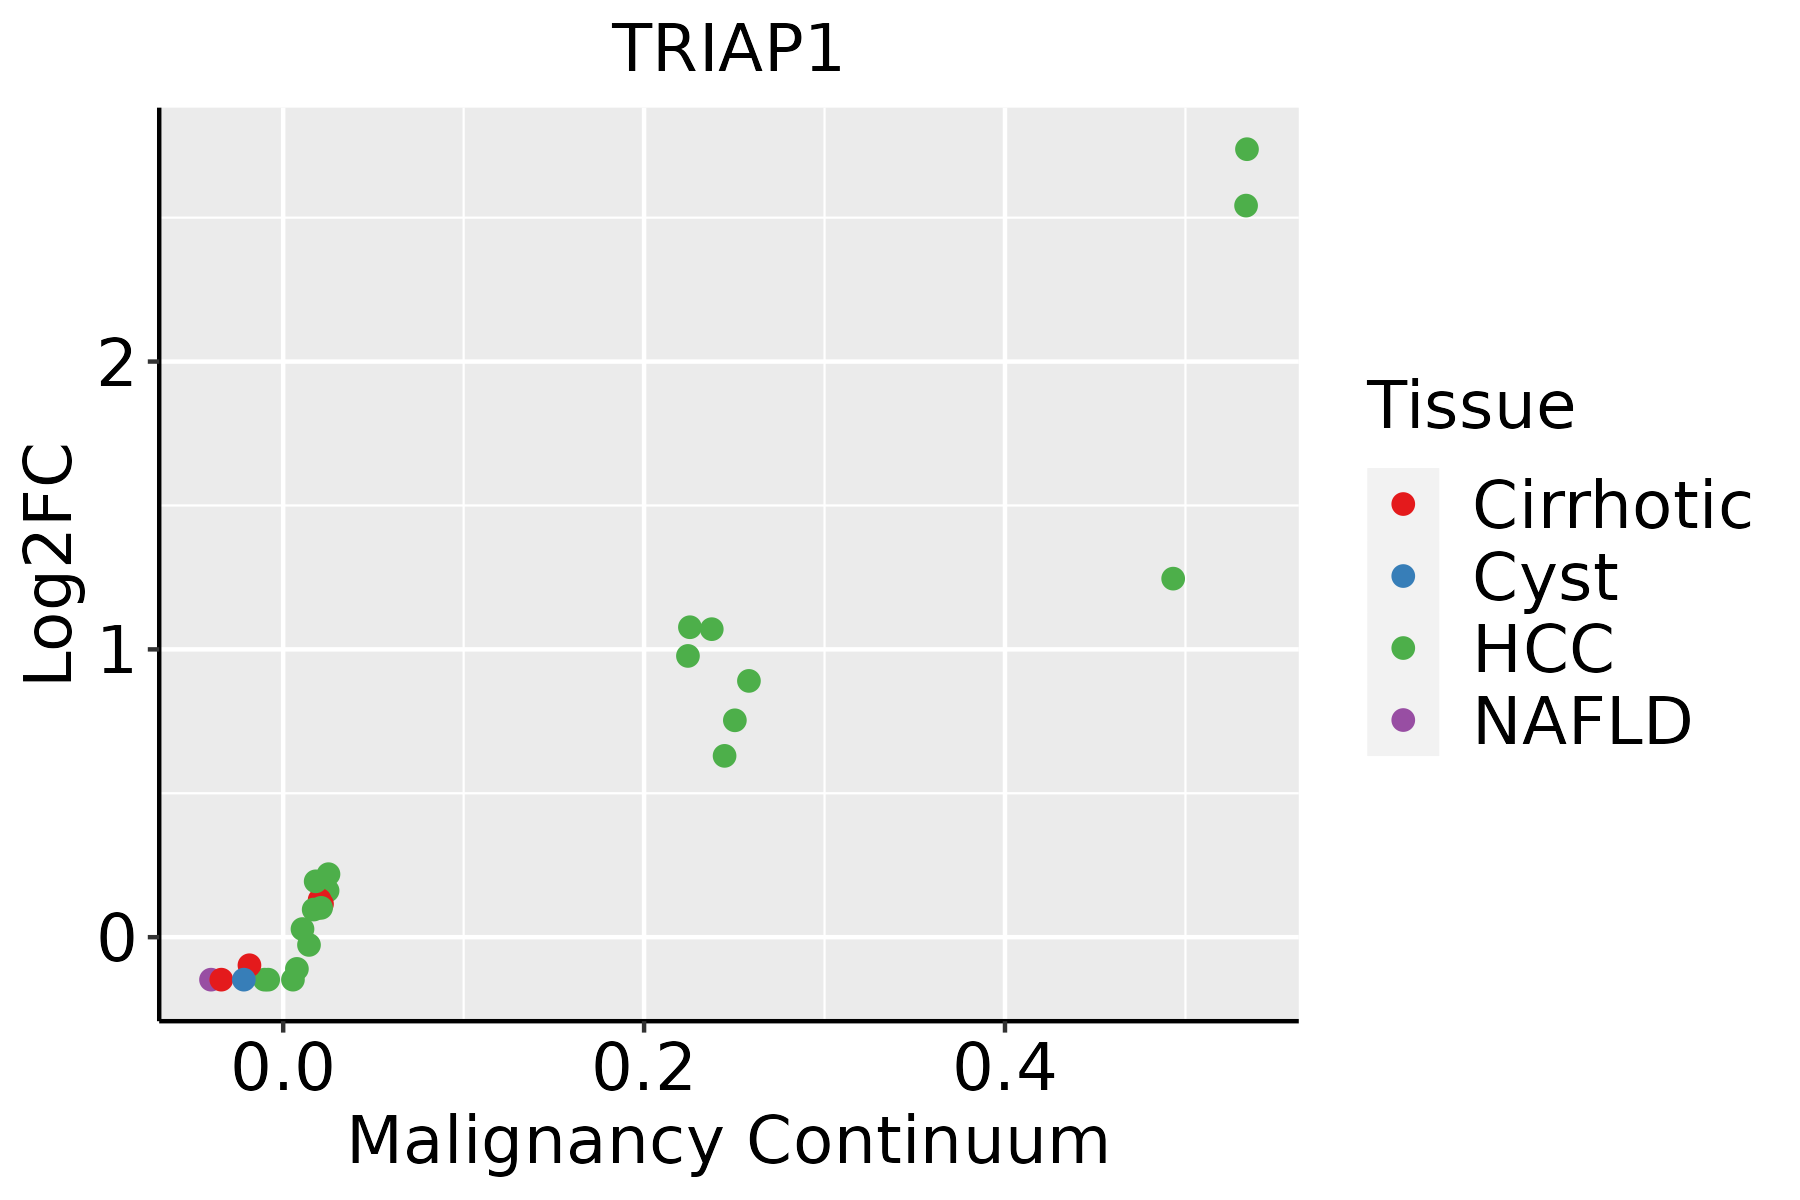 | HCC: Hepatocellular carcinoma |
| NAFLD: Non-alcoholic fatty liver disease | ||
| Oral Cavity |  | EOLP: Erosive Oral lichen planus |
| LP: leukoplakia | ||
| NEOLP: Non-erosive oral lichen planus | ||
| OSCC: Oral squamous cell carcinoma | ||
| Skin |  | AK: Actinic keratosis |
| cSCC: Cutaneous squamous cell carcinoma | ||
| SCCIS:squamous cell carcinoma in situ |
| ∗log2FC in expression of this searched gene in stem-like cells from each diseased tissue sample relative to stem-like cells in normal samples in each tissue plotted against the malignancy continuum. Samples are colored based on if they are from different disease stage. |
Top |
Malignant transformation related pathway analysis |
| Find out the enriched GO biological processes and KEGG pathways involved in transition from healthy to precancer to cancer |
| Tissue | Disease Stage | Enriched GO biological Processes |
| Colorectum | AD |  |
| Colorectum | SER |  |
| Colorectum | MSS |  |
| Colorectum | MSI-H |  |
| Colorectum | FAP |  |
| ∗Top 15 enriched GO BP terms are showed in the bar plot of each disease state in each tissue. Each row represents a significant GO biological process which is colored according to the -log10(p.adjust). |
| Page: 1 2 3 4 5 6 7 8 9 |
| GO ID | Tissue | Disease Stage | Description | Gene Ratio | Bg Ratio | pvalue | p.adjust | Count |
| GO:19019883 | Esophagus | ESCC | negative regulation of cell cycle phase transition | 151/8552 | 249/18723 | 1.28e-06 | 1.57e-05 | 151 |
| GO:0030330110 | Esophagus | ESCC | DNA damage response, signal transduction by p53 class mediator | 53/8552 | 72/18723 | 1.34e-06 | 1.63e-05 | 53 |
| GO:004593013 | Esophagus | ESCC | negative regulation of mitotic cell cycle | 143/8552 | 235/18723 | 1.84e-06 | 2.15e-05 | 143 |
| GO:009019914 | Esophagus | ESCC | regulation of release of cytochrome c from mitochondria | 38/8552 | 48/18723 | 2.11e-06 | 2.43e-05 | 38 |
| GO:190199113 | Esophagus | ESCC | negative regulation of mitotic cell cycle phase transition | 112/8552 | 179/18723 | 3.69e-06 | 4.03e-05 | 112 |
| GO:000941611 | Esophagus | ESCC | response to light stimulus | 183/8552 | 320/18723 | 2.03e-05 | 1.76e-04 | 183 |
| GO:001082315 | Esophagus | ESCC | negative regulation of mitochondrion organization | 36/8552 | 49/18723 | 7.24e-05 | 5.45e-04 | 36 |
| GO:19022298 | Esophagus | ESCC | regulation of intrinsic apoptotic signaling pathway in response to DNA damage | 28/8552 | 36/18723 | 8.62e-05 | 6.22e-04 | 28 |
| GO:004477312 | Esophagus | ESCC | mitotic DNA damage checkpoint | 54/8552 | 81/18723 | 1.09e-04 | 7.64e-04 | 54 |
| GO:200102112 | Esophagus | ESCC | negative regulation of response to DNA damage stimulus | 54/8552 | 81/18723 | 1.09e-04 | 7.64e-04 | 54 |
| GO:0045861111 | Esophagus | ESCC | negative regulation of proteolysis | 195/8552 | 351/18723 | 1.13e-04 | 7.85e-04 | 195 |
| GO:003157116 | Esophagus | ESCC | mitotic G1 DNA damage checkpoint | 24/8552 | 30/18723 | 1.27e-04 | 8.67e-04 | 24 |
| GO:00447745 | Esophagus | ESCC | mitotic DNA integrity checkpoint | 56/8552 | 85/18723 | 1.34e-04 | 9.09e-04 | 56 |
| GO:0051346110 | Esophagus | ESCC | negative regulation of hydrolase activity | 208/8552 | 379/18723 | 1.76e-04 | 1.14e-03 | 208 |
| GO:19022304 | Esophagus | ESCC | negative regulation of intrinsic apoptotic signaling pathway in response to DNA damage | 23/8552 | 29/18723 | 2.25e-04 | 1.40e-03 | 23 |
| GO:1902253110 | Esophagus | ESCC | regulation of intrinsic apoptotic signaling pathway by p53 class mediator | 23/8552 | 29/18723 | 2.25e-04 | 1.40e-03 | 23 |
| GO:004481915 | Esophagus | ESCC | mitotic G1/S transition checkpoint | 24/8552 | 31/18723 | 3.19e-04 | 1.89e-03 | 24 |
| GO:00714821 | Esophagus | ESCC | cellular response to light stimulus | 75/8552 | 123/18723 | 4.45e-04 | 2.50e-03 | 75 |
| GO:009020112 | Esophagus | ESCC | negative regulation of release of cytochrome c from mitochondria | 16/8552 | 20/18723 | 1.85e-03 | 8.40e-03 | 16 |
| GO:200004513 | Esophagus | ESCC | regulation of G1/S transition of mitotic cell cycle | 82/8552 | 142/18723 | 2.49e-03 | 1.08e-02 | 82 |
| Page: 1 2 3 4 5 6 7 8 9 10 11 12 13 14 15 16 17 18 19 |
| Pathway ID | Tissue | Disease Stage | Description | Gene Ratio | Bg Ratio | pvalue | p.adjust | qvalue | Count |
| Page: 1 |
Top |
Cell-cell communication analysis |
| Identification of potential cell-cell interactions between two cell types and their ligand-receptor pairs for different disease states |
| Ligand | Receptor | LRpair | Pathway | Tissue | Disease Stage |
| Page: 1 |
Top |
Single-cell gene regulatory network inference analysis |
| Find out the significant the regulons (TFs) and the target genes of each regulon across cell types for different disease states |
| TF | Cell Type | Tissue | Disease Stage | Target Gene | RSS | Regulon Activity |
| ∗The dot plots of a searched regulon are shown for all cell subpopulations in each disease state of each tissue based on the regulon specific score inferred using pySCENIC and by calculating the average expression. |
| Page: 1 |
Top |
Somatic mutation of malignant transformation related genes |
| Annotation of somatic variants for genes involved in malignant transformation |
| Hugo Symbol | Variant Class | Variant Classification | dbSNP RS | HGVSc | HGVSp | HGVSp Short | SWISSPROT | BIOTYPE | SIFT | PolyPhen | Tumor Sample Barcode | Tissue | Histology | Sex | Age | Stage | Therapy Types | Drugs | Outcome |
| TRIAP1 | insertion | Nonsense_Mutation | novel | c.25_26insAAGGAGAAAGAGATTCCTATTGAAGG | p.Thr9LysfsTer8 | p.T9Kfs*8 | O43715 | protein_coding | TCGA-BH-A0HO-01 | Breast | breast invasive carcinoma | Female | <65 | I/II | Chemotherapy | cyclophosphamide | SD | ||
| TRIAP1 | SNV | Missense_Mutation | c.25A>G | p.Thr9Ala | p.T9A | O43715 | protein_coding | deleterious(0.01) | probably_damaging(0.936) | TCGA-CM-5861-01 | Colorectum | colon adenocarcinoma | Female | <65 | I/II | Unknown | Unknown | PD | |
| TRIAP1 | insertion | In_Frame_Ins | novel | c.40_41insTAA | p.Glu14delinsValLys | p.E14delinsVK | O43715 | protein_coding | TCGA-AM-5820-01 | Colorectum | colon adenocarcinoma | Female | <65 | I/II | Unknown | Unknown | SD | ||
| TRIAP1 | SNV | Missense_Mutation | novel | c.224C>A | p.Ser75Tyr | p.S75Y | O43715 | protein_coding | deleterious(0) | probably_damaging(0.962) | TCGA-EO-A3B0-01 | Endometrium | uterine corpus endometrioid carcinoma | Female | <65 | III/IV | Unknown | Unknown | SD |
| TRIAP1 | SNV | Missense_Mutation | novel | c.61C>T | p.Arg21Cys | p.R21C | O43715 | protein_coding | tolerated(0.19) | benign(0.019) | TCGA-FI-A2D0-01 | Endometrium | uterine corpus endometrioid carcinoma | Female | <65 | I/II | Unknown | Unknown | SD |
| TRIAP1 | SNV | Missense_Mutation | c.53N>C | p.Cys18Ser | p.C18S | O43715 | protein_coding | deleterious(0) | probably_damaging(0.999) | TCGA-53-7624-01 | Lung | lung adenocarcinoma | Female | <65 | III/IV | Chemotherapy | cisplatin | PD | |
| TRIAP1 | SNV | Missense_Mutation | novel | c.58N>C | p.Asn20His | p.N20H | O43715 | protein_coding | deleterious(0.05) | probably_damaging(0.947) | TCGA-66-2769-01 | Lung | lung squamous cell carcinoma | Male | >=65 | III/IV | Unknown | Unknown | SD |
| TRIAP1 | SNV | Missense_Mutation | novel | c.178N>A | p.Glu60Lys | p.E60K | O43715 | protein_coding | tolerated(0.42) | benign(0.197) | TCGA-CQ-7071-01 | Oral cavity | head & neck squamous cell carcinoma | Female | >=65 | III/IV | Unknown | Unknown | SD |
| TRIAP1 | SNV | Missense_Mutation | c.154N>G | p.Ile52Val | p.I52V | O43715 | protein_coding | tolerated(0.16) | benign(0.197) | TCGA-HU-8243-01 | Stomach | stomach adenocarcinoma | Male | >=65 | III/IV | Chemotherapy | 5-fluorouracil | PD |
| Page: 1 |
Top |
Related drugs of malignant transformation related genes |
| Identification of chemicals and drugs interact with genes involved in malignant transfromation |
| (DGIdb 4.0) |
| Entrez ID | Symbol | Category | Interaction Types | Drug Claim Name | Drug Name | PMIDs |
| Page: 1 |

Copyright 2023-Present -The University of Texas Health Science Center at Houston |