
|
|||||
|
 | |
| |
| |
| |
| |
| |
|
Gene: TRAF3IP1 |
Gene summary for TRAF3IP1 |
| Gene information | Species | Human | Gene symbol | TRAF3IP1 | Gene ID | 26146 |
| Gene name | TRAF3 interacting protein 1 | |
| Gene Alias | FAP116 | |
| Cytomap | 2q37.3 | |
| Gene Type | protein-coding | GO ID | GO:0000226 | UniProtAcc | Q8TDR0 |
Top |
Malignant transformation analysis |
| Identification of the aberrant gene expression in precancerous and cancerous lesions by comparing the gene expression of stem-like cells in diseased tissues with normal stem cells |
| Entrez ID | Symbol | Replicates | Species | Organ | Tissue | Adj P-value | Log2FC | Malignancy |
| 26146 | TRAF3IP1 | LZE8T | Human | Esophagus | ESCC | 2.72e-03 | 9.89e-02 | 0.067 |
| 26146 | TRAF3IP1 | LZE24T | Human | Esophagus | ESCC | 3.17e-06 | 1.92e-01 | 0.0596 |
| 26146 | TRAF3IP1 | LZE21T | Human | Esophagus | ESCC | 6.52e-03 | 1.72e-01 | 0.0655 |
| 26146 | TRAF3IP1 | P1T-E | Human | Esophagus | ESCC | 1.64e-05 | 1.88e-01 | 0.0875 |
| 26146 | TRAF3IP1 | P2T-E | Human | Esophagus | ESCC | 2.05e-09 | 1.94e-01 | 0.1177 |
| 26146 | TRAF3IP1 | P4T-E | Human | Esophagus | ESCC | 6.27e-06 | 1.29e-01 | 0.1323 |
| 26146 | TRAF3IP1 | P5T-E | Human | Esophagus | ESCC | 8.96e-04 | 5.62e-02 | 0.1327 |
| 26146 | TRAF3IP1 | P8T-E | Human | Esophagus | ESCC | 3.77e-07 | 1.62e-01 | 0.0889 |
| 26146 | TRAF3IP1 | P10T-E | Human | Esophagus | ESCC | 2.00e-09 | 1.15e-01 | 0.116 |
| 26146 | TRAF3IP1 | P12T-E | Human | Esophagus | ESCC | 6.12e-07 | 1.58e-01 | 0.1122 |
| 26146 | TRAF3IP1 | P15T-E | Human | Esophagus | ESCC | 2.22e-12 | 2.18e-01 | 0.1149 |
| 26146 | TRAF3IP1 | P16T-E | Human | Esophagus | ESCC | 1.00e-06 | 1.24e-01 | 0.1153 |
| 26146 | TRAF3IP1 | P20T-E | Human | Esophagus | ESCC | 1.04e-10 | 1.86e-01 | 0.1124 |
| 26146 | TRAF3IP1 | P21T-E | Human | Esophagus | ESCC | 6.41e-08 | 1.85e-01 | 0.1617 |
| 26146 | TRAF3IP1 | P22T-E | Human | Esophagus | ESCC | 2.30e-06 | 1.56e-01 | 0.1236 |
| 26146 | TRAF3IP1 | P23T-E | Human | Esophagus | ESCC | 1.83e-07 | 1.66e-01 | 0.108 |
| 26146 | TRAF3IP1 | P24T-E | Human | Esophagus | ESCC | 1.10e-04 | 1.42e-01 | 0.1287 |
| 26146 | TRAF3IP1 | P26T-E | Human | Esophagus | ESCC | 1.28e-05 | 9.12e-02 | 0.1276 |
| 26146 | TRAF3IP1 | P27T-E | Human | Esophagus | ESCC | 1.40e-05 | 1.36e-01 | 0.1055 |
| 26146 | TRAF3IP1 | P28T-E | Human | Esophagus | ESCC | 1.45e-20 | 4.65e-01 | 0.1149 |
| Page: 1 2 3 4 |
| Tissue | Expression Dynamics | Abbreviation |
| Esophagus | 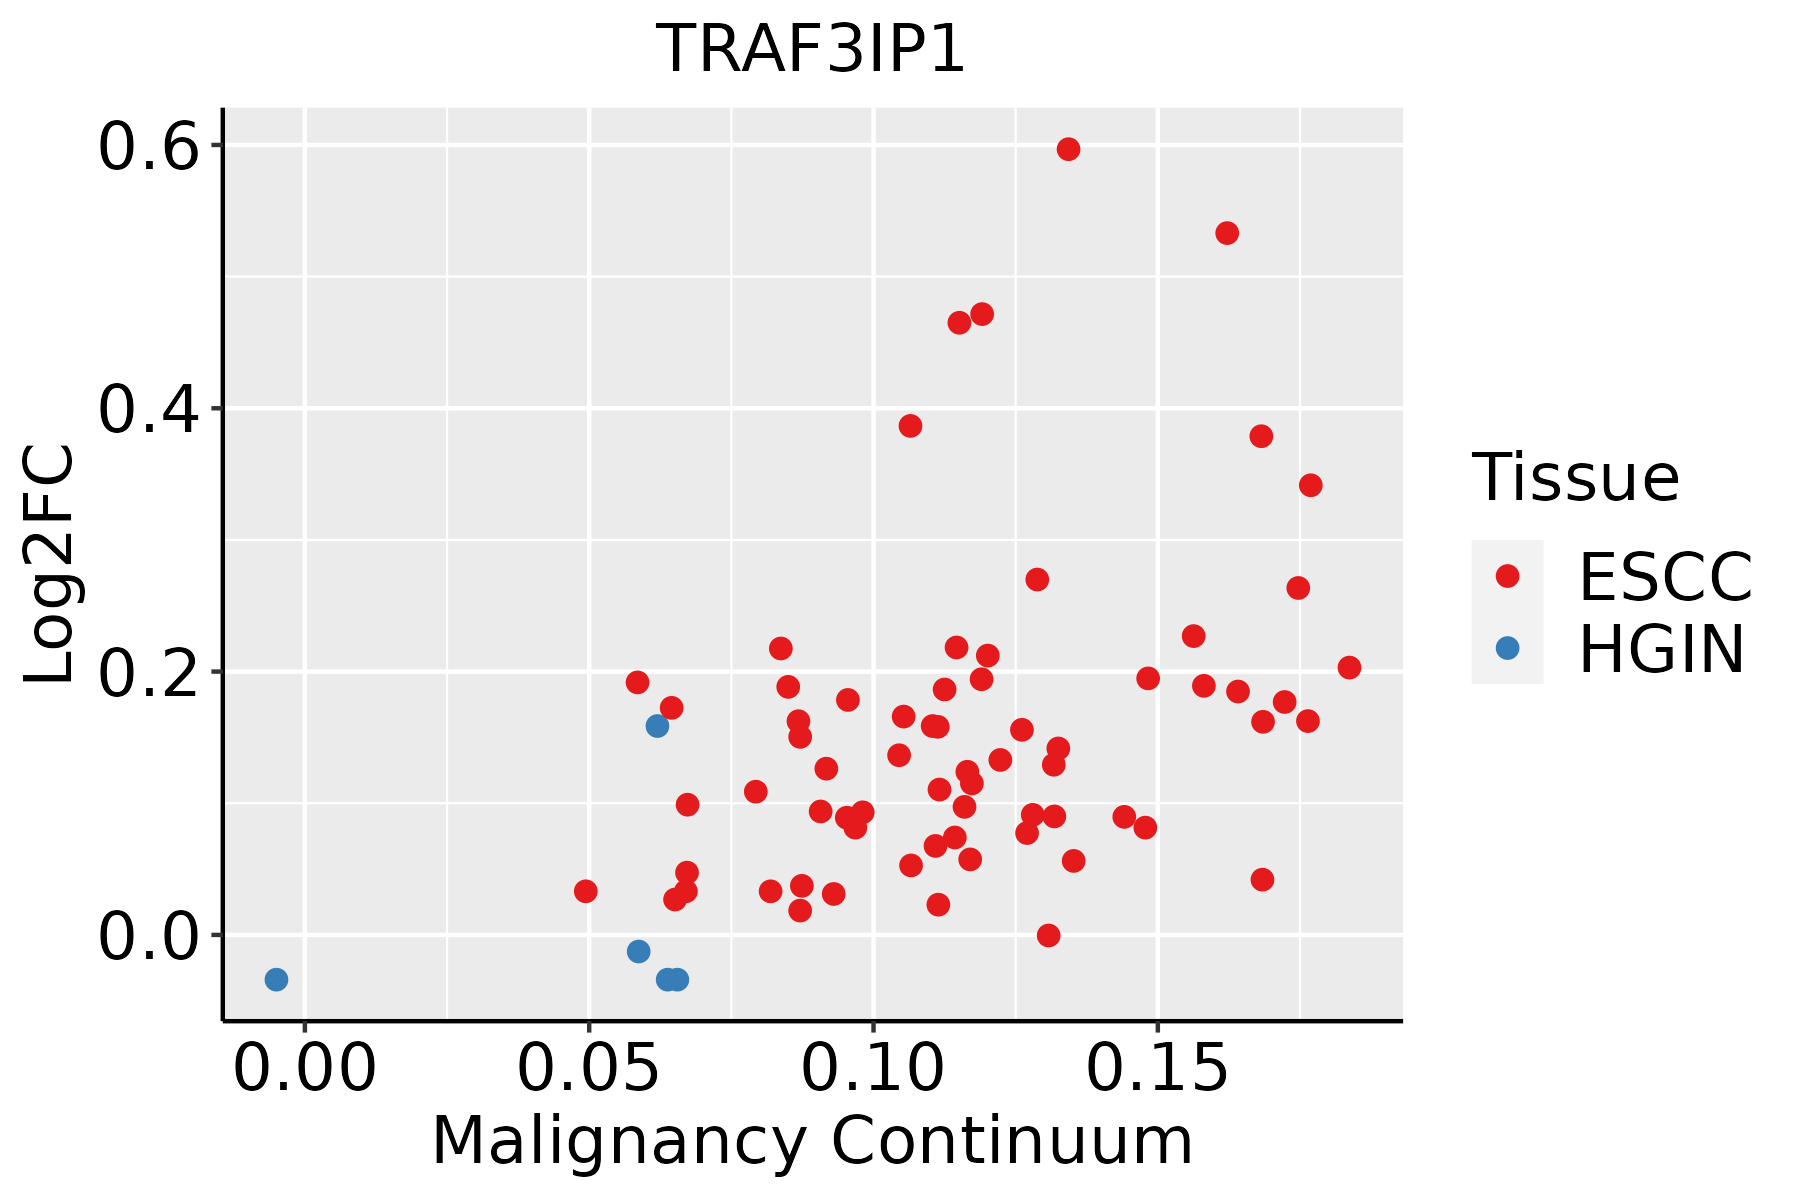 | ESCC: Esophageal squamous cell carcinoma |
| HGIN: High-grade intraepithelial neoplasias | ||
| LGIN: Low-grade intraepithelial neoplasias | ||
| Liver | 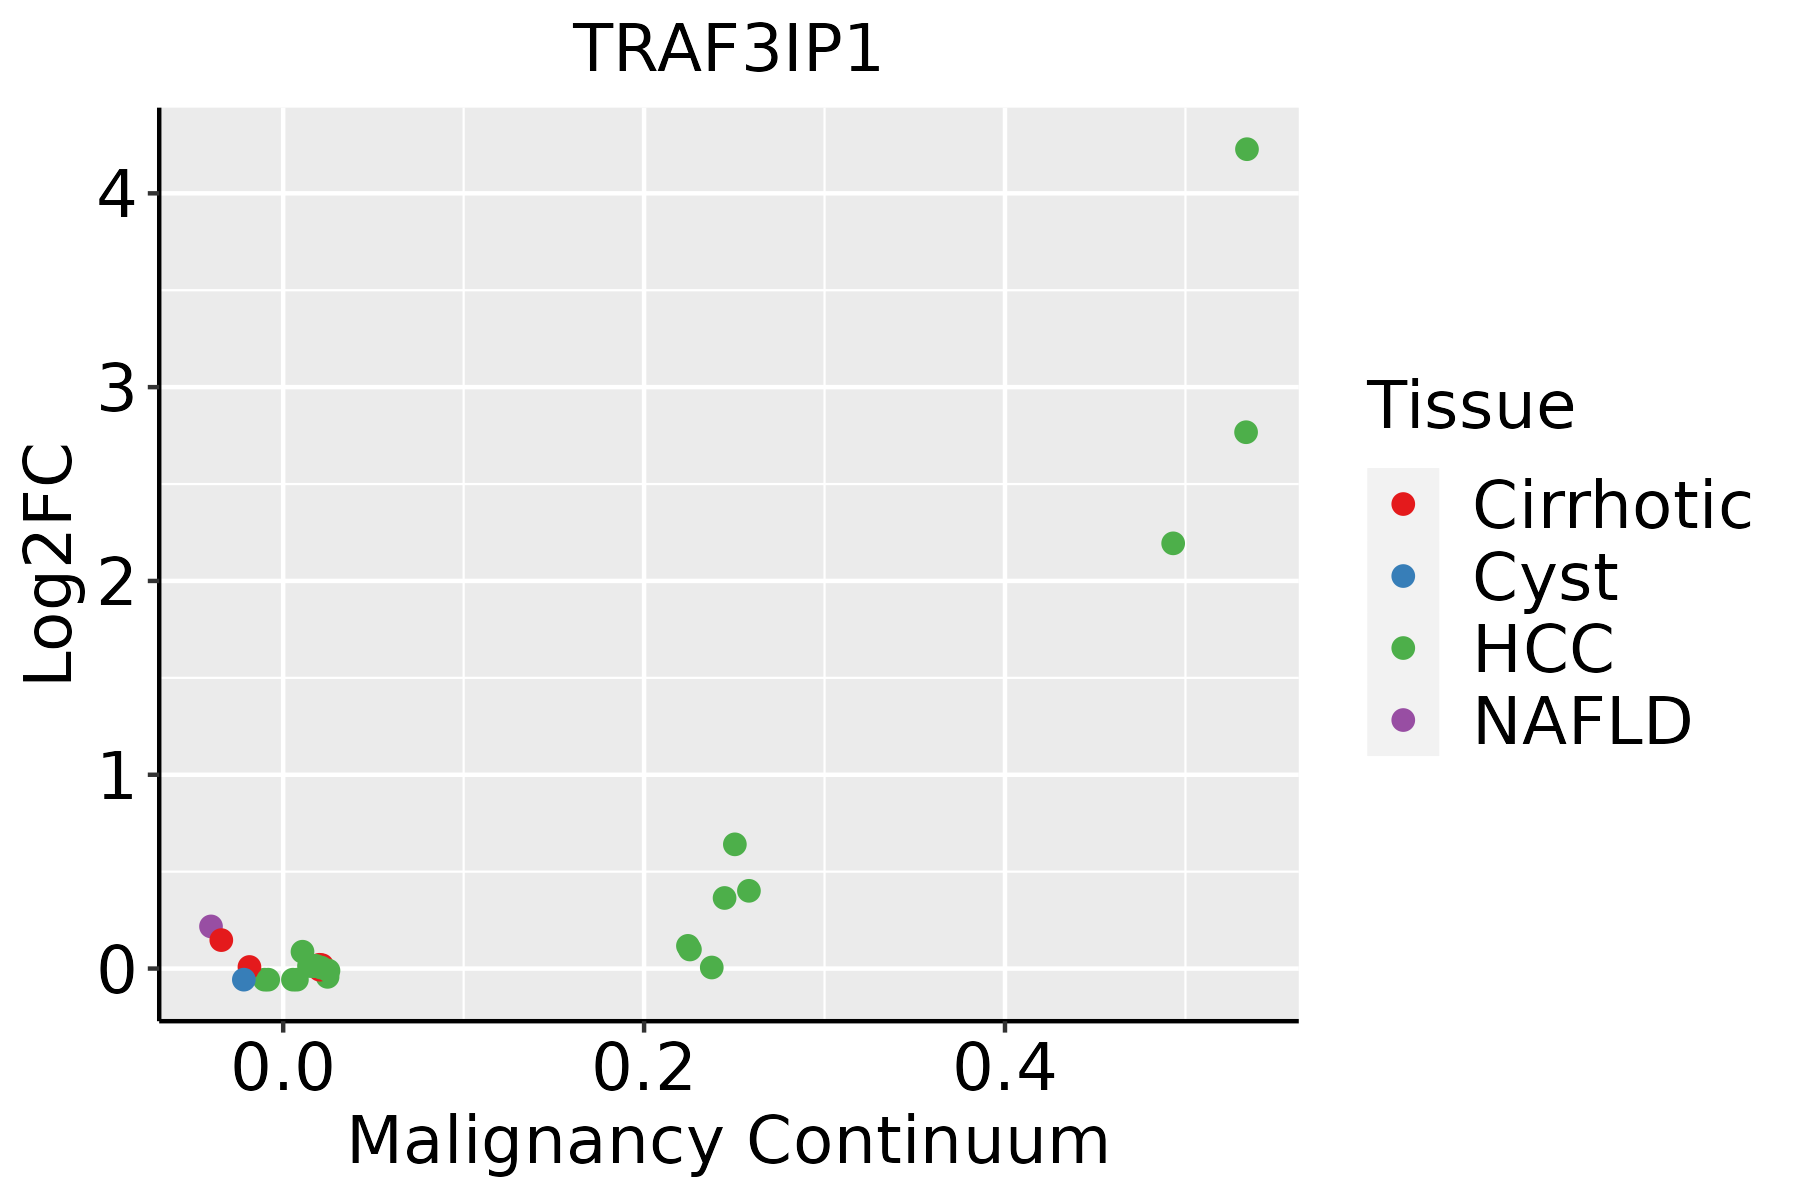 | HCC: Hepatocellular carcinoma |
| NAFLD: Non-alcoholic fatty liver disease | ||
| Oral Cavity | 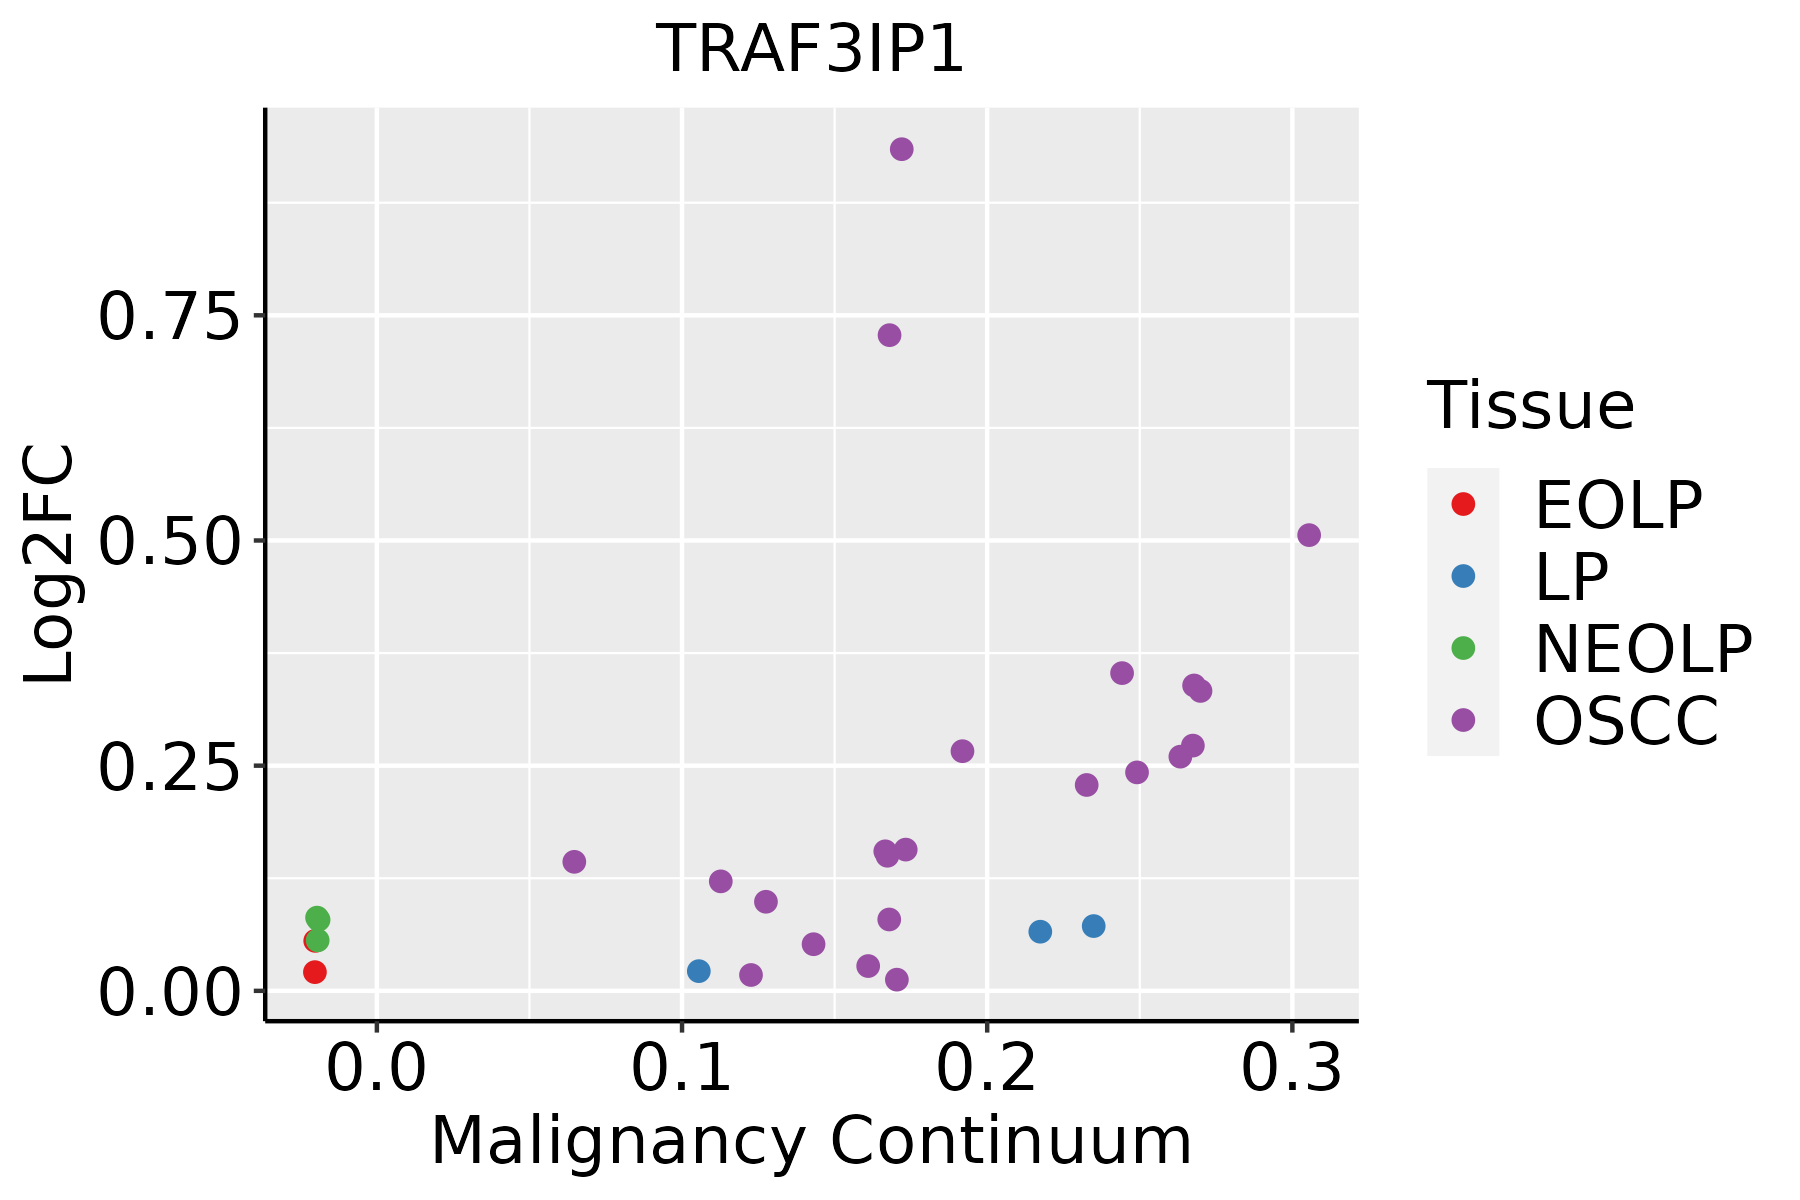 | EOLP: Erosive Oral lichen planus |
| LP: leukoplakia | ||
| NEOLP: Non-erosive oral lichen planus | ||
| OSCC: Oral squamous cell carcinoma | ||
| Thyroid |  | ATC: Anaplastic thyroid cancer |
| HT: Hashimoto's thyroiditis | ||
| PTC: Papillary thyroid cancer |
| ∗log2FC in expression of this searched gene in stem-like cells from each diseased tissue sample relative to stem-like cells in normal samples in each tissue plotted against the malignancy continuum. Samples are colored based on if they are from different disease stage. |
Top |
Malignant transformation related pathway analysis |
| Find out the enriched GO biological processes and KEGG pathways involved in transition from healthy to precancer to cancer |
| Tissue | Disease Stage | Enriched GO biological Processes |
| Colorectum | AD |  |
| Colorectum | SER |  |
| Colorectum | MSS |  |
| Colorectum | MSI-H |  |
| Colorectum | FAP |  |
| ∗Top 15 enriched GO BP terms are showed in the bar plot of each disease state in each tissue. Each row represents a significant GO biological process which is colored according to the -log10(p.adjust). |
| Page: 1 2 3 4 5 6 7 8 9 |
| GO ID | Tissue | Disease Stage | Description | Gene Ratio | Bg Ratio | pvalue | p.adjust | Count |
| GO:00028321 | Liver | HCC | negative regulation of response to biotic stimulus | 66/7958 | 108/18723 | 7.24e-05 | 6.50e-04 | 66 |
| GO:00028312 | Liver | HCC | regulation of response to biotic stimulus | 173/7958 | 327/18723 | 8.55e-05 | 7.48e-04 | 173 |
| GO:0050687 | Liver | HCC | negative regulation of defense response to virus | 18/7958 | 24/18723 | 1.27e-03 | 6.92e-03 | 18 |
| GO:00016553 | Liver | HCC | urogenital system development | 170/7958 | 338/18723 | 2.15e-03 | 1.08e-02 | 170 |
| GO:00018222 | Liver | HCC | kidney development | 148/7958 | 293/18723 | 3.25e-03 | 1.49e-02 | 148 |
| GO:0050688 | Liver | HCC | regulation of defense response to virus | 41/7958 | 69/18723 | 3.38e-03 | 1.54e-02 | 41 |
| GO:00720012 | Liver | HCC | renal system development | 152/7958 | 302/18723 | 3.45e-03 | 1.56e-02 | 152 |
| GO:0032886 | Liver | HCC | regulation of microtubule-based process | 123/7958 | 240/18723 | 3.69e-03 | 1.64e-02 | 123 |
| GO:0050777 | Liver | HCC | negative regulation of immune response | 101/7958 | 194/18723 | 4.40e-03 | 1.90e-02 | 101 |
| GO:004325420 | Oral cavity | OSCC | regulation of protein-containing complex assembly | 255/7305 | 428/18723 | 2.94e-18 | 3.15e-16 | 255 |
| GO:000961515 | Oral cavity | OSCC | response to virus | 215/7305 | 367/18723 | 1.63e-14 | 9.41e-13 | 215 |
| GO:001056320 | Oral cavity | OSCC | negative regulation of phosphorus metabolic process | 246/7305 | 442/18723 | 6.12e-13 | 2.89e-11 | 246 |
| GO:004593620 | Oral cavity | OSCC | negative regulation of phosphate metabolic process | 245/7305 | 441/18723 | 8.85e-13 | 4.09e-11 | 245 |
| GO:004232619 | Oral cavity | OSCC | negative regulation of phosphorylation | 214/7305 | 385/18723 | 2.30e-11 | 7.74e-10 | 214 |
| GO:000193319 | Oral cavity | OSCC | negative regulation of protein phosphorylation | 191/7305 | 342/18723 | 1.58e-10 | 4.62e-09 | 191 |
| GO:00516074 | Oral cavity | OSCC | defense response to virus | 154/7305 | 265/18723 | 1.96e-10 | 5.63e-09 | 154 |
| GO:01405464 | Oral cavity | OSCC | defense response to symbiont | 154/7305 | 265/18723 | 1.96e-10 | 5.63e-09 | 154 |
| GO:00028317 | Oral cavity | OSCC | regulation of response to biotic stimulus | 177/7305 | 327/18723 | 1.73e-08 | 3.43e-07 | 177 |
| GO:003070510 | Oral cavity | OSCC | cytoskeleton-dependent intracellular transport | 113/7305 | 195/18723 | 6.03e-08 | 1.09e-06 | 113 |
| GO:00315034 | Oral cavity | OSCC | protein-containing complex localization | 123/7305 | 220/18723 | 2.54e-07 | 4.00e-06 | 123 |
| Page: 1 2 3 4 5 6 |
| Pathway ID | Tissue | Disease Stage | Description | Gene Ratio | Bg Ratio | pvalue | p.adjust | qvalue | Count |
| Page: 1 |
Top |
Cell-cell communication analysis |
| Identification of potential cell-cell interactions between two cell types and their ligand-receptor pairs for different disease states |
| Ligand | Receptor | LRpair | Pathway | Tissue | Disease Stage |
| Page: 1 |
Top |
Single-cell gene regulatory network inference analysis |
| Find out the significant the regulons (TFs) and the target genes of each regulon across cell types for different disease states |
| TF | Cell Type | Tissue | Disease Stage | Target Gene | RSS | Regulon Activity |
| ∗The dot plots of a searched regulon are shown for all cell subpopulations in each disease state of each tissue based on the regulon specific score inferred using pySCENIC and by calculating the average expression. |
| Page: 1 |
Top |
Somatic mutation of malignant transformation related genes |
| Annotation of somatic variants for genes involved in malignant transformation |
| Hugo Symbol | Variant Class | Variant Classification | dbSNP RS | HGVSc | HGVSp | HGVSp Short | SWISSPROT | BIOTYPE | SIFT | PolyPhen | Tumor Sample Barcode | Tissue | Histology | Sex | Age | Stage | Therapy Types | Drugs | Outcome |
| TRAF3IP1 | SNV | Missense_Mutation | rs750512823 | c.1684N>A | p.Glu562Lys | p.E562K | Q8TDR0 | protein_coding | deleterious(0.05) | possibly_damaging(0.872) | TCGA-A1-A0SK-01 | Breast | breast invasive carcinoma | Female | <65 | I/II | Unknown | Unknown | PD |
| TRAF3IP1 | SNV | Missense_Mutation | rs375052092 | c.2066N>T | p.Ser689Leu | p.S689L | Q8TDR0 | protein_coding | deleterious(0) | probably_damaging(0.99) | TCGA-AN-A046-01 | Breast | breast invasive carcinoma | Female | >=65 | I/II | Unknown | Unknown | SD |
| TRAF3IP1 | SNV | Missense_Mutation | c.144N>A | p.Phe48Leu | p.F48L | Q8TDR0 | protein_coding | deleterious(0) | probably_damaging(0.986) | TCGA-EW-A1OZ-01 | Breast | breast invasive carcinoma | Female | <65 | I/II | Targeted Molecular therapy | trastuzumab | SD | |
| TRAF3IP1 | SNV | Missense_Mutation | novel | c.628A>C | p.Asn210His | p.N210H | Q8TDR0 | protein_coding | deleterious(0.04) | benign(0.203) | TCGA-PE-A5DC-01 | Breast | breast invasive carcinoma | Female | >=65 | III/IV | Unknown | Unknown | SD |
| TRAF3IP1 | deletion | Frame_Shift_Del | c.762delN | p.Glu258ArgfsTer5 | p.E258Rfs*5 | Q8TDR0 | protein_coding | TCGA-A8-A09Z-01 | Breast | breast invasive carcinoma | Female | >=65 | I/II | Unknown | Unknown | SD | |||
| TRAF3IP1 | SNV | Missense_Mutation | c.1795C>T | p.Pro599Ser | p.P599S | Q8TDR0 | protein_coding | deleterious(0.05) | probably_damaging(0.993) | TCGA-EK-A2R8-01 | Cervix | cervical & endocervical cancer | Female | <65 | I/II | Unknown | Unknown | SD | |
| TRAF3IP1 | SNV | Missense_Mutation | c.171G>T | p.Glu57Asp | p.E57D | Q8TDR0 | protein_coding | deleterious(0) | probably_damaging(0.99) | TCGA-AA-A00N-01 | Colorectum | colon adenocarcinoma | Male | >=65 | I/II | Unknown | Unknown | PD | |
| TRAF3IP1 | SNV | Missense_Mutation | novel | c.316N>A | p.Glu106Lys | p.E106K | Q8TDR0 | protein_coding | deleterious(0) | probably_damaging(0.999) | TCGA-CA-6717-01 | Colorectum | colon adenocarcinoma | Male | <65 | I/II | Chemotherapy | oxaliplatin | CR |
| TRAF3IP1 | SNV | Missense_Mutation | rs766887017 | c.1142N>T | p.Thr381Met | p.T381M | Q8TDR0 | protein_coding | tolerated(0.05) | probably_damaging(0.96) | TCGA-G4-6322-01 | Colorectum | colon adenocarcinoma | Male | >=65 | III/IV | Chemotherapy | oxaliplatin | PD |
| TRAF3IP1 | SNV | Missense_Mutation | c.1352N>G | p.Leu451Arg | p.L451R | Q8TDR0 | protein_coding | deleterious(0.03) | probably_damaging(0.943) | TCGA-WS-AB45-01 | Colorectum | colon adenocarcinoma | Female | <65 | I/II | Unknown | Unknown | SD |
| Page: 1 2 3 4 5 6 7 |
Top |
Related drugs of malignant transformation related genes |
| Identification of chemicals and drugs interact with genes involved in malignant transfromation |
| (DGIdb 4.0) |
| Entrez ID | Symbol | Category | Interaction Types | Drug Claim Name | Drug Name | PMIDs |
| Page: 1 |

Copyright 2023-Present -The University of Texas Health Science Center at Houston |