
|
|||||
|
 | |
| |
| |
| |
| |
| |
|
Gene: TNFRSF1B |
Gene summary for TNFRSF1B |
| Gene information | Species | Human | Gene symbol | TNFRSF1B | Gene ID | 7133 |
| Gene name | TNF receptor superfamily member 1B | |
| Gene Alias | CD120b | |
| Cytomap | 1p36.22 | |
| Gene Type | protein-coding | GO ID | GO:0001775 | UniProtAcc | P20333 |
Top |
Malignant transformation analysis |
| Identification of the aberrant gene expression in precancerous and cancerous lesions by comparing the gene expression of stem-like cells in diseased tissues with normal stem cells |
| Entrez ID | Symbol | Replicates | Species | Organ | Tissue | Adj P-value | Log2FC | Malignancy |
| 7133 | TNFRSF1B | S41 | Human | Liver | Cirrhotic | 1.23e-02 | 3.41e-01 | -0.0343 |
| 7133 | TNFRSF1B | HCC2 | Human | Liver | HCC | 1.29e-21 | 2.76e+00 | 0.5341 |
| 7133 | TNFRSF1B | HCC5 | Human | Liver | HCC | 6.87e-19 | 2.49e+00 | 0.4932 |
| 7133 | TNFRSF1B | Pt13.b | Human | Liver | HCC | 6.48e-03 | 4.04e-02 | 0.0251 |
| 7133 | TNFRSF1B | S028 | Human | Liver | HCC | 1.58e-03 | 3.48e-01 | 0.2503 |
| 7133 | TNFRSF1B | S029 | Human | Liver | HCC | 2.53e-03 | 4.19e-01 | 0.2581 |
| Page: 1 |
| Tissue | Expression Dynamics | Abbreviation |
| Liver | 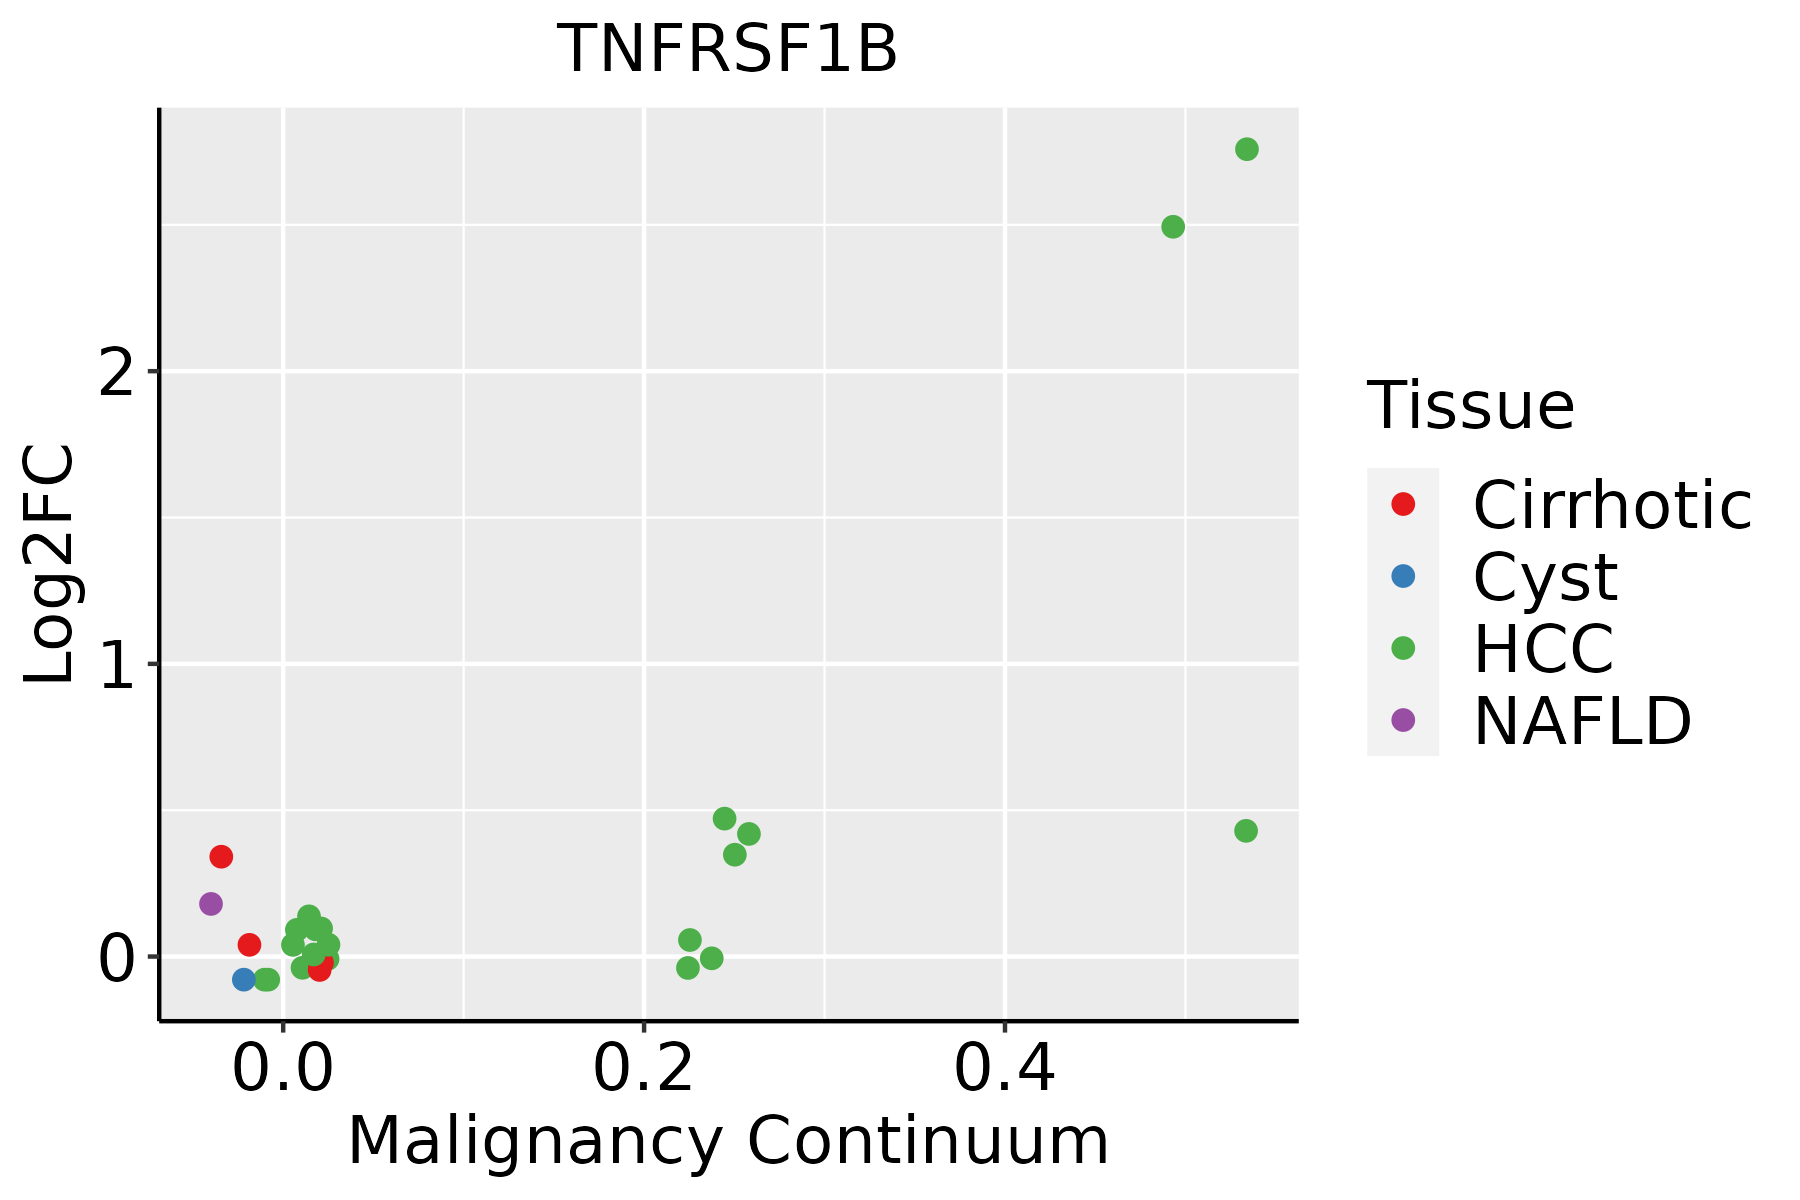 | HCC: Hepatocellular carcinoma |
| NAFLD: Non-alcoholic fatty liver disease |
| ∗log2FC in expression of this searched gene in stem-like cells from each diseased tissue sample relative to stem-like cells in normal samples in each tissue plotted against the malignancy continuum. Samples are colored based on if they are from different disease stage. |
Top |
Malignant transformation related pathway analysis |
| Find out the enriched GO biological processes and KEGG pathways involved in transition from healthy to precancer to cancer |
| Tissue | Disease Stage | Enriched GO biological Processes |
| Colorectum | AD |  |
| Colorectum | SER |  |
| Colorectum | MSS |  |
| Colorectum | MSI-H |  |
| Colorectum | FAP |  |
| ∗Top 15 enriched GO BP terms are showed in the bar plot of each disease state in each tissue. Each row represents a significant GO biological process which is colored according to the -log10(p.adjust). |
| Page: 1 2 3 4 5 6 7 8 9 |
| GO ID | Tissue | Disease Stage | Description | Gene Ratio | Bg Ratio | pvalue | p.adjust | Count |
| GO:004670021 | Liver | HCC | heterocycle catabolic process | 299/7958 | 445/18723 | 2.07e-26 | 7.29e-24 | 299 |
| GO:190136121 | Liver | HCC | organic cyclic compound catabolic process | 325/7958 | 495/18723 | 6.52e-26 | 2.18e-23 | 325 |
| GO:001943921 | Liver | HCC | aromatic compound catabolic process | 309/7958 | 467/18723 | 1.56e-25 | 4.94e-23 | 309 |
| GO:004217622 | Liver | HCC | regulation of protein catabolic process | 267/7958 | 391/18723 | 2.45e-25 | 7.38e-23 | 267 |
| GO:000640121 | Liver | HCC | RNA catabolic process | 201/7958 | 278/18723 | 3.88e-24 | 1.02e-21 | 201 |
| GO:003465521 | Liver | HCC | nucleobase-containing compound catabolic process | 273/7958 | 407/18723 | 4.84e-24 | 1.23e-21 | 273 |
| GO:004573222 | Liver | HCC | positive regulation of protein catabolic process | 163/7958 | 231/18723 | 4.00e-18 | 4.69e-16 | 163 |
| GO:004586222 | Liver | HCC | positive regulation of proteolysis | 232/7958 | 372/18723 | 5.66e-15 | 3.98e-13 | 232 |
| GO:009719322 | Liver | HCC | intrinsic apoptotic signaling pathway | 184/7958 | 288/18723 | 1.50e-13 | 8.32e-12 | 184 |
| GO:004348721 | Liver | HCC | regulation of RNA stability | 119/7958 | 170/18723 | 3.20e-13 | 1.71e-11 | 119 |
| GO:009719122 | Liver | HCC | extrinsic apoptotic signaling pathway | 143/7958 | 219/18723 | 6.99e-12 | 2.97e-10 | 143 |
| GO:005077921 | Liver | HCC | RNA destabilization | 63/7958 | 88/18723 | 2.99e-08 | 6.77e-07 | 63 |
| GO:007099722 | Liver | HCC | neuron death | 202/7958 | 361/18723 | 1.44e-07 | 2.70e-06 | 202 |
| GO:190121412 | Liver | HCC | regulation of neuron death | 179/7958 | 319/18723 | 5.65e-07 | 9.01e-06 | 179 |
| GO:000756822 | Liver | HCC | aging | 185/7958 | 339/18723 | 4.28e-06 | 5.50e-05 | 185 |
| GO:190121512 | Liver | HCC | negative regulation of neuron death | 113/7958 | 208/18723 | 3.68e-04 | 2.54e-03 | 113 |
| GO:001072011 | Liver | HCC | positive regulation of cell development | 155/7958 | 298/18723 | 5.39e-04 | 3.48e-03 | 155 |
| GO:000863011 | Liver | HCC | intrinsic apoptotic signaling pathway in response to DNA damage | 58/7958 | 99/18723 | 8.97e-04 | 5.29e-03 | 58 |
| GO:003461211 | Liver | HCC | response to tumor necrosis factor | 132/7958 | 253/18723 | 1.14e-03 | 6.48e-03 | 132 |
| GO:003249611 | Liver | HCC | response to lipopolysaccharide | 174/7958 | 343/18723 | 1.19e-03 | 6.62e-03 | 174 |
| Page: 1 2 3 4 |
| Pathway ID | Tissue | Disease Stage | Description | Gene Ratio | Bg Ratio | pvalue | p.adjust | qvalue | Count |
| hsa0501414 | Liver | Cirrhotic | Amyotrophic lateral sclerosis | 187/2530 | 364/8465 | 1.56e-18 | 6.50e-17 | 4.01e-17 | 187 |
| hsa0502214 | Liver | Cirrhotic | Pathways of neurodegeneration - multiple diseases | 217/2530 | 476/8465 | 7.30e-14 | 2.03e-12 | 1.25e-12 | 217 |
| hsa0501415 | Liver | Cirrhotic | Amyotrophic lateral sclerosis | 187/2530 | 364/8465 | 1.56e-18 | 6.50e-17 | 4.01e-17 | 187 |
| hsa0502215 | Liver | Cirrhotic | Pathways of neurodegeneration - multiple diseases | 217/2530 | 476/8465 | 7.30e-14 | 2.03e-12 | 1.25e-12 | 217 |
| hsa0501422 | Liver | HCC | Amyotrophic lateral sclerosis | 252/4020 | 364/8465 | 8.85e-18 | 7.41e-16 | 4.12e-16 | 252 |
| hsa0502222 | Liver | HCC | Pathways of neurodegeneration - multiple diseases | 298/4020 | 476/8465 | 6.59e-12 | 1.30e-10 | 7.22e-11 | 298 |
| hsa046684 | Liver | HCC | TNF signaling pathway | 73/4020 | 114/8465 | 2.53e-04 | 1.19e-03 | 6.63e-04 | 73 |
| hsa0501432 | Liver | HCC | Amyotrophic lateral sclerosis | 252/4020 | 364/8465 | 8.85e-18 | 7.41e-16 | 4.12e-16 | 252 |
| hsa0502232 | Liver | HCC | Pathways of neurodegeneration - multiple diseases | 298/4020 | 476/8465 | 6.59e-12 | 1.30e-10 | 7.22e-11 | 298 |
| hsa0466811 | Liver | HCC | TNF signaling pathway | 73/4020 | 114/8465 | 2.53e-04 | 1.19e-03 | 6.63e-04 | 73 |
| Page: 1 |
Top |
Cell-cell communication analysis |
| Identification of potential cell-cell interactions between two cell types and their ligand-receptor pairs for different disease states |
| Ligand | Receptor | LRpair | Pathway | Tissue | Disease Stage |
| TNF | TNFRSF1B | TNF_TNFRSF1B | TNF | Breast | ADJ |
| TNF | TNFRSF1B | TNF_TNFRSF1B | TNF | Breast | DCIS |
| TNF | TNFRSF1B | TNF_TNFRSF1B | TNF | Breast | Healthy |
| LTA | TNFRSF1B | LTA_TNFRSF1B | LT | Cervix | ADJ |
| TNF | TNFRSF1B | TNF_TNFRSF1B | TNF | Cervix | CC |
| TNF | TNFRSF1B | TNF_TNFRSF1B | TNF | Cervix | Healthy |
| TNF | TNFRSF1B | TNF_TNFRSF1B | TNF | Cervix | Precancer |
| TNF | TNFRSF1B | TNF_TNFRSF1B | TNF | Endometrium | ADJ |
| TNF | TNFRSF1B | TNF_TNFRSF1B | TNF | Endometrium | AEH |
| TNF | TNFRSF1B | TNF_TNFRSF1B | TNF | Endometrium | EEC |
| TNF | TNFRSF1B | TNF_TNFRSF1B | TNF | Endometrium | Healthy |
| LTA | TNFRSF1B | LTA_TNFRSF1B | LT | Esophagus | ESCC |
| TNF | TNFRSF1B | TNF_TNFRSF1B | TNF | GC | ADJ |
| TNF | TNFRSF1B | TNF_TNFRSF1B | TNF | HNSCC | ADJ |
| TNF | TNFRSF1B | TNF_TNFRSF1B | TNF | HNSCC | OSCC |
| TNF | TNFRSF1B | TNF_TNFRSF1B | TNF | HNSCC | Precancer |
| TNF | TNFRSF1B | TNF_TNFRSF1B | TNF | Liver | Healthy |
| TNF | TNFRSF1B | TNF_TNFRSF1B | TNF | Liver | Precancer |
| TNF | TNFRSF1B | TNF_TNFRSF1B | TNF | Lung | AAH |
| TNF | TNFRSF1B | TNF_TNFRSF1B | TNF | Lung | ADJ |
| Page: 1 |
Top |
Single-cell gene regulatory network inference analysis |
| Find out the significant the regulons (TFs) and the target genes of each regulon across cell types for different disease states |
| TF | Cell Type | Tissue | Disease Stage | Target Gene | RSS | Regulon Activity |
| ∗The dot plots of a searched regulon are shown for all cell subpopulations in each disease state of each tissue based on the regulon specific score inferred using pySCENIC and by calculating the average expression. |
| Page: 1 |
Top |
Somatic mutation of malignant transformation related genes |
| Annotation of somatic variants for genes involved in malignant transformation |
| Hugo Symbol | Variant Class | Variant Classification | dbSNP RS | HGVSc | HGVSp | HGVSp Short | SWISSPROT | BIOTYPE | SIFT | PolyPhen | Tumor Sample Barcode | Tissue | Histology | Sex | Age | Stage | Therapy Types | Drugs | Outcome |
| TNFRSF1B | SNV | Missense_Mutation | rs778973992 | c.1003N>T | p.Ala335Ser | p.A335S | P20333 | protein_coding | tolerated(0.08) | benign(0.283) | TCGA-3C-AALJ-01 | Breast | breast invasive carcinoma | Female | <65 | I/II | Chemotherapy | doxorubicin | SD |
| TNFRSF1B | SNV | Missense_Mutation | rs571590743 | c.1291C>T | p.Arg431Trp | p.R431W | P20333 | protein_coding | deleterious(0.02) | benign(0.251) | TCGA-AN-A046-01 | Breast | breast invasive carcinoma | Female | >=65 | I/II | Unknown | Unknown | SD |
| TNFRSF1B | SNV | Missense_Mutation | c.643N>T | p.His215Tyr | p.H215Y | P20333 | protein_coding | tolerated(1) | benign(0) | TCGA-BH-A0HF-01 | Breast | breast invasive carcinoma | Female | >=65 | I/II | Hormone Therapy | arimidex | SD | |
| TNFRSF1B | SNV | Missense_Mutation | c.1261N>A | p.Val421Ile | p.V421I | P20333 | protein_coding | tolerated(0.29) | probably_damaging(0.981) | TCGA-BH-A1FH-01 | Breast | breast invasive carcinoma | Female | <65 | III/IV | Unknown | Unknown | PD | |
| TNFRSF1B | SNV | Missense_Mutation | novel | c.931A>G | p.Thr311Ala | p.T311A | P20333 | protein_coding | tolerated(1) | benign(0) | TCGA-2W-A8YY-01 | Cervix | cervical & endocervical cancer | Female | <65 | I/II | Chemotherapy | cisplatin | CR |
| TNFRSF1B | SNV | Missense_Mutation | novel | c.363G>T | p.Arg121Ser | p.R121S | P20333 | protein_coding | tolerated(0.35) | benign(0.02) | TCGA-DS-A1OB-01 | Cervix | cervical & endocervical cancer | Female | <65 | I/II | Chemotherapy | carboplatin | PD |
| TNFRSF1B | SNV | Missense_Mutation | c.1333G>A | p.Glu445Lys | p.E445K | P20333 | protein_coding | deleterious(0.03) | benign(0.116) | TCGA-FU-A3HZ-01 | Cervix | cervical & endocervical cancer | Female | <65 | I/II | Chemotherapy | cisplatin | CR | |
| TNFRSF1B | SNV | Missense_Mutation | c.1193N>A | p.Ser398Tyr | p.S398Y | P20333 | protein_coding | deleterious(0.01) | possibly_damaging(0.641) | TCGA-IR-A3LA-01 | Cervix | cervical & endocervical cancer | Female | <65 | I/II | Chemotherapy | cisplatin | CR | |
| TNFRSF1B | SNV | Missense_Mutation | c.143N>G | p.Gln48Arg | p.Q48R | P20333 | protein_coding | tolerated(0.21) | benign(0.001) | TCGA-CA-6718-01 | Colorectum | colon adenocarcinoma | Male | <65 | I/II | Unknown | Unknown | PD | |
| TNFRSF1B | SNV | Missense_Mutation | novel | c.1118N>A | p.Gly373Asp | p.G373D | P20333 | protein_coding | deleterious(0.01) | probably_damaging(0.916) | TCGA-A5-A0G2-01 | Endometrium | uterine corpus endometrioid carcinoma | Female | <65 | III/IV | Unknown | Unknown | SD |
| Page: 1 2 3 4 |
Top |
Related drugs of malignant transformation related genes |
| Identification of chemicals and drugs interact with genes involved in malignant transfromation |
| (DGIdb 4.0) |
| Entrez ID | Symbol | Category | Interaction Types | Drug Claim Name | Drug Name | PMIDs |
| 7133 | TNFRSF1B | DRUGGABLE GENOME | CARBAMAZEPINE | CARBAMAZEPINE | 15565432 | |
| 7133 | TNFRSF1B | DRUGGABLE GENOME | ACTINOMYCIN D | 11125300 | ||
| 7133 | TNFRSF1B | DRUGGABLE GENOME | infliximab | INFLIXIMAB | 25850964,18565259,25537528,22129793 | |
| 7133 | TNFRSF1B | DRUGGABLE GENOME | 178101766 | |||
| 7133 | TNFRSF1B | DRUGGABLE GENOME | LITHIUM | LITHIUM | 15565432 | |
| 7133 | TNFRSF1B | DRUGGABLE GENOME | Tumor necrosis factor alpha (TNF-alpha) inhibitors | 25850964,18565259,25537528,22129793 | ||
| 7133 | TNFRSF1B | DRUGGABLE GENOME | etanercept | ETANERCEPT | 30075559 | |
| 7133 | TNFRSF1B | DRUGGABLE GENOME | 178101757 | |||
| 7133 | TNFRSF1B | DRUGGABLE GENOME | STAVUDINE | STAVUDINE | 9430255 | |
| 7133 | TNFRSF1B | DRUGGABLE GENOME | DIDANOSINE | DIDANOSINE | 9430255 |
| Page: 1 2 |

Copyright 2023-Present -The University of Texas Health Science Center at Houston |