
|
|||||
|
 | |
| |
| |
| |
| |
| |
|
Gene: TNFRSF12A |
Gene summary for TNFRSF12A |
| Gene information | Species | Human | Gene symbol | TNFRSF12A | Gene ID | 51330 |
| Gene name | TNF receptor superfamily member 12A | |
| Gene Alias | CD266 | |
| Cytomap | 16p13.3 | |
| Gene Type | protein-coding | GO ID | GO:0001525 | UniProtAcc | Q9NP84 |
Top |
Malignant transformation analysis |
| Identification of the aberrant gene expression in precancerous and cancerous lesions by comparing the gene expression of stem-like cells in diseased tissues with normal stem cells |
| Entrez ID | Symbol | Replicates | Species | Organ | Tissue | Adj P-value | Log2FC | Malignancy |
| 51330 | TNFRSF12A | GSM4909277 | Human | Breast | Precancer | 4.17e-06 | 6.32e-01 | 0.0177 |
| 51330 | TNFRSF12A | GSM4909281 | Human | Breast | IDC | 9.02e-08 | -4.33e-01 | 0.21 |
| 51330 | TNFRSF12A | GSM4909285 | Human | Breast | IDC | 2.90e-11 | -4.36e-01 | 0.21 |
| 51330 | TNFRSF12A | GSM4909286 | Human | Breast | IDC | 1.48e-18 | -6.80e-01 | 0.1081 |
| 51330 | TNFRSF12A | GSM4909288 | Human | Breast | IDC | 1.26e-03 | -6.25e-01 | 0.0988 |
| 51330 | TNFRSF12A | GSM4909292 | Human | Breast | IDC | 2.15e-04 | -7.83e-01 | 0.1236 |
| 51330 | TNFRSF12A | GSM4909293 | Human | Breast | IDC | 8.47e-17 | -5.77e-01 | 0.1581 |
| 51330 | TNFRSF12A | GSM4909294 | Human | Breast | IDC | 1.65e-07 | -4.98e-01 | 0.2022 |
| 51330 | TNFRSF12A | GSM4909296 | Human | Breast | IDC | 6.50e-09 | -4.31e-01 | 0.1524 |
| 51330 | TNFRSF12A | GSM4909297 | Human | Breast | IDC | 6.42e-13 | -4.57e-01 | 0.1517 |
| 51330 | TNFRSF12A | GSM4909298 | Human | Breast | IDC | 3.17e-06 | -3.90e-01 | 0.1551 |
| 51330 | TNFRSF12A | GSM4909301 | Human | Breast | IDC | 2.24e-16 | -6.39e-01 | 0.1577 |
| 51330 | TNFRSF12A | GSM4909304 | Human | Breast | IDC | 1.41e-06 | -4.81e-01 | 0.1636 |
| 51330 | TNFRSF12A | GSM4909306 | Human | Breast | IDC | 1.31e-05 | -4.20e-01 | 0.1564 |
| 51330 | TNFRSF12A | GSM4909307 | Human | Breast | IDC | 2.55e-13 | -5.66e-01 | 0.1569 |
| 51330 | TNFRSF12A | GSM4909308 | Human | Breast | IDC | 8.71e-07 | -4.71e-01 | 0.158 |
| 51330 | TNFRSF12A | GSM4909311 | Human | Breast | IDC | 1.62e-34 | -7.31e-01 | 0.1534 |
| 51330 | TNFRSF12A | GSM4909312 | Human | Breast | IDC | 5.35e-17 | -5.55e-01 | 0.1552 |
| 51330 | TNFRSF12A | GSM4909317 | Human | Breast | IDC | 3.97e-02 | -3.54e-01 | 0.1355 |
| 51330 | TNFRSF12A | GSM4909319 | Human | Breast | IDC | 1.79e-27 | -5.18e-01 | 0.1563 |
| Page: 1 2 3 4 5 6 7 8 9 10 11 12 |
| Tissue | Expression Dynamics | Abbreviation |
| Breast | 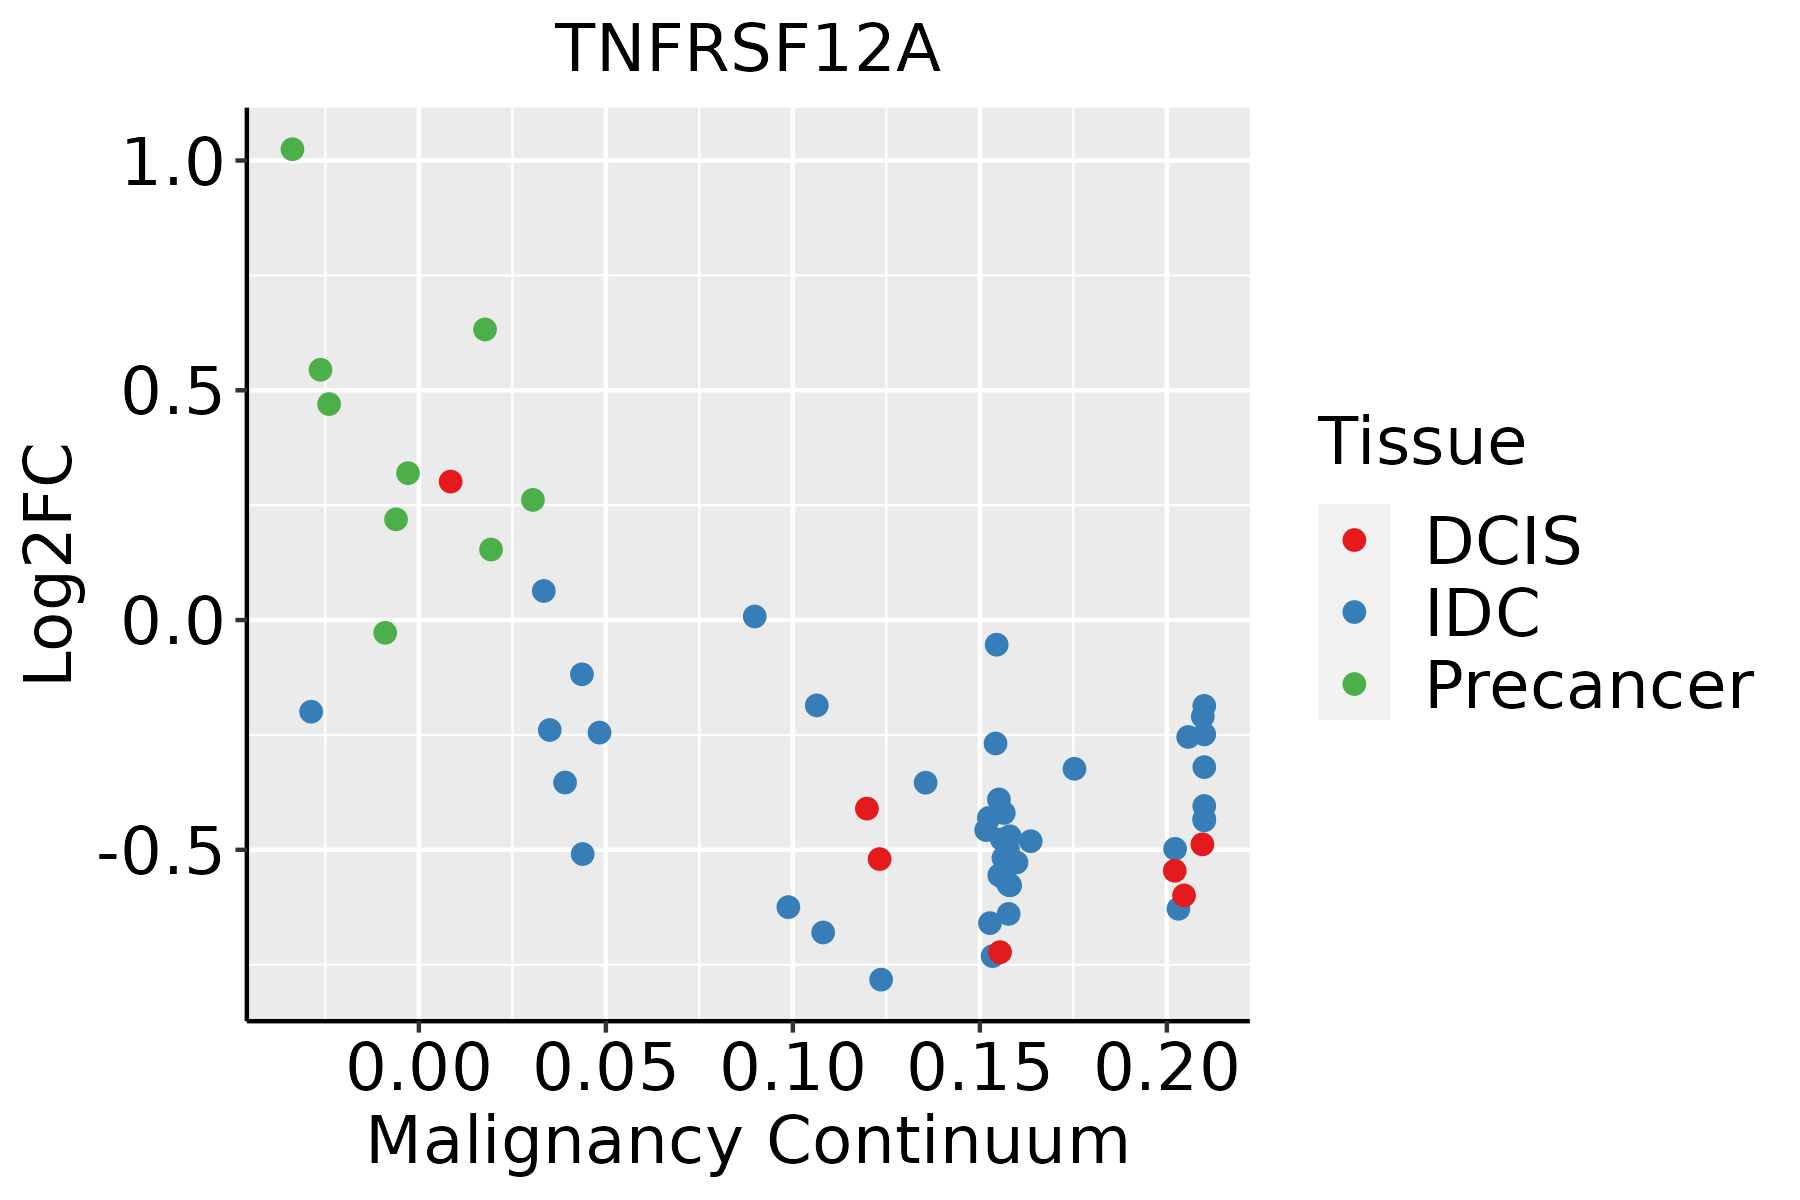 | IDC: Invasive ductal carcinoma |
| DCIS: Ductal carcinoma in situ | ||
| Precancer(BRCA1-mut): Precancerous lesion from BRCA1 mutation carriers | ||
| Cervix | 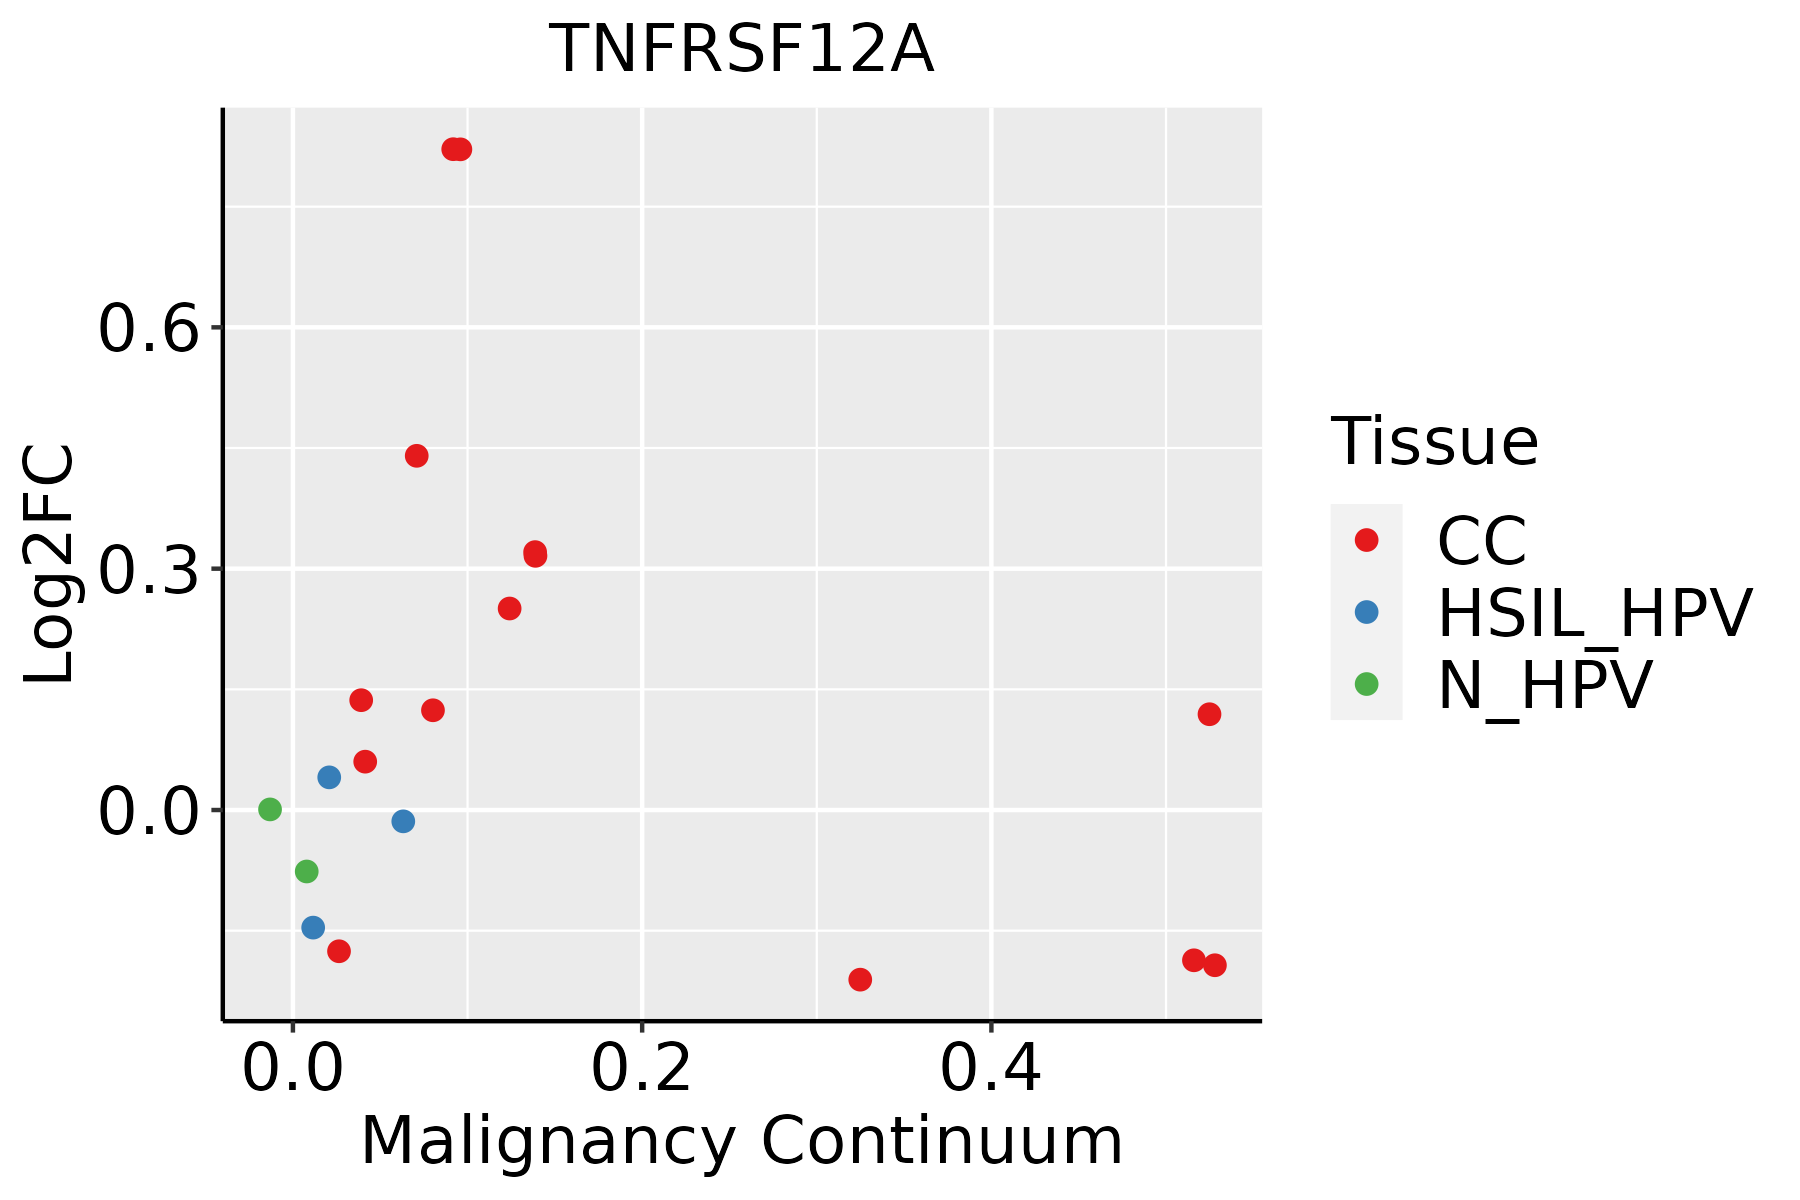 | CC: Cervix cancer |
| HSIL_HPV: HPV-infected high-grade squamous intraepithelial lesions | ||
| N_HPV: HPV-infected normal cervix | ||
| Endometrium |  | AEH: Atypical endometrial hyperplasia |
| EEC: Endometrioid Cancer | ||
| Esophagus | 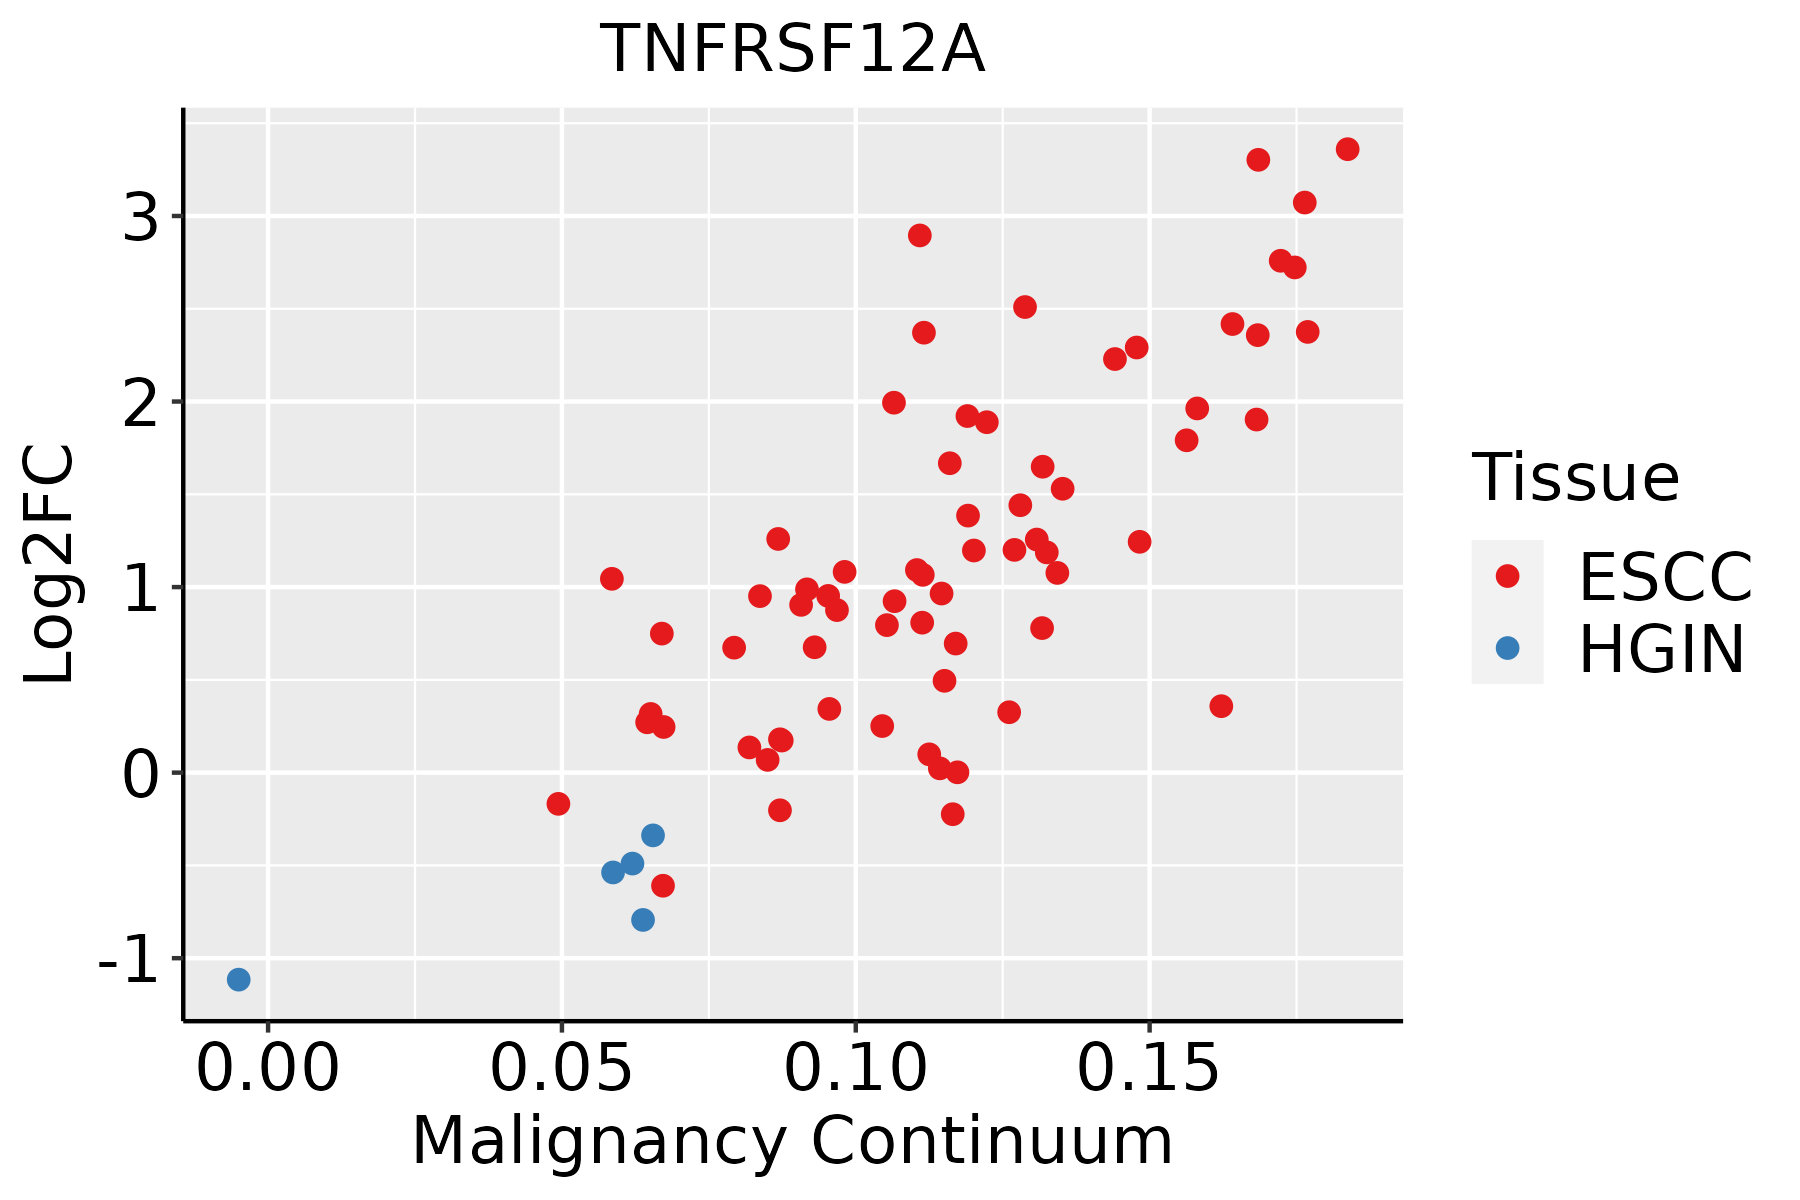 | ESCC: Esophageal squamous cell carcinoma |
| HGIN: High-grade intraepithelial neoplasias | ||
| LGIN: Low-grade intraepithelial neoplasias | ||
| GC | 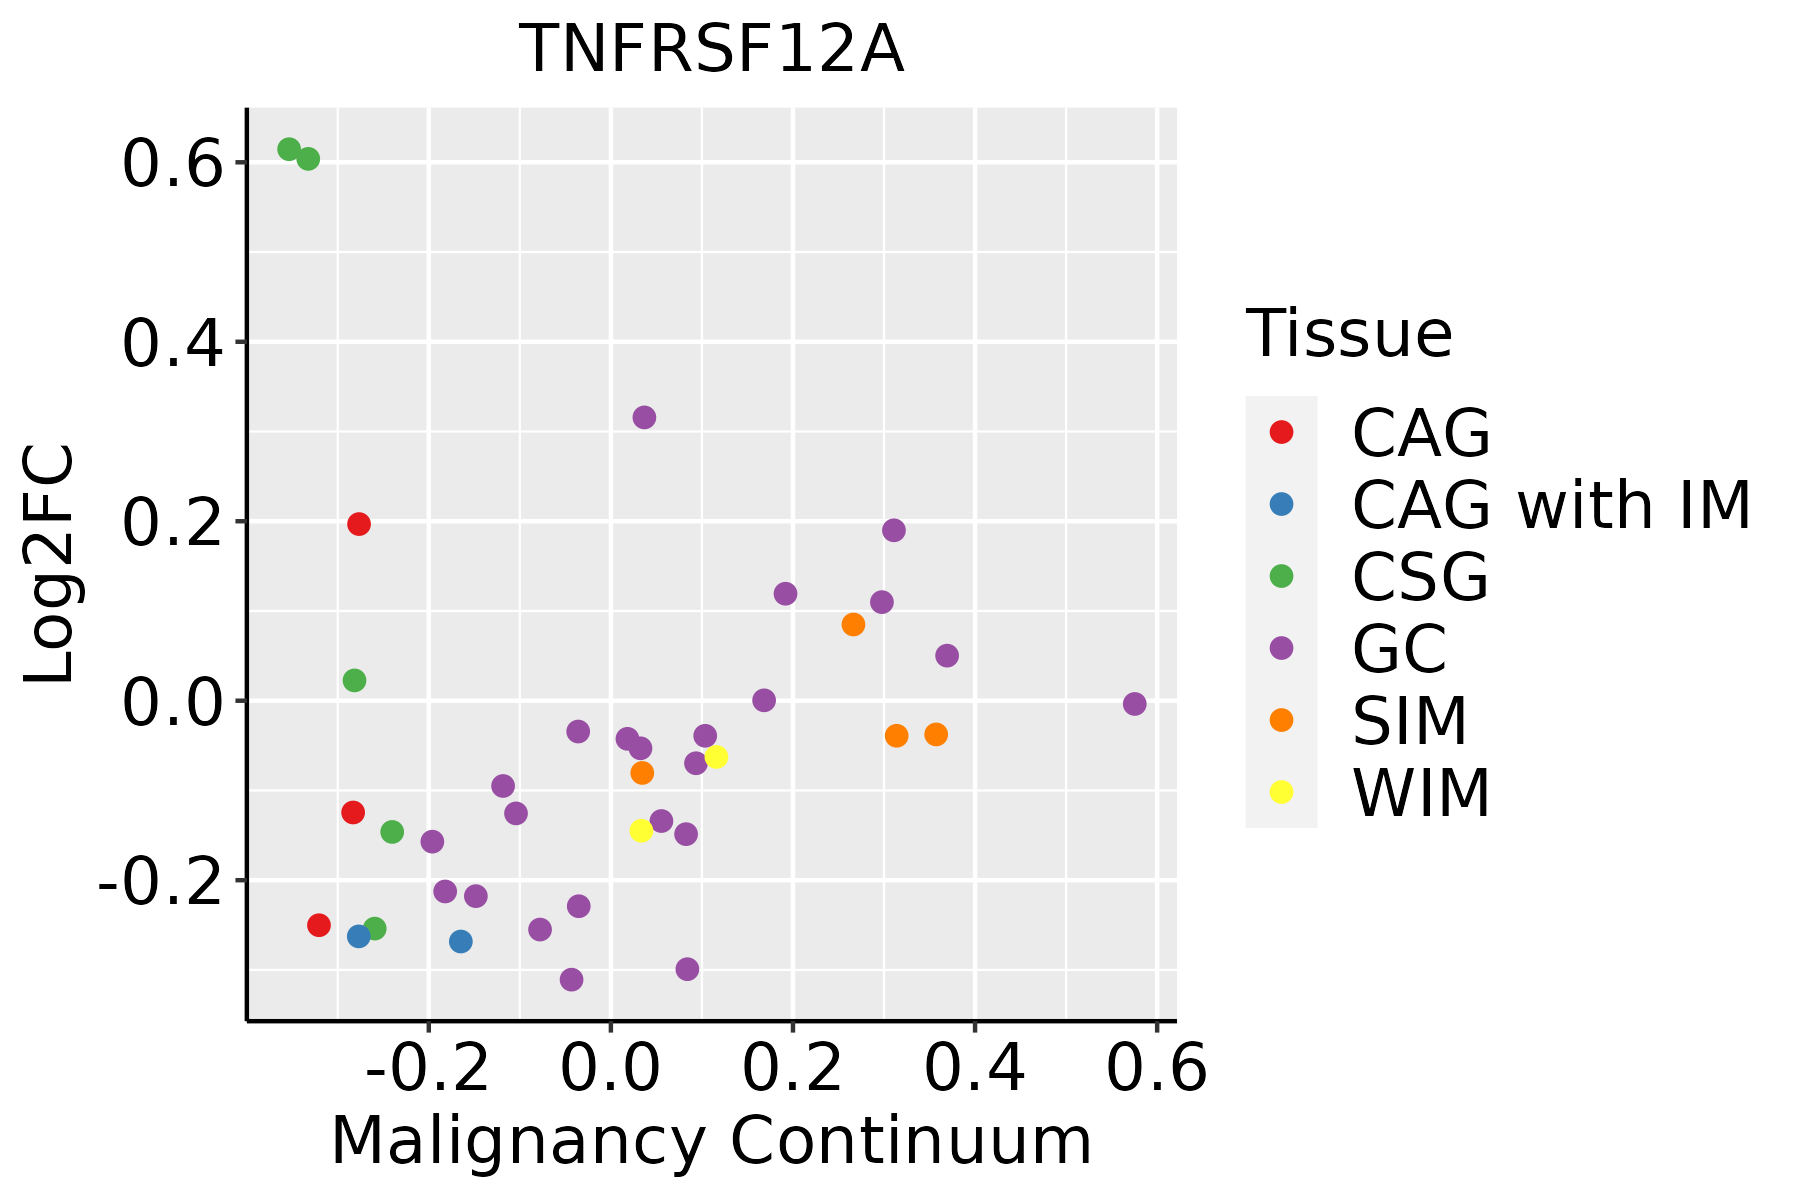 | CAG: Chronic atrophic gastritis |
| CAG with IM: Chronic atrophic gastritis with intestinal metaplasia | ||
| CSG: Chronic superficial gastritis | ||
| GC: Gastric cancer | ||
| SIM: Severe intestinal metaplasia | ||
| WIM: Wild intestinal metaplasia | ||
| Liver |  | HCC: Hepatocellular carcinoma |
| NAFLD: Non-alcoholic fatty liver disease | ||
| Oral Cavity | 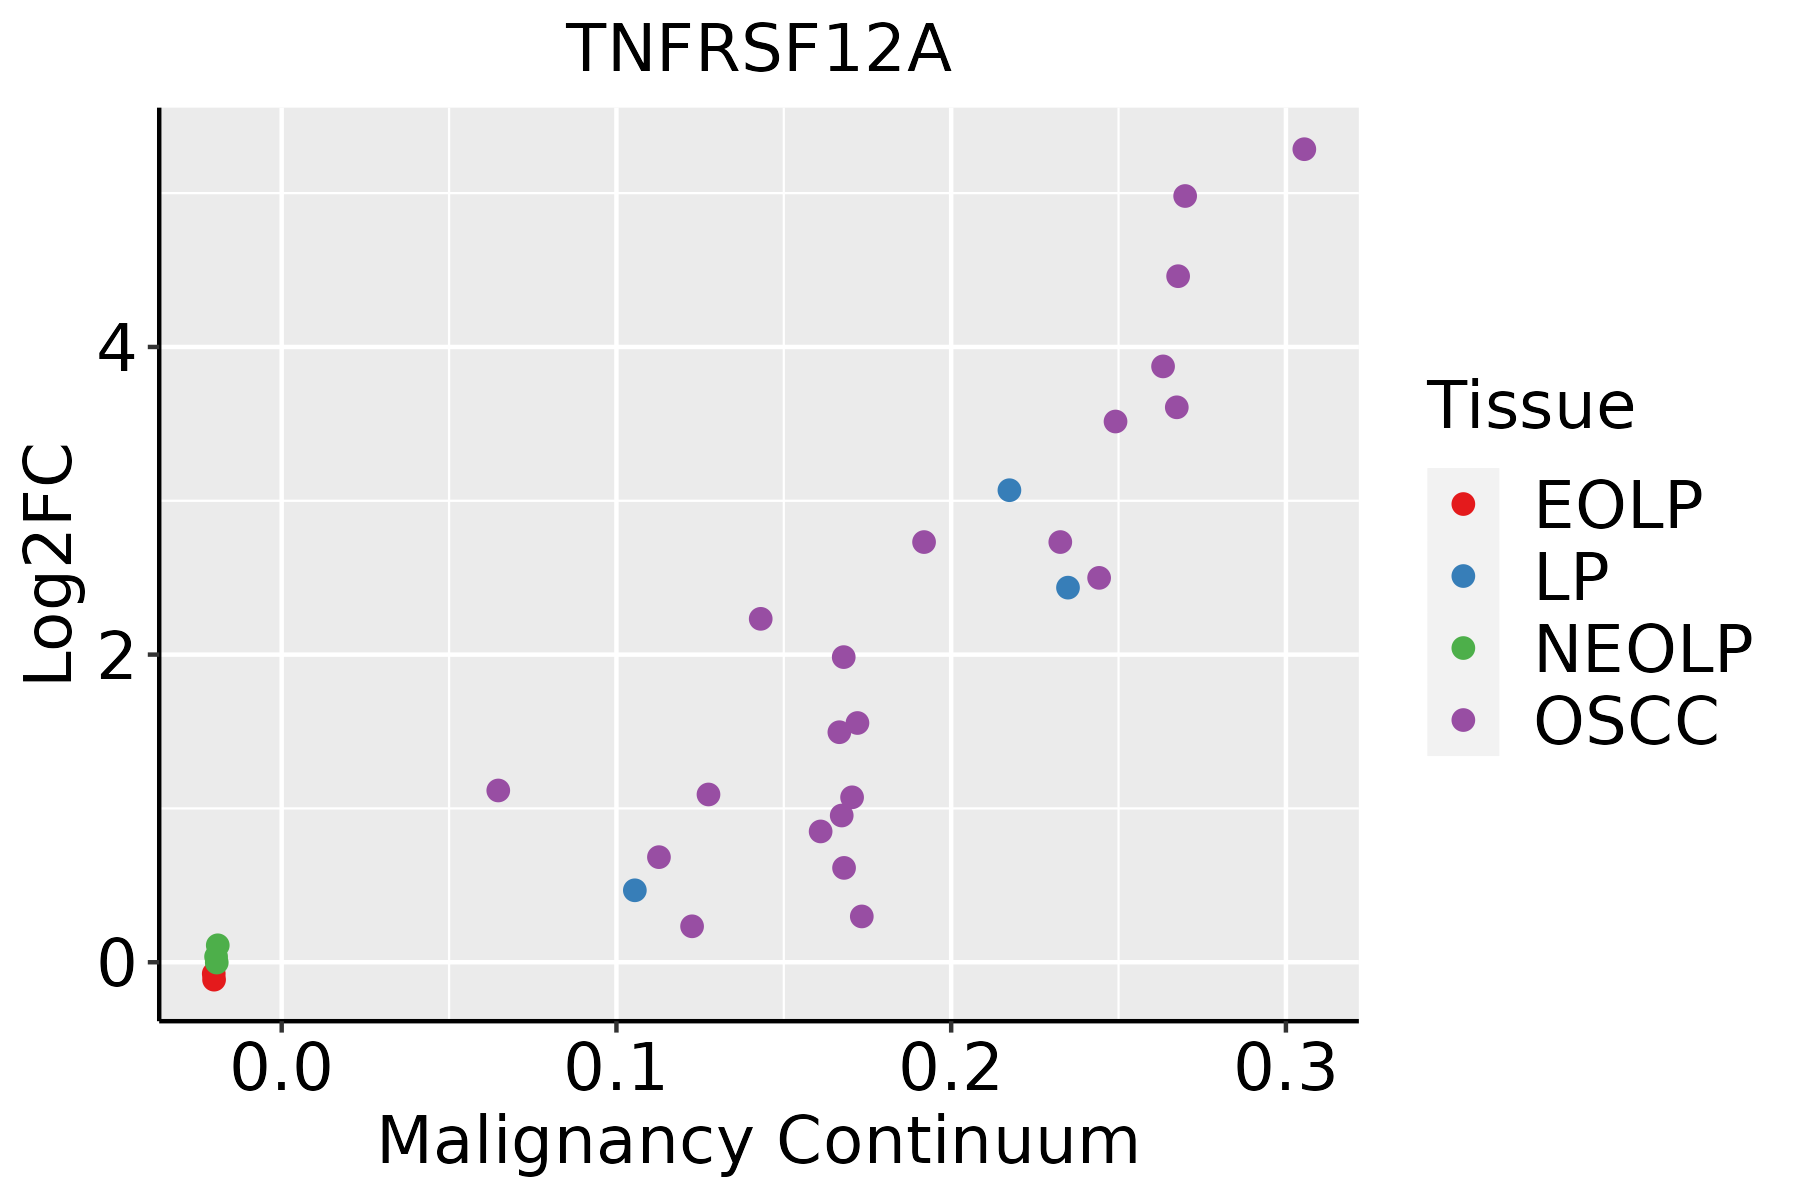 | EOLP: Erosive Oral lichen planus |
| LP: leukoplakia | ||
| NEOLP: Non-erosive oral lichen planus | ||
| OSCC: Oral squamous cell carcinoma | ||
| Prostate | 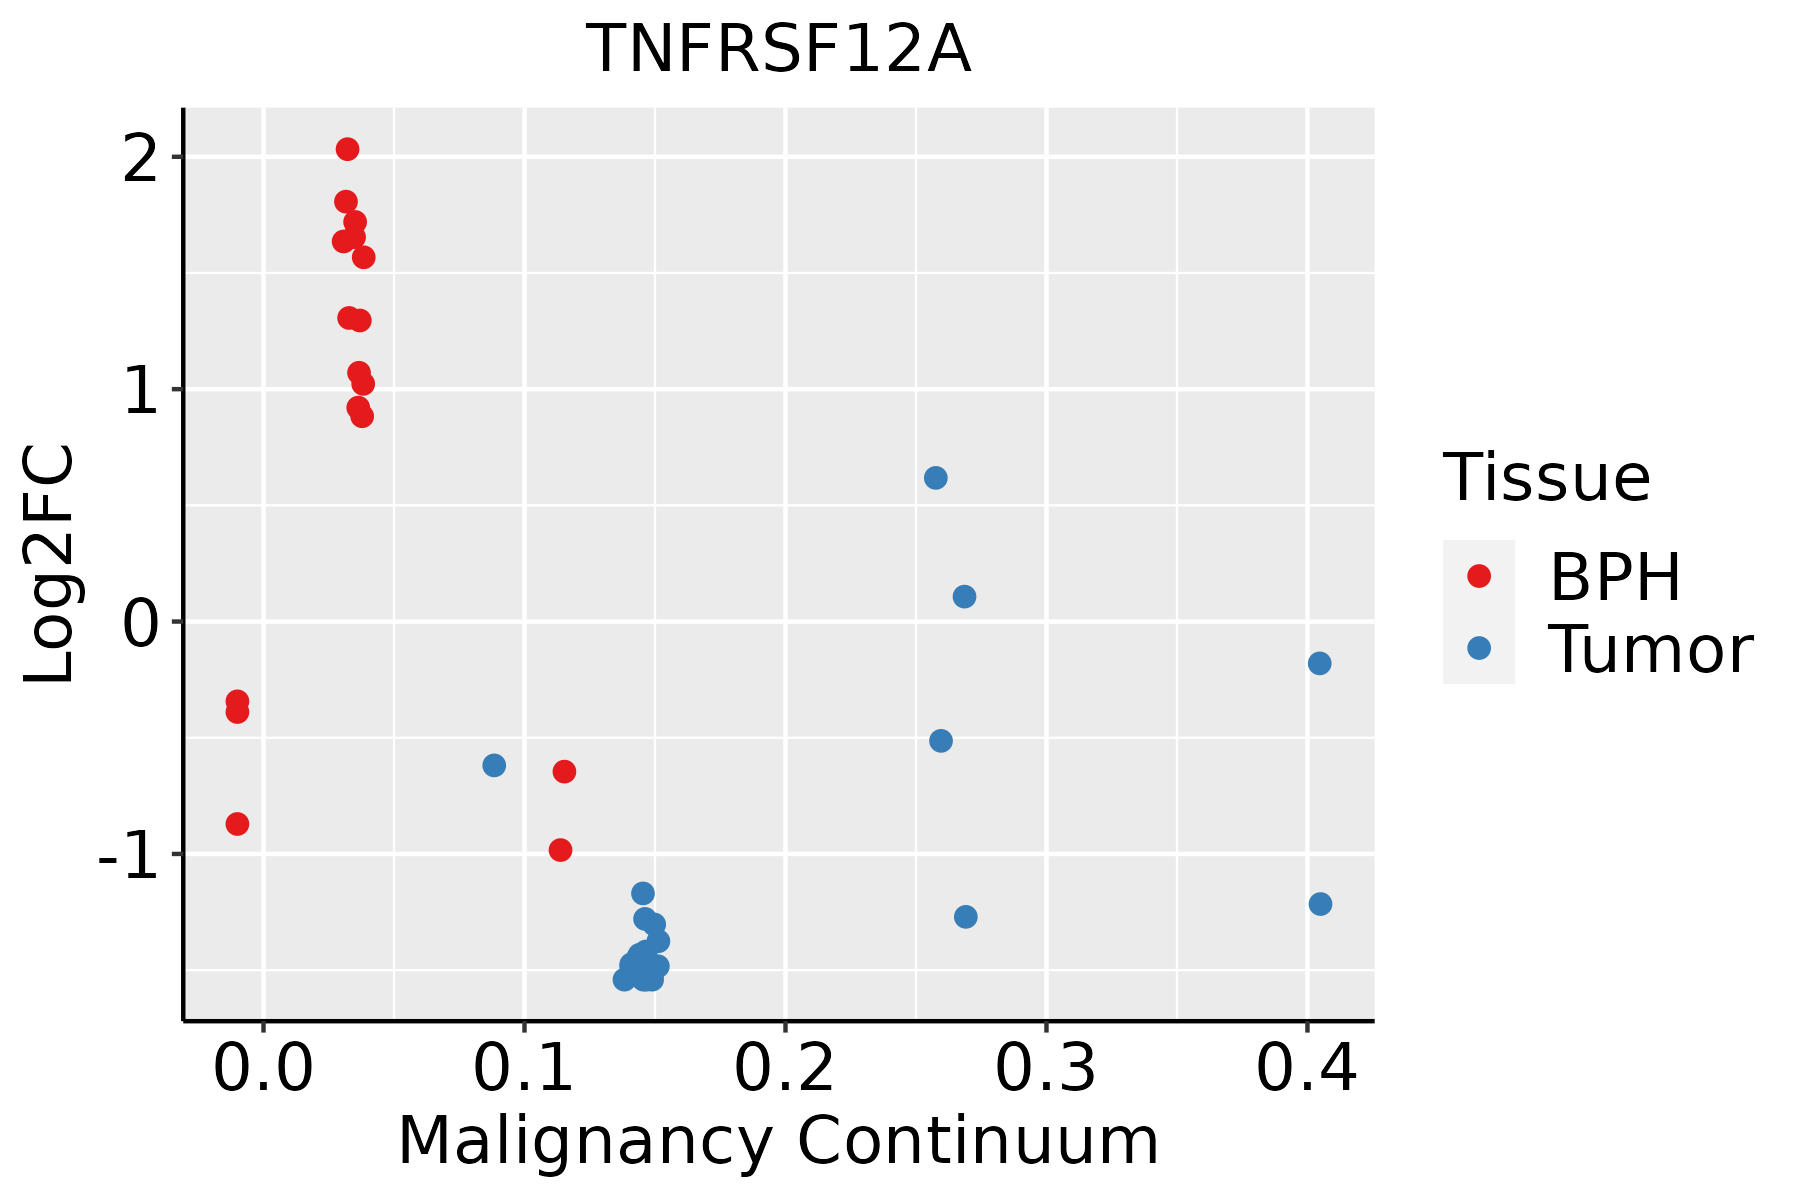 | BPH: Benign Prostatic Hyperplasia |
| Skin | 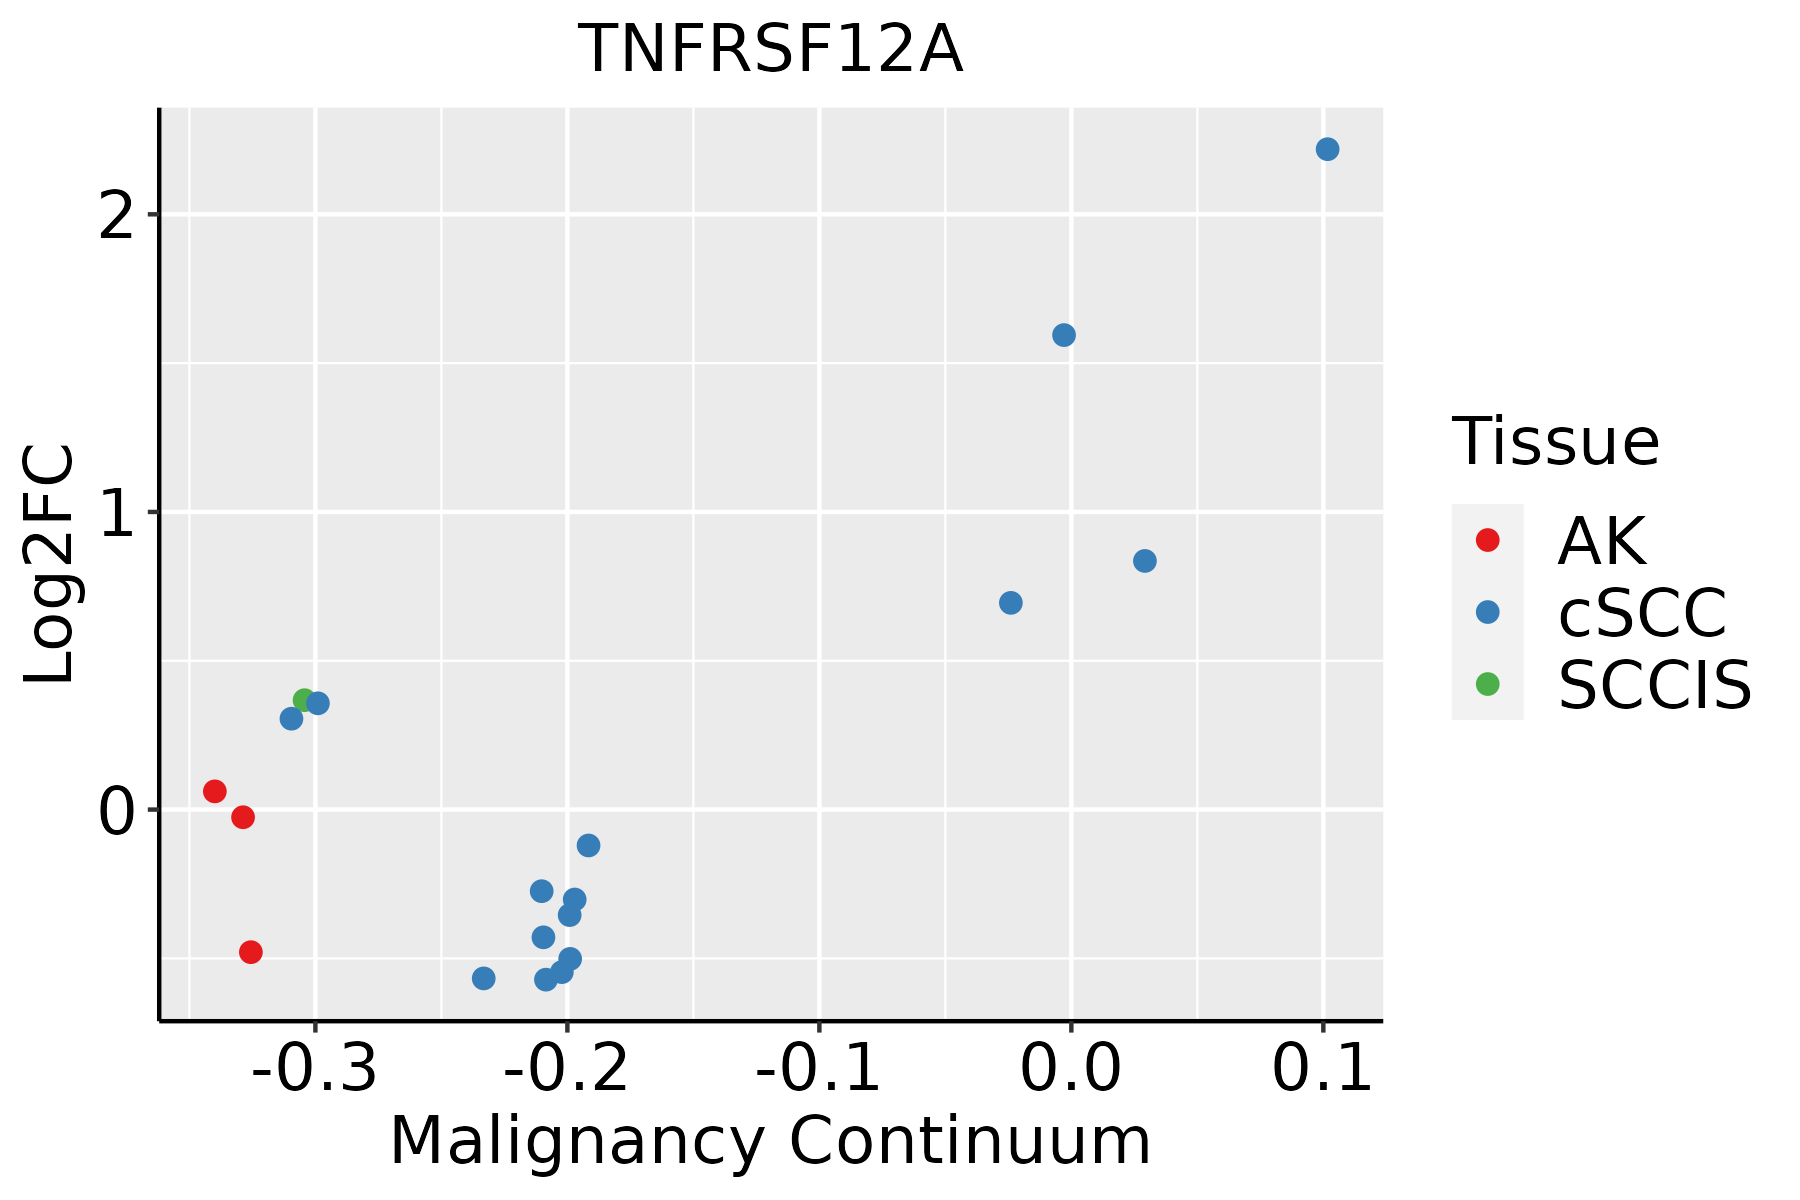 | AK: Actinic keratosis |
| cSCC: Cutaneous squamous cell carcinoma | ||
| SCCIS:squamous cell carcinoma in situ | ||
| Thyroid | 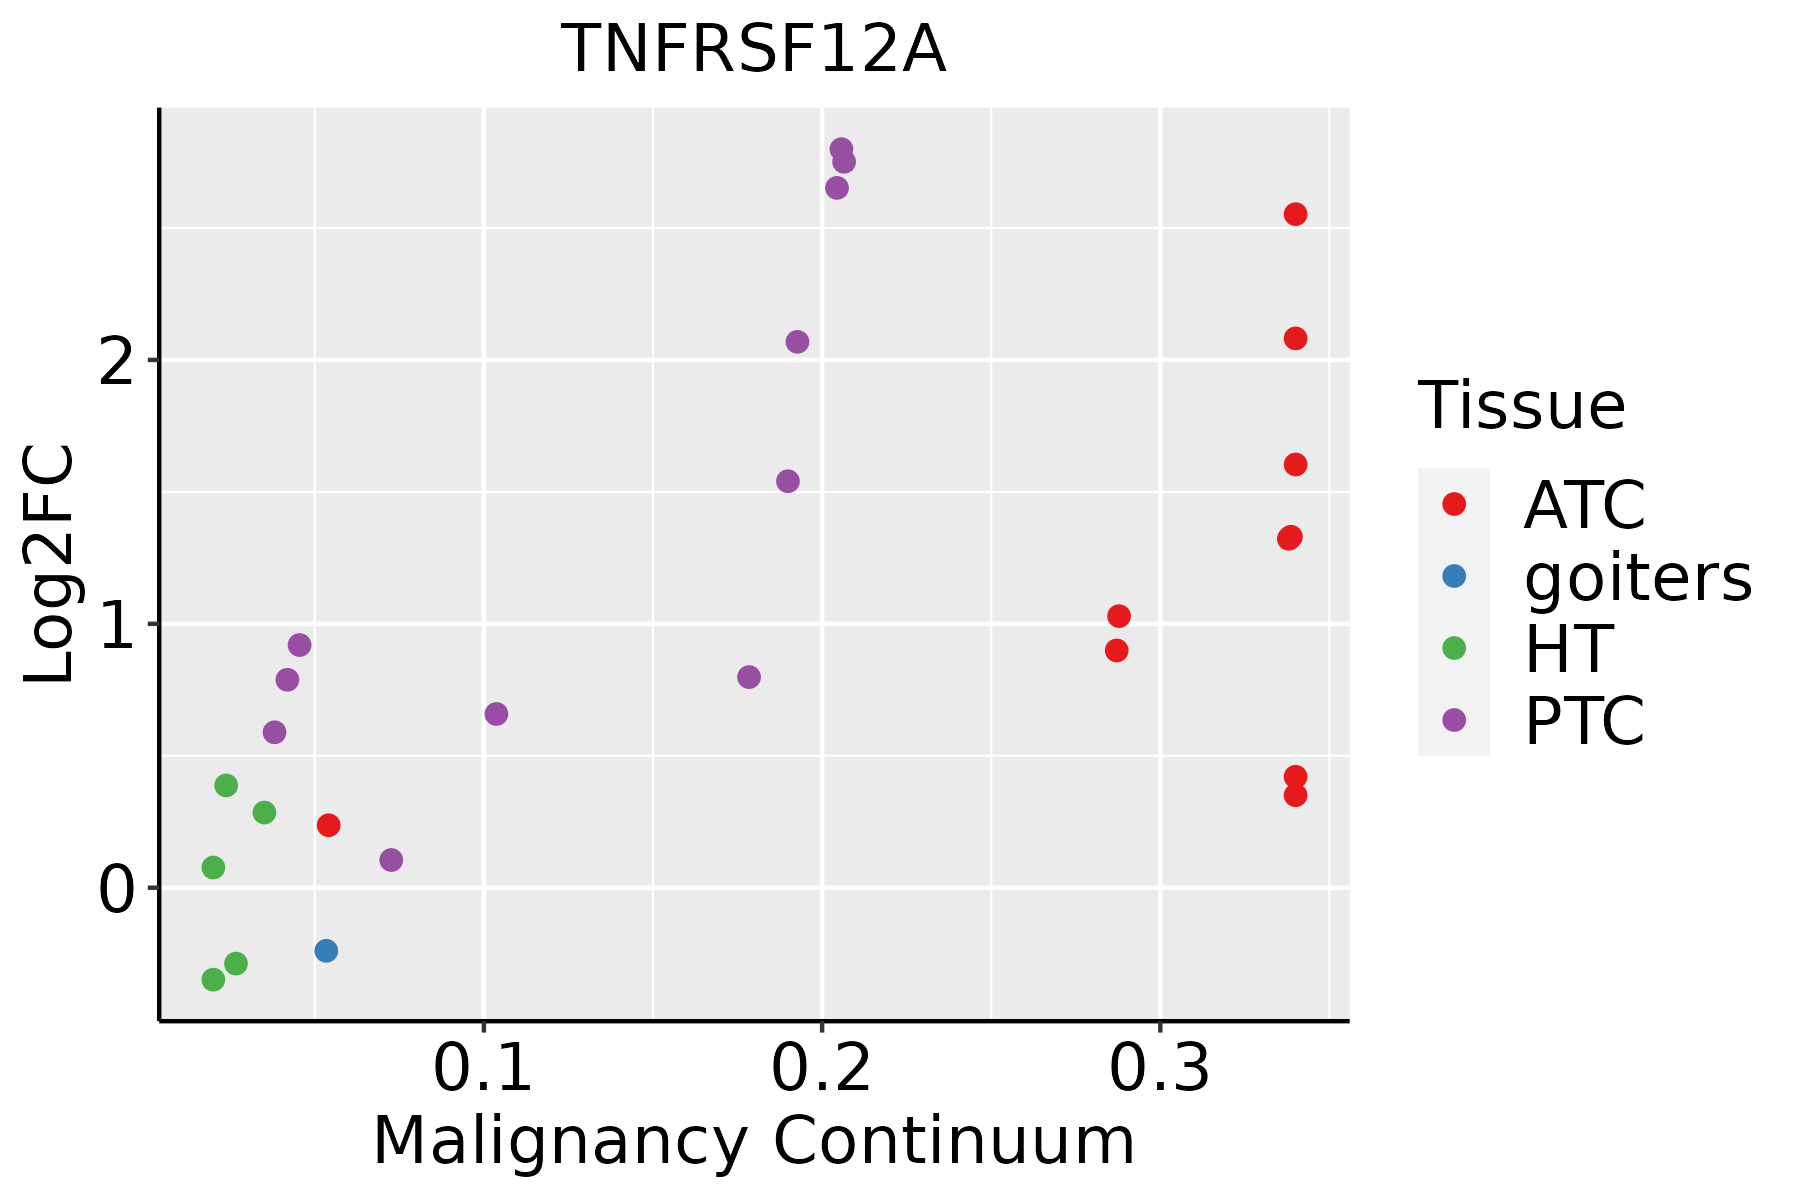 | ATC: Anaplastic thyroid cancer |
| HT: Hashimoto's thyroiditis | ||
| PTC: Papillary thyroid cancer |
| ∗log2FC in expression of this searched gene in stem-like cells from each diseased tissue sample relative to stem-like cells in normal samples in each tissue plotted against the malignancy continuum. Samples are colored based on if they are from different disease stage. |
Top |
Malignant transformation related pathway analysis |
| Find out the enriched GO biological processes and KEGG pathways involved in transition from healthy to precancer to cancer |
| Tissue | Disease Stage | Enriched GO biological Processes |
| Colorectum | AD |  |
| Colorectum | SER |  |
| Colorectum | MSS |  |
| Colorectum | MSI-H |  |
| Colorectum | FAP |  |
| ∗Top 15 enriched GO BP terms are showed in the bar plot of each disease state in each tissue. Each row represents a significant GO biological process which is colored according to the -log10(p.adjust). |
| Page: 1 2 3 4 5 6 7 8 9 |
| GO ID | Tissue | Disease Stage | Description | Gene Ratio | Bg Ratio | pvalue | p.adjust | Count |
| GO:200123617 | Endometrium | EEC | regulation of extrinsic apoptotic signaling pathway | 40/2168 | 151/18723 | 3.33e-07 | 1.33e-05 | 40 |
| GO:200123814 | Endometrium | EEC | positive regulation of extrinsic apoptotic signaling pathway | 16/2168 | 48/18723 | 5.88e-05 | 9.12e-04 | 16 |
| GO:190303415 | Endometrium | EEC | regulation of response to wounding | 36/2168 | 167/18723 | 1.58e-04 | 1.99e-03 | 36 |
| GO:006104114 | Endometrium | EEC | regulation of wound healing | 28/2168 | 134/18723 | 1.34e-03 | 1.10e-02 | 28 |
| GO:200123327 | Esophagus | HGIN | regulation of apoptotic signaling pathway | 97/2587 | 356/18723 | 1.36e-11 | 1.57e-09 | 97 |
| GO:200123519 | Esophagus | HGIN | positive regulation of apoptotic signaling pathway | 41/2587 | 126/18723 | 6.06e-08 | 3.22e-06 | 41 |
| GO:009719126 | Esophagus | HGIN | extrinsic apoptotic signaling pathway | 56/2587 | 219/18723 | 2.48e-06 | 8.80e-05 | 56 |
| GO:200123626 | Esophagus | HGIN | regulation of extrinsic apoptotic signaling pathway | 36/2587 | 151/18723 | 6.20e-04 | 8.58e-03 | 36 |
| GO:200123810 | Esophagus | HGIN | positive regulation of extrinsic apoptotic signaling pathway | 15/2587 | 48/18723 | 1.49e-03 | 1.73e-02 | 15 |
| GO:2001233111 | Esophagus | ESCC | regulation of apoptotic signaling pathway | 256/8552 | 356/18723 | 4.11e-24 | 1.04e-21 | 256 |
| GO:0097191111 | Esophagus | ESCC | extrinsic apoptotic signaling pathway | 159/8552 | 219/18723 | 4.12e-16 | 2.94e-14 | 159 |
| GO:2001236111 | Esophagus | ESCC | regulation of extrinsic apoptotic signaling pathway | 111/8552 | 151/18723 | 2.97e-12 | 1.18e-10 | 111 |
| GO:2001235110 | Esophagus | ESCC | positive regulation of apoptotic signaling pathway | 92/8552 | 126/18723 | 3.91e-10 | 1.05e-08 | 92 |
| GO:200123817 | Esophagus | ESCC | positive regulation of extrinsic apoptotic signaling pathway | 40/8552 | 48/18723 | 8.03e-08 | 1.39e-06 | 40 |
| GO:004206027 | Esophagus | ESCC | wound healing | 243/8552 | 422/18723 | 4.62e-07 | 6.25e-06 | 243 |
| GO:190303420 | Esophagus | ESCC | regulation of response to wounding | 93/8552 | 167/18723 | 5.77e-03 | 2.14e-02 | 93 |
| GO:00610417 | Liver | NAFLD | regulation of wound healing | 39/1882 | 134/18723 | 5.52e-10 | 1.28e-07 | 39 |
| GO:00420607 | Liver | NAFLD | wound healing | 84/1882 | 422/18723 | 6.56e-10 | 1.37e-07 | 84 |
| GO:19030347 | Liver | NAFLD | regulation of response to wounding | 41/1882 | 167/18723 | 4.70e-08 | 4.58e-06 | 41 |
| GO:20012337 | Liver | NAFLD | regulation of apoptotic signaling pathway | 57/1882 | 356/18723 | 2.73e-04 | 4.41e-03 | 57 |
| Page: 1 2 3 4 5 6 7 8 9 10 |
| Pathway ID | Tissue | Disease Stage | Description | Gene Ratio | Bg Ratio | pvalue | p.adjust | qvalue | Count |
| Page: 1 |
Top |
Cell-cell communication analysis |
| Identification of potential cell-cell interactions between two cell types and their ligand-receptor pairs for different disease states |
| Ligand | Receptor | LRpair | Pathway | Tissue | Disease Stage |
| TNFSF12 | TNFRSF12A | TNFSF12_TNFRSF12A | TWEAK | Breast | DCIS |
| TNFSF12 | TNFRSF12A | TNFSF12_TNFRSF12A | TWEAK | Breast | Healthy |
| TNFSF12 | TNFRSF12A | TNFSF12_TNFRSF12A | TWEAK | Cervix | ADJ |
| TNFSF12 | TNFRSF12A | TNFSF12_TNFRSF12A | TWEAK | Cervix | Healthy |
| TNFSF12 | TNFRSF12A | TNFSF12_TNFRSF12A | TWEAK | Cervix | Precancer |
| TNFSF12 | TNFRSF12A | TNFSF12_TNFRSF12A | TWEAK | Endometrium | AEH |
| TNFSF12 | TNFRSF12A | TNFSF12_TNFRSF12A | TWEAK | Endometrium | EEC |
| TNFSF12 | TNFRSF12A | TNFSF12_TNFRSF12A | TWEAK | Endometrium | Healthy |
| TNFSF12 | TNFRSF12A | TNFSF12_TNFRSF12A | TWEAK | Esophagus | ESCC |
| TNFSF12 | TNFRSF12A | TNFSF12_TNFRSF12A | TWEAK | HNSCC | ADJ |
| TNFSF12 | TNFRSF12A | TNFSF12_TNFRSF12A | TWEAK | HNSCC | Healthy |
| TNFSF12 | TNFRSF12A | TNFSF12_TNFRSF12A | TWEAK | HNSCC | OSCC |
| TNFSF12 | TNFRSF12A | TNFSF12_TNFRSF12A | TWEAK | HNSCC | Precancer |
| TNFSF12 | TNFRSF12A | TNFSF12_TNFRSF12A | TWEAK | Liver | Healthy |
| TNFSF12 | TNFRSF12A | TNFSF12_TNFRSF12A | TWEAK | Lung | AAH |
| TNFSF12 | TNFRSF12A | TNFSF12_TNFRSF12A | TWEAK | Lung | IAC |
| TNFSF12 | TNFRSF12A | TNFSF12_TNFRSF12A | TWEAK | Lung | MIAC |
| TNFSF12 | TNFRSF12A | TNFSF12_TNFRSF12A | TWEAK | Lung | Precancer |
| TNFSF12 | TNFRSF12A | TNFSF12_TNFRSF12A | TWEAK | Prostate | BPH |
| TNFSF12 | TNFRSF12A | TNFSF12_TNFRSF12A | TWEAK | Prostate | Healthy |
| Page: 1 |
Top |
Single-cell gene regulatory network inference analysis |
| Find out the significant the regulons (TFs) and the target genes of each regulon across cell types for different disease states |
| TF | Cell Type | Tissue | Disease Stage | Target Gene | RSS | Regulon Activity |
| ∗The dot plots of a searched regulon are shown for all cell subpopulations in each disease state of each tissue based on the regulon specific score inferred using pySCENIC and by calculating the average expression. |
| Page: 1 |
Top |
Somatic mutation of malignant transformation related genes |
| Annotation of somatic variants for genes involved in malignant transformation |
| Hugo Symbol | Variant Class | Variant Classification | dbSNP RS | HGVSc | HGVSp | HGVSp Short | SWISSPROT | BIOTYPE | SIFT | PolyPhen | Tumor Sample Barcode | Tissue | Histology | Sex | Age | Stage | Therapy Types | Drugs | Outcome |
| TNFRSF12A | deletion | Frame_Shift_Del | novel | c.226delC | p.Arg76GlyfsTer11 | p.R76Gfs*11 | Q9NP84 | protein_coding | TCGA-D8-A27V-01 | Breast | breast invasive carcinoma | Female | <65 | I/II | Hormone Therapy | tamoxiphen | SD | ||
| TNFRSF12A | SNV | Missense_Mutation | rs201879993 | c.358N>A | p.Glu120Lys | p.E120K | Q9NP84 | protein_coding | tolerated(0.15) | benign(0.192) | TCGA-4J-AA1J-01 | Cervix | cervical & endocervical cancer | Female | <65 | I/II | Unknown | Unknown | SD |
| TNFRSF12A | SNV | Missense_Mutation | c.305G>A | p.Arg102Lys | p.R102K | Q9NP84 | protein_coding | tolerated(0.15) | probably_damaging(0.924) | TCGA-EK-A2PG-01 | Cervix | cervical & endocervical cancer | Female | >=65 | I/II | Unknown | Unknown | SD | |
| TNFRSF12A | SNV | Missense_Mutation | c.244N>T | p.Leu82Phe | p.L82F | Q9NP84 | protein_coding | tolerated(0.06) | probably_damaging(0.999) | TCGA-38-4629-01 | Lung | lung adenocarcinoma | Male | >=65 | I/II | Unknown | Unknown | PD | |
| TNFRSF12A | SNV | Missense_Mutation | novel | c.332C>G | p.Thr111Ser | p.T111S | Q9NP84 | protein_coding | tolerated(0.06) | probably_damaging(0.968) | TCGA-75-6211-01 | Lung | lung adenocarcinoma | Female | Unknown | I/II | Unknown | Unknown | PD |
| TNFRSF12A | SNV | Missense_Mutation | novel | c.46N>T | p.Gly16Trp | p.G16W | Q9NP84 | protein_coding | deleterious(0) | probably_damaging(0.963) | TCGA-77-7335-01 | Lung | lung squamous cell carcinoma | Female | <65 | III/IV | Unknown | Unknown | SD |
| TNFRSF12A | SNV | Missense_Mutation | novel | c.277N>A | p.Gly93Arg | p.G93R | Q9NP84 | protein_coding | deleterious(0.03) | possibly_damaging(0.588) | TCGA-VQ-A8P2-01 | Stomach | stomach adenocarcinoma | Male | >=65 | III/IV | Unspecific | Complete Response |
| Page: 1 |
Top |
Related drugs of malignant transformation related genes |
| Identification of chemicals and drugs interact with genes involved in malignant transfromation |
| (DGIdb 4.0) |
| Entrez ID | Symbol | Category | Interaction Types | Drug Claim Name | Drug Name | PMIDs |
| 51330 | TNFRSF12A | DRUGGABLE GENOME | Enavatuzumab | ENAVATUZUMAB | ||
| 51330 | TNFRSF12A | DRUGGABLE GENOME | agonist | CHEMBL1743011 | ENAVATUZUMAB | |
| 51330 | TNFRSF12A | DRUGGABLE GENOME | 178101760 |
| Page: 1 |

Copyright 2023-Present -The University of Texas Health Science Center at Houston |