
|
|||||
|
 | |
| |
| |
| |
| |
| |
|
Gene: TMEM87A |
Gene summary for TMEM87A |
| Gene information | Species | Human | Gene symbol | TMEM87A | Gene ID | 25963 |
| Gene name | transmembrane protein 87A | |
| Gene Alias | TMEM87A | |
| Cytomap | 15q15.1 | |
| Gene Type | protein-coding | GO ID | GO:0006810 | UniProtAcc | Q8NBN3 |
Top |
Malignant transformation analysis |
| Identification of the aberrant gene expression in precancerous and cancerous lesions by comparing the gene expression of stem-like cells in diseased tissues with normal stem cells |
| Entrez ID | Symbol | Replicates | Species | Organ | Tissue | Adj P-value | Log2FC | Malignancy |
| 25963 | TMEM87A | CA_HPV_1 | Human | Cervix | CC | 1.04e-02 | -5.91e-02 | 0.0264 |
| 25963 | TMEM87A | CCI_1 | Human | Cervix | CC | 4.65e-02 | 5.85e-01 | 0.528 |
| 25963 | TMEM87A | CCI_2 | Human | Cervix | CC | 4.86e-04 | 7.14e-01 | 0.5249 |
| 25963 | TMEM87A | HTA11_3410_2000001011 | Human | Colorectum | AD | 2.65e-20 | -5.94e-01 | 0.0155 |
| 25963 | TMEM87A | HTA11_2951_2000001011 | Human | Colorectum | AD | 2.24e-05 | -9.11e-01 | 0.0216 |
| 25963 | TMEM87A | HTA11_347_2000001011 | Human | Colorectum | AD | 5.60e-03 | 3.96e-01 | -0.1954 |
| 25963 | TMEM87A | HTA11_866_3004761011 | Human | Colorectum | AD | 3.19e-03 | -3.81e-01 | 0.096 |
| 25963 | TMEM87A | HTA11_9408_2000001011 | Human | Colorectum | AD | 1.69e-02 | -7.37e-01 | 0.0451 |
| 25963 | TMEM87A | HTA11_99999965062_69753 | Human | Colorectum | MSI-H | 1.14e-06 | 8.06e-01 | 0.3487 |
| 25963 | TMEM87A | HTA11_99999965104_69814 | Human | Colorectum | MSS | 2.73e-03 | 5.43e-01 | 0.281 |
| 25963 | TMEM87A | HTA11_99999971662_82457 | Human | Colorectum | MSS | 1.62e-02 | -3.80e-01 | 0.3859 |
| 25963 | TMEM87A | HTA11_99999973899_84307 | Human | Colorectum | MSS | 1.10e-02 | -4.79e-01 | 0.2585 |
| 25963 | TMEM87A | HTA11_99999974143_84620 | Human | Colorectum | MSS | 1.24e-09 | -5.41e-01 | 0.3005 |
| 25963 | TMEM87A | F007 | Human | Colorectum | FAP | 3.37e-12 | -6.64e-01 | 0.1176 |
| 25963 | TMEM87A | A002-C-010 | Human | Colorectum | FAP | 3.08e-02 | -1.34e-01 | 0.242 |
| 25963 | TMEM87A | A001-C-207 | Human | Colorectum | FAP | 5.79e-06 | -3.24e-01 | 0.1278 |
| 25963 | TMEM87A | A015-C-203 | Human | Colorectum | FAP | 2.12e-34 | -4.03e-01 | -0.1294 |
| 25963 | TMEM87A | A015-C-204 | Human | Colorectum | FAP | 5.02e-08 | -2.72e-01 | -0.0228 |
| 25963 | TMEM87A | A014-C-040 | Human | Colorectum | FAP | 7.32e-07 | -2.58e-01 | -0.1184 |
| 25963 | TMEM87A | A002-C-201 | Human | Colorectum | FAP | 1.53e-15 | -2.69e-01 | 0.0324 |
| Page: 1 2 3 4 5 6 7 8 9 10 |
| Tissue | Expression Dynamics | Abbreviation |
| Cervix |  | CC: Cervix cancer |
| HSIL_HPV: HPV-infected high-grade squamous intraepithelial lesions | ||
| N_HPV: HPV-infected normal cervix | ||
| Colorectum (GSE201348) |  | FAP: Familial adenomatous polyposis |
| CRC: Colorectal cancer | ||
| Colorectum (HTA11) |  | AD: Adenomas |
| SER: Sessile serrated lesions | ||
| MSI-H: Microsatellite-high colorectal cancer | ||
| MSS: Microsatellite stable colorectal cancer | ||
| Esophagus | 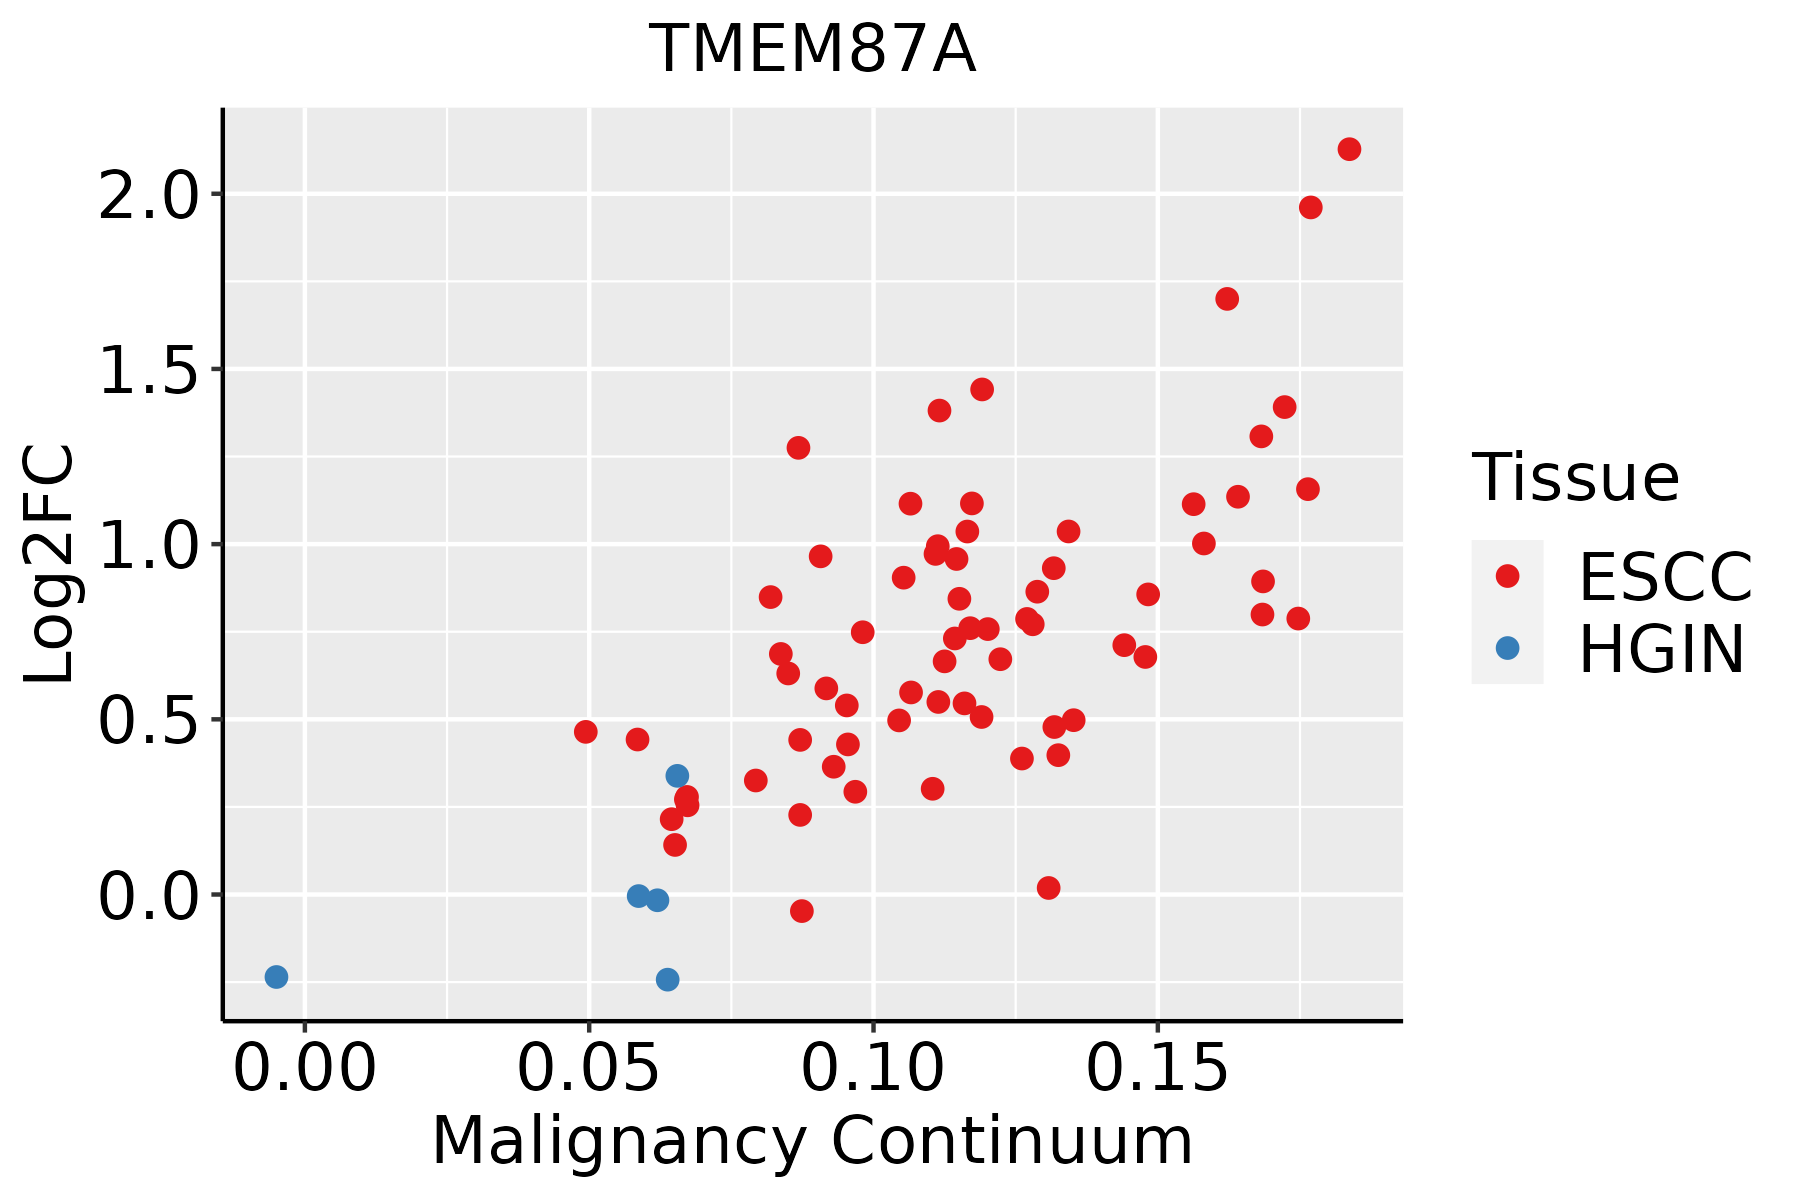 | ESCC: Esophageal squamous cell carcinoma |
| HGIN: High-grade intraepithelial neoplasias | ||
| LGIN: Low-grade intraepithelial neoplasias | ||
| Liver | 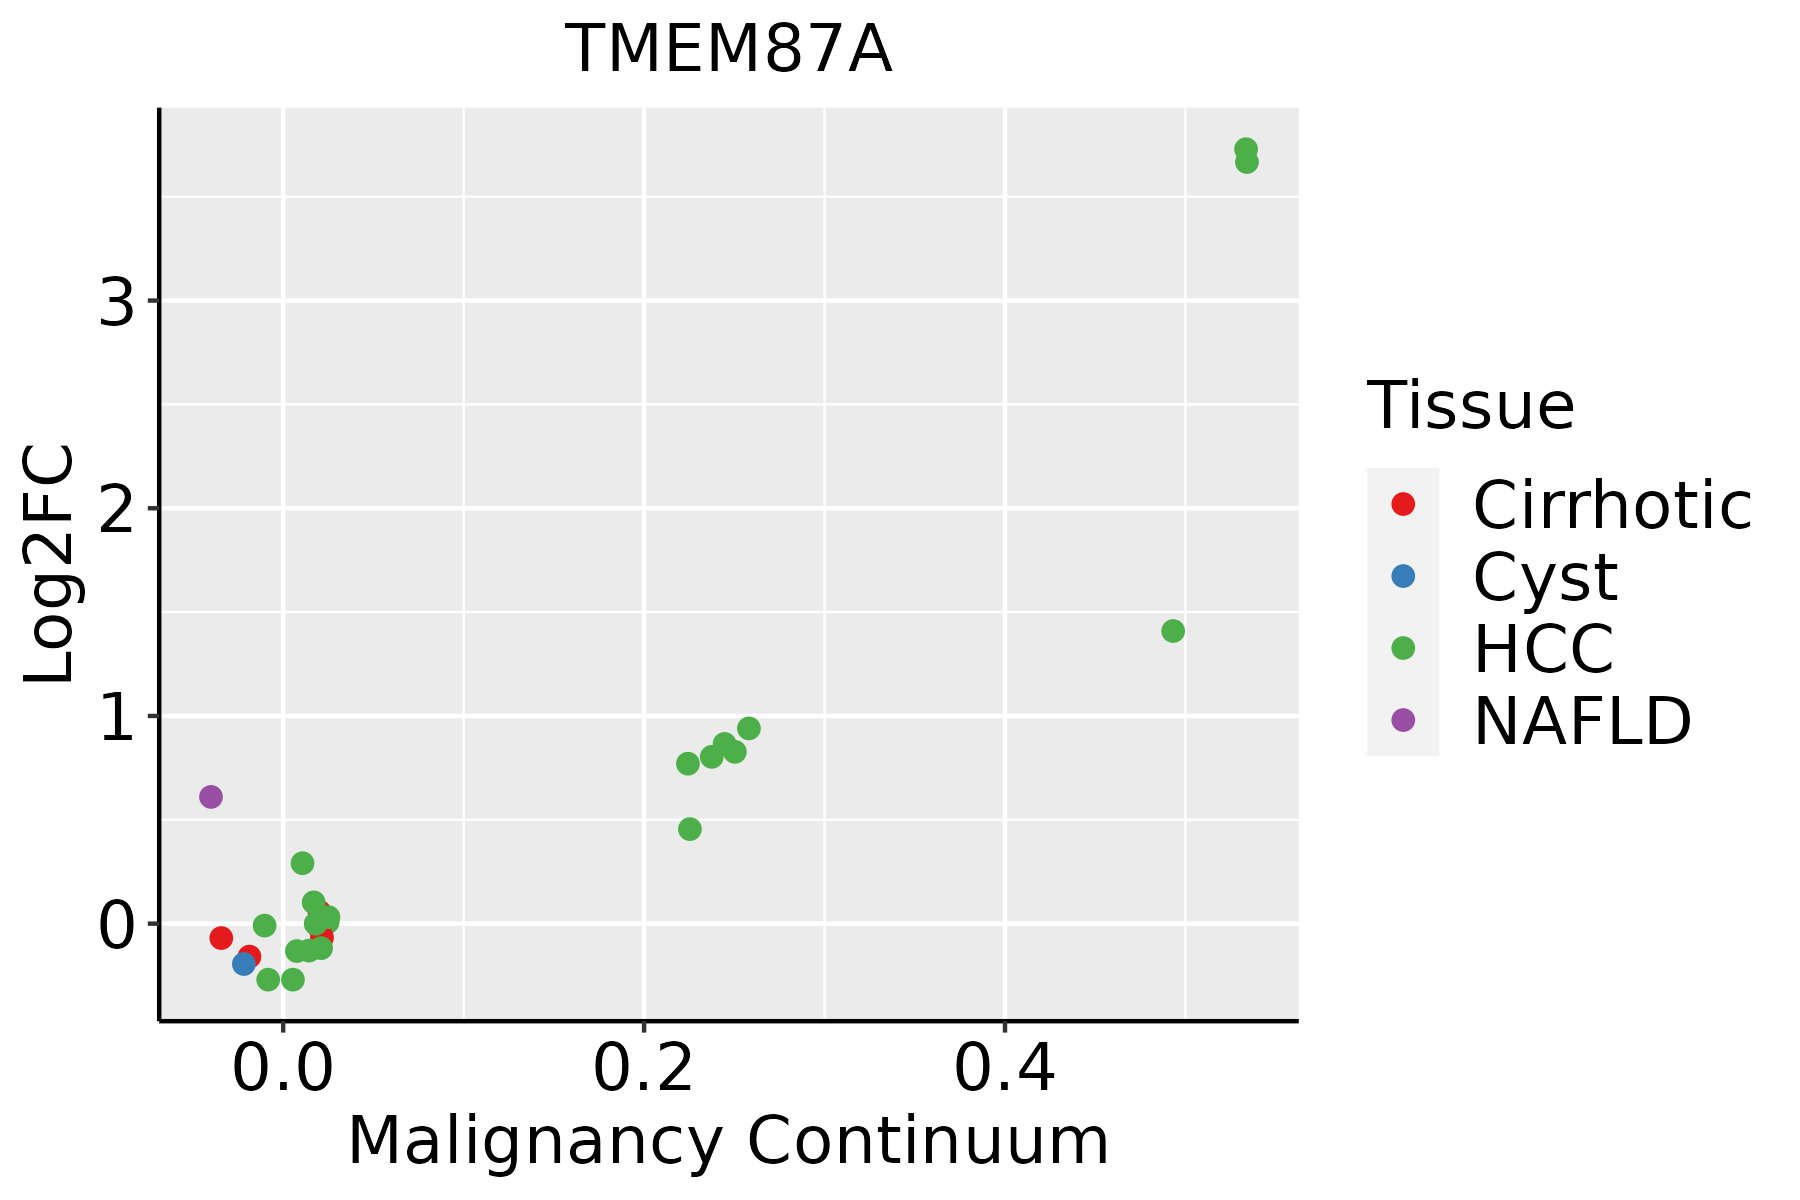 | HCC: Hepatocellular carcinoma |
| NAFLD: Non-alcoholic fatty liver disease | ||
| Lung |  | AAH: Atypical adenomatous hyperplasia |
| AIS: Adenocarcinoma in situ | ||
| IAC: Invasive lung adenocarcinoma | ||
| MIA: Minimally invasive adenocarcinoma | ||
| Oral Cavity | 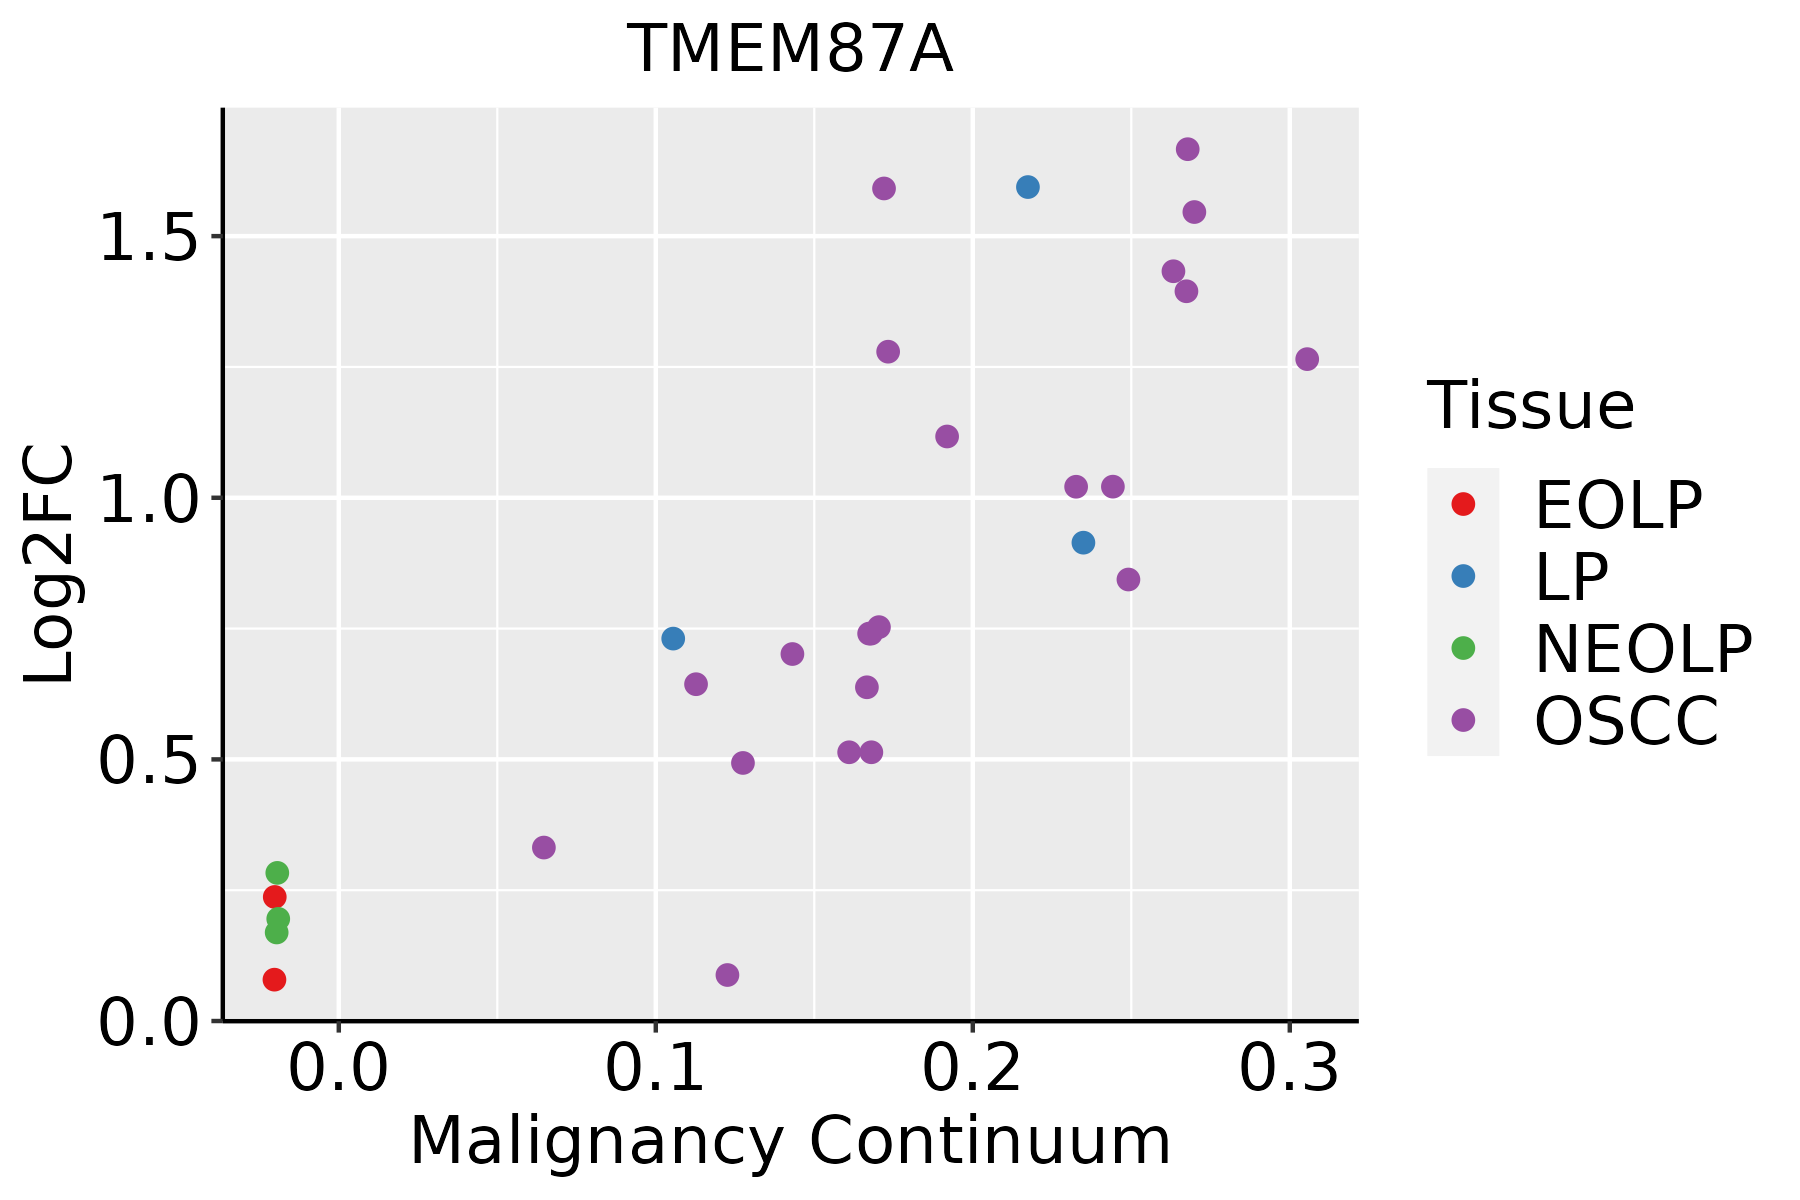 | EOLP: Erosive Oral lichen planus |
| LP: leukoplakia | ||
| NEOLP: Non-erosive oral lichen planus | ||
| OSCC: Oral squamous cell carcinoma | ||
| Prostate | 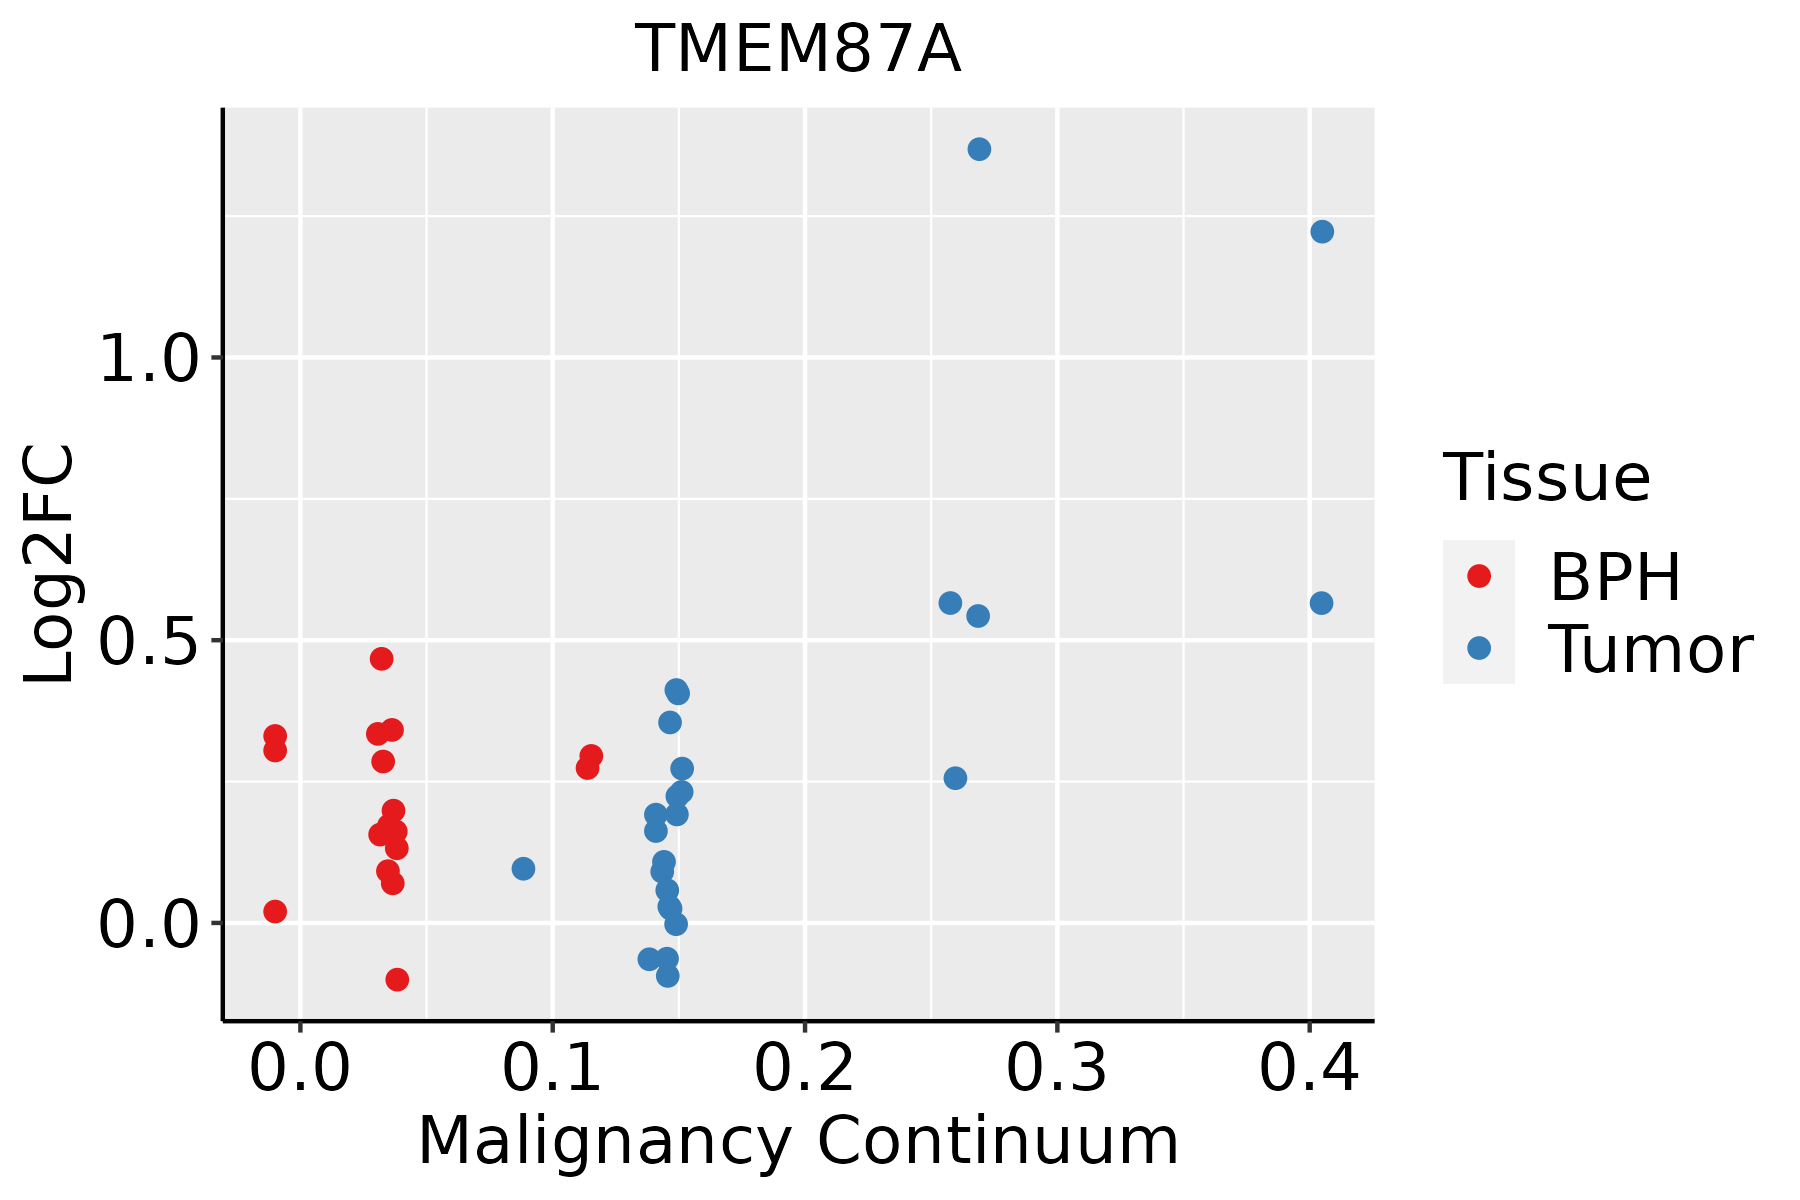 | BPH: Benign Prostatic Hyperplasia |
| Skin |  | AK: Actinic keratosis |
| cSCC: Cutaneous squamous cell carcinoma | ||
| SCCIS:squamous cell carcinoma in situ | ||
| Thyroid |  | ATC: Anaplastic thyroid cancer |
| HT: Hashimoto's thyroiditis | ||
| PTC: Papillary thyroid cancer |
| ∗log2FC in expression of this searched gene in stem-like cells from each diseased tissue sample relative to stem-like cells in normal samples in each tissue plotted against the malignancy continuum. Samples are colored based on if they are from different disease stage. |
Top |
Malignant transformation related pathway analysis |
| Find out the enriched GO biological processes and KEGG pathways involved in transition from healthy to precancer to cancer |
| Tissue | Disease Stage | Enriched GO biological Processes |
| Colorectum | AD |  |
| Colorectum | SER |  |
| Colorectum | MSS |  |
| Colorectum | MSI-H |  |
| Colorectum | FAP |  |
| ∗Top 15 enriched GO BP terms are showed in the bar plot of each disease state in each tissue. Each row represents a significant GO biological process which is colored according to the -log10(p.adjust). |
| Page: 1 2 3 4 5 6 7 8 9 |
| GO ID | Tissue | Disease Stage | Description | Gene Ratio | Bg Ratio | pvalue | p.adjust | Count |
| GO:001648213 | Prostate | Tumor | cytosolic transport | 54/3246 | 168/18723 | 2.01e-06 | 3.46e-05 | 54 |
| GO:001619713 | Prostate | Tumor | endosomal transport | 62/3246 | 230/18723 | 1.65e-04 | 1.47e-03 | 62 |
| GO:004214712 | Prostate | Tumor | retrograde transport, endosome to Golgi | 25/3246 | 91/18723 | 1.05e-02 | 4.38e-02 | 25 |
| GO:001648215 | Skin | AK | cytosolic transport | 36/1910 | 168/18723 | 1.26e-05 | 2.56e-04 | 36 |
| GO:001619716 | Skin | AK | endosomal transport | 41/1910 | 230/18723 | 2.76e-04 | 2.93e-03 | 41 |
| GO:00421478 | Skin | AK | retrograde transport, endosome to Golgi | 19/1910 | 91/18723 | 1.84e-03 | 1.27e-02 | 19 |
| GO:001619717 | Skin | cSCC | endosomal transport | 98/4864 | 230/18723 | 2.71e-08 | 7.41e-07 | 98 |
| GO:001648216 | Skin | cSCC | cytosolic transport | 71/4864 | 168/18723 | 3.02e-06 | 4.72e-05 | 71 |
| GO:004214714 | Skin | cSCC | retrograde transport, endosome to Golgi | 40/4864 | 91/18723 | 1.49e-04 | 1.33e-03 | 40 |
| GO:001619718 | Thyroid | PTC | endosomal transport | 128/5968 | 230/18723 | 6.26e-14 | 3.52e-12 | 128 |
| GO:001648217 | Thyroid | PTC | cytosolic transport | 92/5968 | 168/18723 | 6.41e-10 | 1.97e-08 | 92 |
| GO:00421479 | Thyroid | PTC | retrograde transport, endosome to Golgi | 48/5968 | 91/18723 | 2.86e-05 | 2.78e-04 | 48 |
| GO:001619719 | Thyroid | ATC | endosomal transport | 128/6293 | 230/18723 | 4.44e-12 | 1.75e-10 | 128 |
| GO:001648218 | Thyroid | ATC | cytosolic transport | 93/6293 | 168/18723 | 5.19e-09 | 1.15e-07 | 93 |
| GO:004214715 | Thyroid | ATC | retrograde transport, endosome to Golgi | 49/6293 | 91/18723 | 5.48e-05 | 4.23e-04 | 49 |
| Page: 1 2 3 |
| Pathway ID | Tissue | Disease Stage | Description | Gene Ratio | Bg Ratio | pvalue | p.adjust | qvalue | Count |
| Page: 1 |
Top |
Cell-cell communication analysis |
| Identification of potential cell-cell interactions between two cell types and their ligand-receptor pairs for different disease states |
| Ligand | Receptor | LRpair | Pathway | Tissue | Disease Stage |
| Page: 1 |
Top |
Single-cell gene regulatory network inference analysis |
| Find out the significant the regulons (TFs) and the target genes of each regulon across cell types for different disease states |
| TF | Cell Type | Tissue | Disease Stage | Target Gene | RSS | Regulon Activity |
| ∗The dot plots of a searched regulon are shown for all cell subpopulations in each disease state of each tissue based on the regulon specific score inferred using pySCENIC and by calculating the average expression. |
| Page: 1 |
Top |
Somatic mutation of malignant transformation related genes |
| Annotation of somatic variants for genes involved in malignant transformation |
| Hugo Symbol | Variant Class | Variant Classification | dbSNP RS | HGVSc | HGVSp | HGVSp Short | SWISSPROT | BIOTYPE | SIFT | PolyPhen | Tumor Sample Barcode | Tissue | Histology | Sex | Age | Stage | Therapy Types | Drugs | Outcome |
| TMEM87A | SNV | Missense_Mutation | c.681N>A | p.Met227Ile | p.M227I | Q8NBN3 | protein_coding | deleterious(0) | probably_damaging(0.992) | TCGA-A2-A25B-01 | Breast | breast invasive carcinoma | Female | <65 | I/II | Chemotherapy | taxotere | PD | |
| TMEM87A | SNV | Missense_Mutation | c.842A>G | p.Gln281Arg | p.Q281R | Q8NBN3 | protein_coding | deleterious(0) | probably_damaging(0.996) | TCGA-E2-A15P-01 | Breast | breast invasive carcinoma | Female | <65 | I/II | Hormone Therapy | arimidex | SD | |
| TMEM87A | SNV | Missense_Mutation | novel | c.188C>T | p.Thr63Ile | p.T63I | Q8NBN3 | protein_coding | deleterious(0) | possibly_damaging(0.69) | TCGA-OL-A5S0-01 | Breast | breast invasive carcinoma | Female | >=65 | I/II | Chemotherapy | taxol | CR |
| TMEM87A | insertion | Nonsense_Mutation | novel | c.1336_1337insCTTAGTTTCCTTTCTATATACTGAGGGGGAATTAAACCCAG | p.Arg446ProfsTer2 | p.R446Pfs*2 | Q8NBN3 | protein_coding | TCGA-A8-A0A6-01 | Breast | breast invasive carcinoma | Female | <65 | III/IV | Chemotherapy | epirubicin | CR | ||
| TMEM87A | SNV | Missense_Mutation | rs773068113 | c.413C>T | p.Ser138Phe | p.S138F | Q8NBN3 | protein_coding | tolerated(0.66) | benign(0.023) | TCGA-C5-A1BQ-01 | Cervix | cervical & endocervical cancer | Female | >=65 | III/IV | Chemotherapy | cisplatin | CR |
| TMEM87A | SNV | Missense_Mutation | c.298G>A | p.Glu100Lys | p.E100K | Q8NBN3 | protein_coding | tolerated(0.57) | benign(0.001) | TCGA-FU-A2QG-01 | Cervix | cervical & endocervical cancer | Female | <65 | I/II | Unknown | Unknown | SD | |
| TMEM87A | SNV | Missense_Mutation | novel | c.1468G>C | p.Glu490Gln | p.E490Q | Q8NBN3 | protein_coding | deleterious(0.01) | probably_damaging(0.941) | TCGA-VS-A94X-01 | Cervix | cervical & endocervical cancer | Female | <65 | I/II | Chemotherapy | cisplatin | PD |
| TMEM87A | SNV | Missense_Mutation | c.1456C>T | p.Pro486Ser | p.P486S | Q8NBN3 | protein_coding | tolerated(0.45) | possibly_damaging(0.895) | TCGA-AZ-6598-01 | Colorectum | colon adenocarcinoma | Female | >=65 | I/II | Unknown | Unknown | SD | |
| TMEM87A | SNV | Missense_Mutation | novel | c.40N>A | p.Leu14Ile | p.L14I | Q8NBN3 | protein_coding | tolerated(0.11) | benign(0.017) | TCGA-CA-6717-01 | Colorectum | colon adenocarcinoma | Male | <65 | I/II | Chemotherapy | oxaliplatin | CR |
| TMEM87A | SNV | Missense_Mutation | rs749148379 | c.913N>T | p.Arg305Cys | p.R305C | Q8NBN3 | protein_coding | deleterious(0) | probably_damaging(0.999) | TCGA-G4-6588-01 | Colorectum | colon adenocarcinoma | Female | <65 | I/II | Unknown | Unknown | SD |
| Page: 1 2 3 4 |
Top |
Related drugs of malignant transformation related genes |
| Identification of chemicals and drugs interact with genes involved in malignant transfromation |
| (DGIdb 4.0) |
| Entrez ID | Symbol | Category | Interaction Types | Drug Claim Name | Drug Name | PMIDs |
| Page: 1 |

Copyright 2023-Present -The University of Texas Health Science Center at Houston |