
|
|||||
|
 | |
| |
| |
| |
| |
| |
|
Gene: TMEM161A |
Gene summary for TMEM161A |
| Gene information | Species | Human | Gene symbol | TMEM161A | Gene ID | 54929 |
| Gene name | transmembrane protein 161A | |
| Gene Alias | AROS-29 | |
| Cytomap | 19p13.11 | |
| Gene Type | protein-coding | GO ID | GO:0006139 | UniProtAcc | Q9NX61 |
Top |
Malignant transformation analysis |
| Identification of the aberrant gene expression in precancerous and cancerous lesions by comparing the gene expression of stem-like cells in diseased tissues with normal stem cells |
| Entrez ID | Symbol | Replicates | Species | Organ | Tissue | Adj P-value | Log2FC | Malignancy |
| 54929 | TMEM161A | LZE3D | Human | Esophagus | HGIN | 4.93e-02 | 4.25e-01 | 0.0668 |
| 54929 | TMEM161A | LZE4T | Human | Esophagus | ESCC | 7.74e-09 | 2.38e-01 | 0.0811 |
| 54929 | TMEM161A | LZE7T | Human | Esophagus | ESCC | 5.55e-09 | 5.03e-01 | 0.0667 |
| 54929 | TMEM161A | LZE8T | Human | Esophagus | ESCC | 2.25e-03 | 1.40e-01 | 0.067 |
| 54929 | TMEM161A | LZE20T | Human | Esophagus | ESCC | 1.62e-07 | 1.15e-01 | 0.0662 |
| 54929 | TMEM161A | LZE22T | Human | Esophagus | ESCC | 4.04e-03 | 1.62e-01 | 0.068 |
| 54929 | TMEM161A | LZE24T | Human | Esophagus | ESCC | 9.74e-20 | 4.46e-01 | 0.0596 |
| 54929 | TMEM161A | LZE21T | Human | Esophagus | ESCC | 1.91e-02 | 4.29e-01 | 0.0655 |
| 54929 | TMEM161A | P1T-E | Human | Esophagus | ESCC | 4.21e-08 | 4.34e-01 | 0.0875 |
| 54929 | TMEM161A | P2T-E | Human | Esophagus | ESCC | 3.81e-16 | 2.26e-01 | 0.1177 |
| 54929 | TMEM161A | P4T-E | Human | Esophagus | ESCC | 1.76e-20 | 5.39e-01 | 0.1323 |
| 54929 | TMEM161A | P5T-E | Human | Esophagus | ESCC | 7.57e-15 | 2.45e-01 | 0.1327 |
| 54929 | TMEM161A | P8T-E | Human | Esophagus | ESCC | 5.59e-20 | 3.49e-01 | 0.0889 |
| 54929 | TMEM161A | P9T-E | Human | Esophagus | ESCC | 7.38e-16 | 3.64e-01 | 0.1131 |
| 54929 | TMEM161A | P10T-E | Human | Esophagus | ESCC | 3.54e-32 | 5.33e-01 | 0.116 |
| 54929 | TMEM161A | P11T-E | Human | Esophagus | ESCC | 3.93e-17 | 5.13e-01 | 0.1426 |
| 54929 | TMEM161A | P12T-E | Human | Esophagus | ESCC | 5.02e-36 | 6.38e-01 | 0.1122 |
| 54929 | TMEM161A | P15T-E | Human | Esophagus | ESCC | 1.85e-24 | 4.70e-01 | 0.1149 |
| 54929 | TMEM161A | P16T-E | Human | Esophagus | ESCC | 2.67e-21 | 4.16e-01 | 0.1153 |
| 54929 | TMEM161A | P17T-E | Human | Esophagus | ESCC | 1.33e-16 | 4.87e-01 | 0.1278 |
| Page: 1 2 3 4 5 6 |
| Tissue | Expression Dynamics | Abbreviation |
| Esophagus | 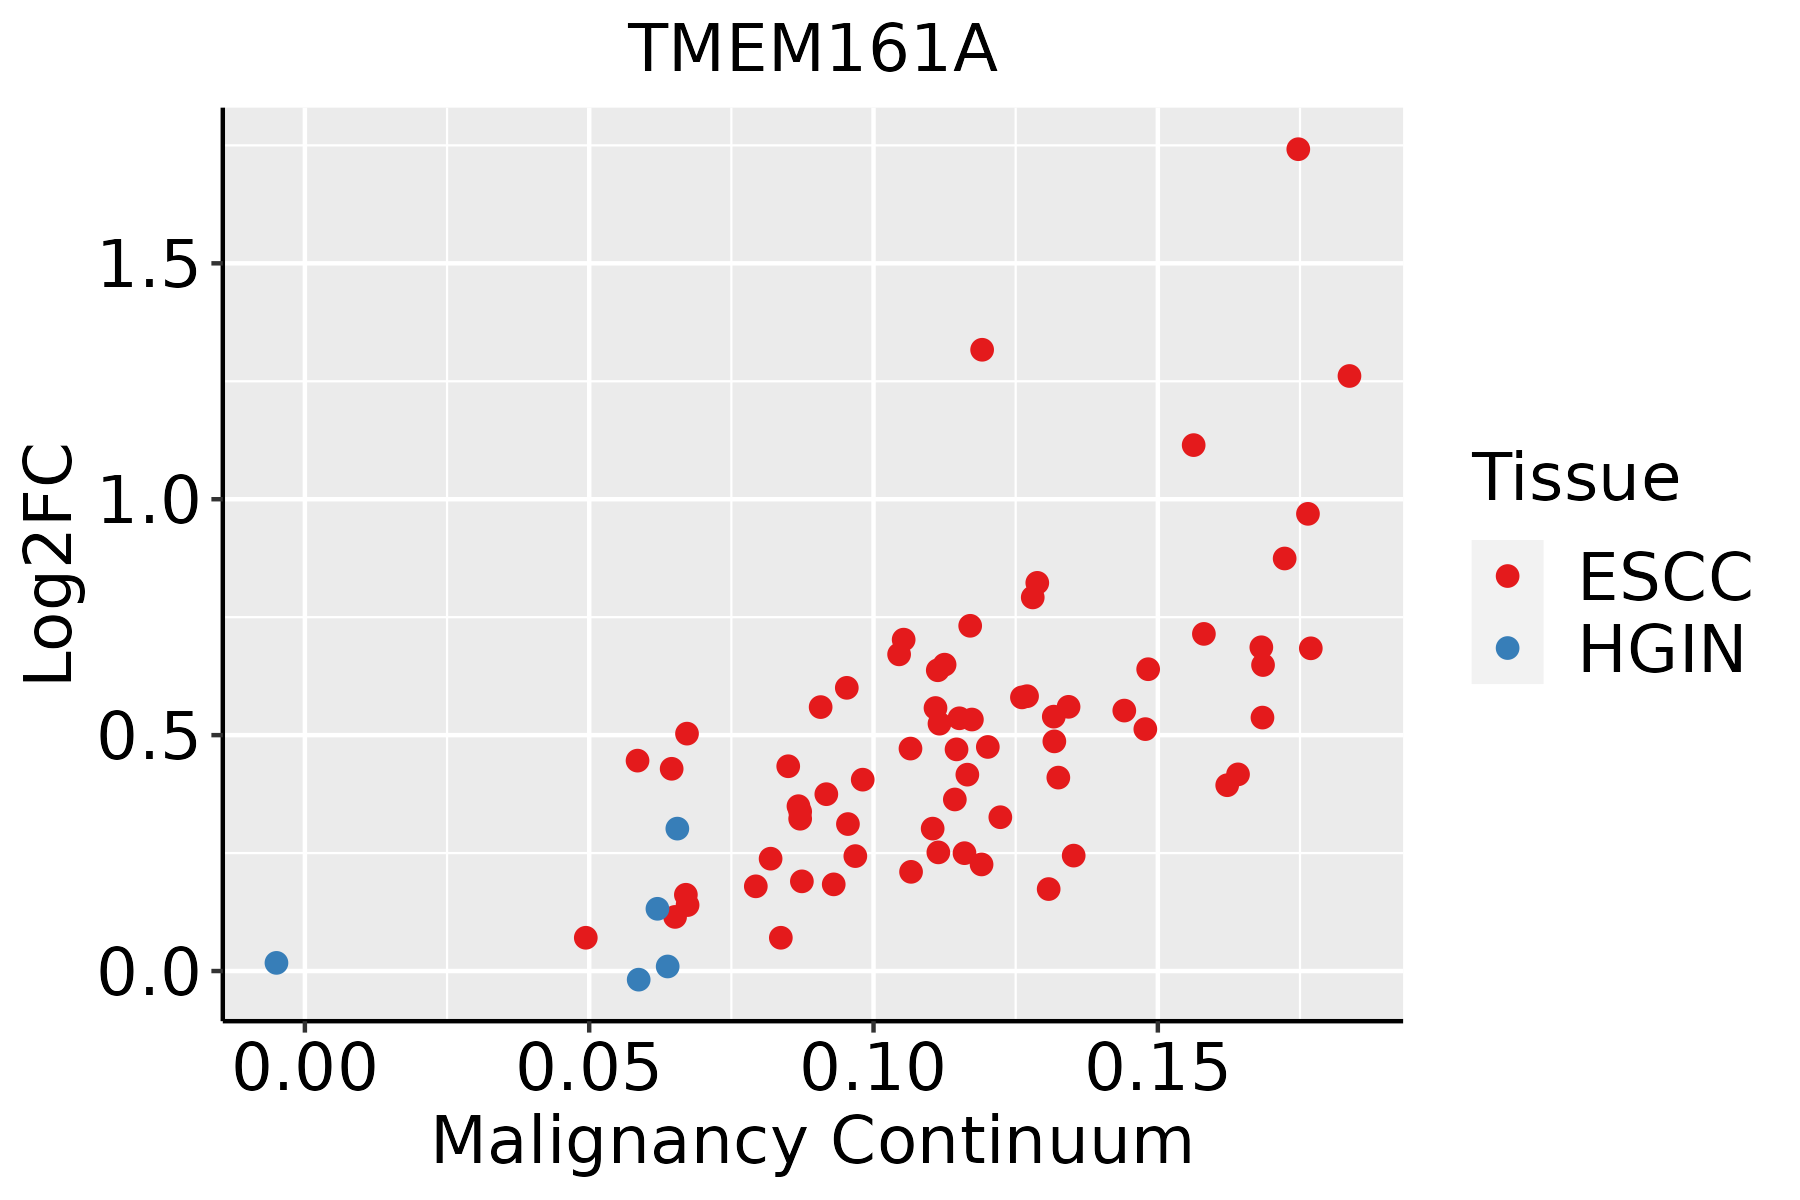 | ESCC: Esophageal squamous cell carcinoma |
| HGIN: High-grade intraepithelial neoplasias | ||
| LGIN: Low-grade intraepithelial neoplasias | ||
| Liver | 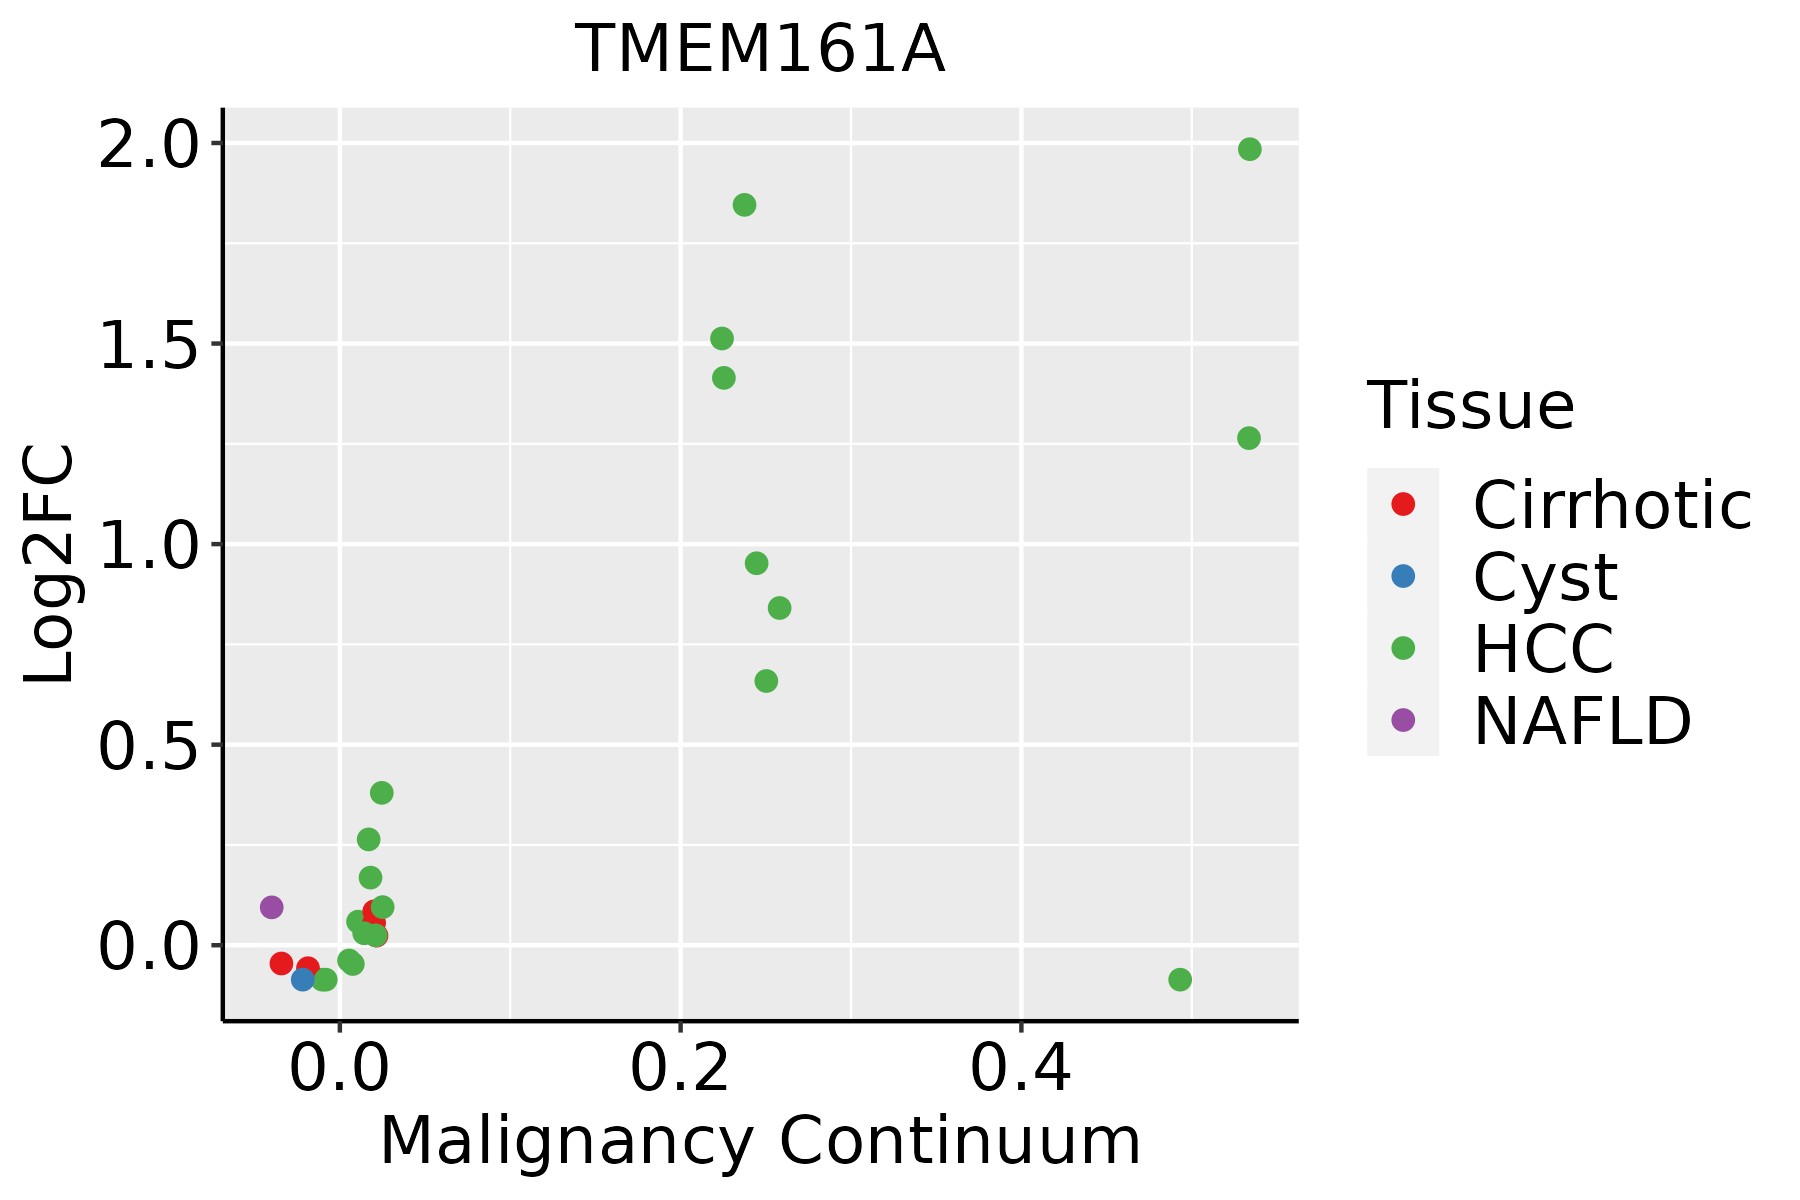 | HCC: Hepatocellular carcinoma |
| NAFLD: Non-alcoholic fatty liver disease | ||
| Oral Cavity | 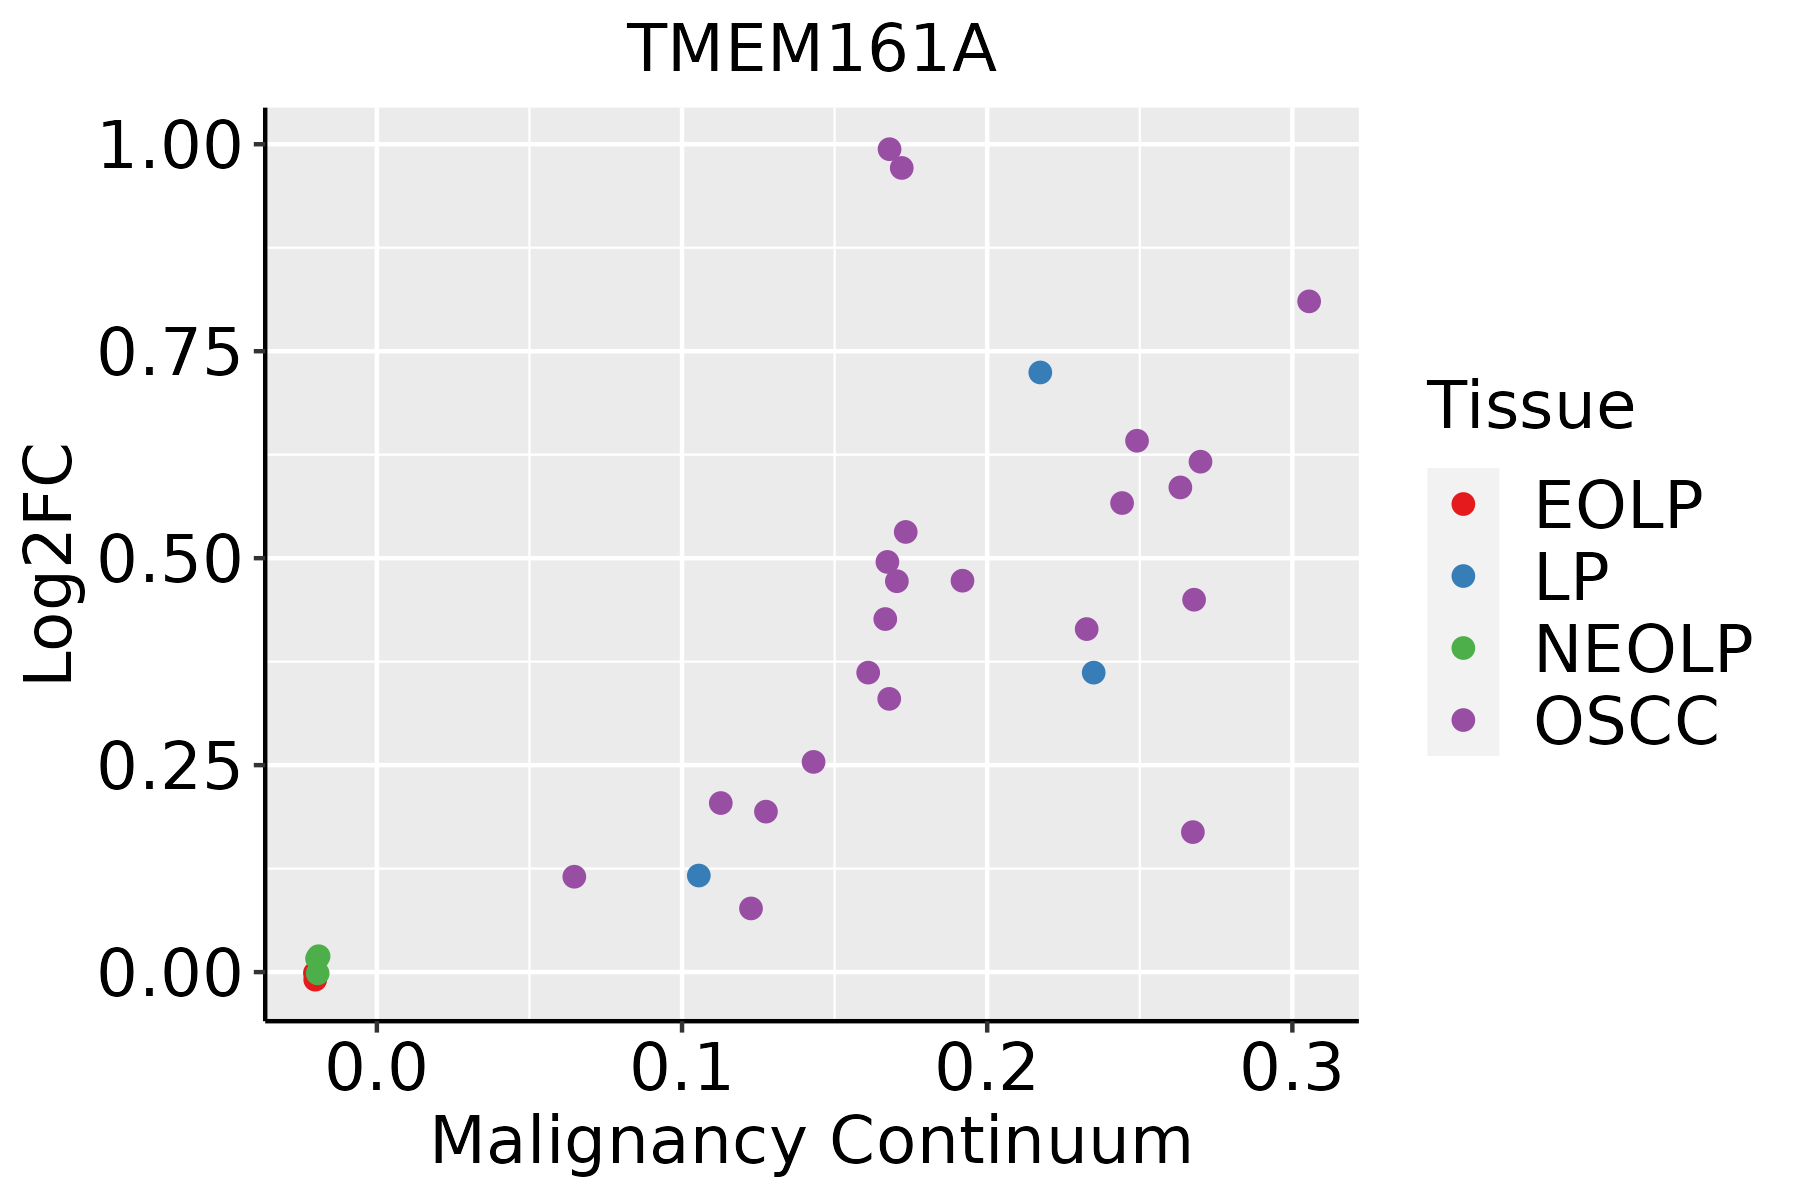 | EOLP: Erosive Oral lichen planus |
| LP: leukoplakia | ||
| NEOLP: Non-erosive oral lichen planus | ||
| OSCC: Oral squamous cell carcinoma | ||
| Thyroid | 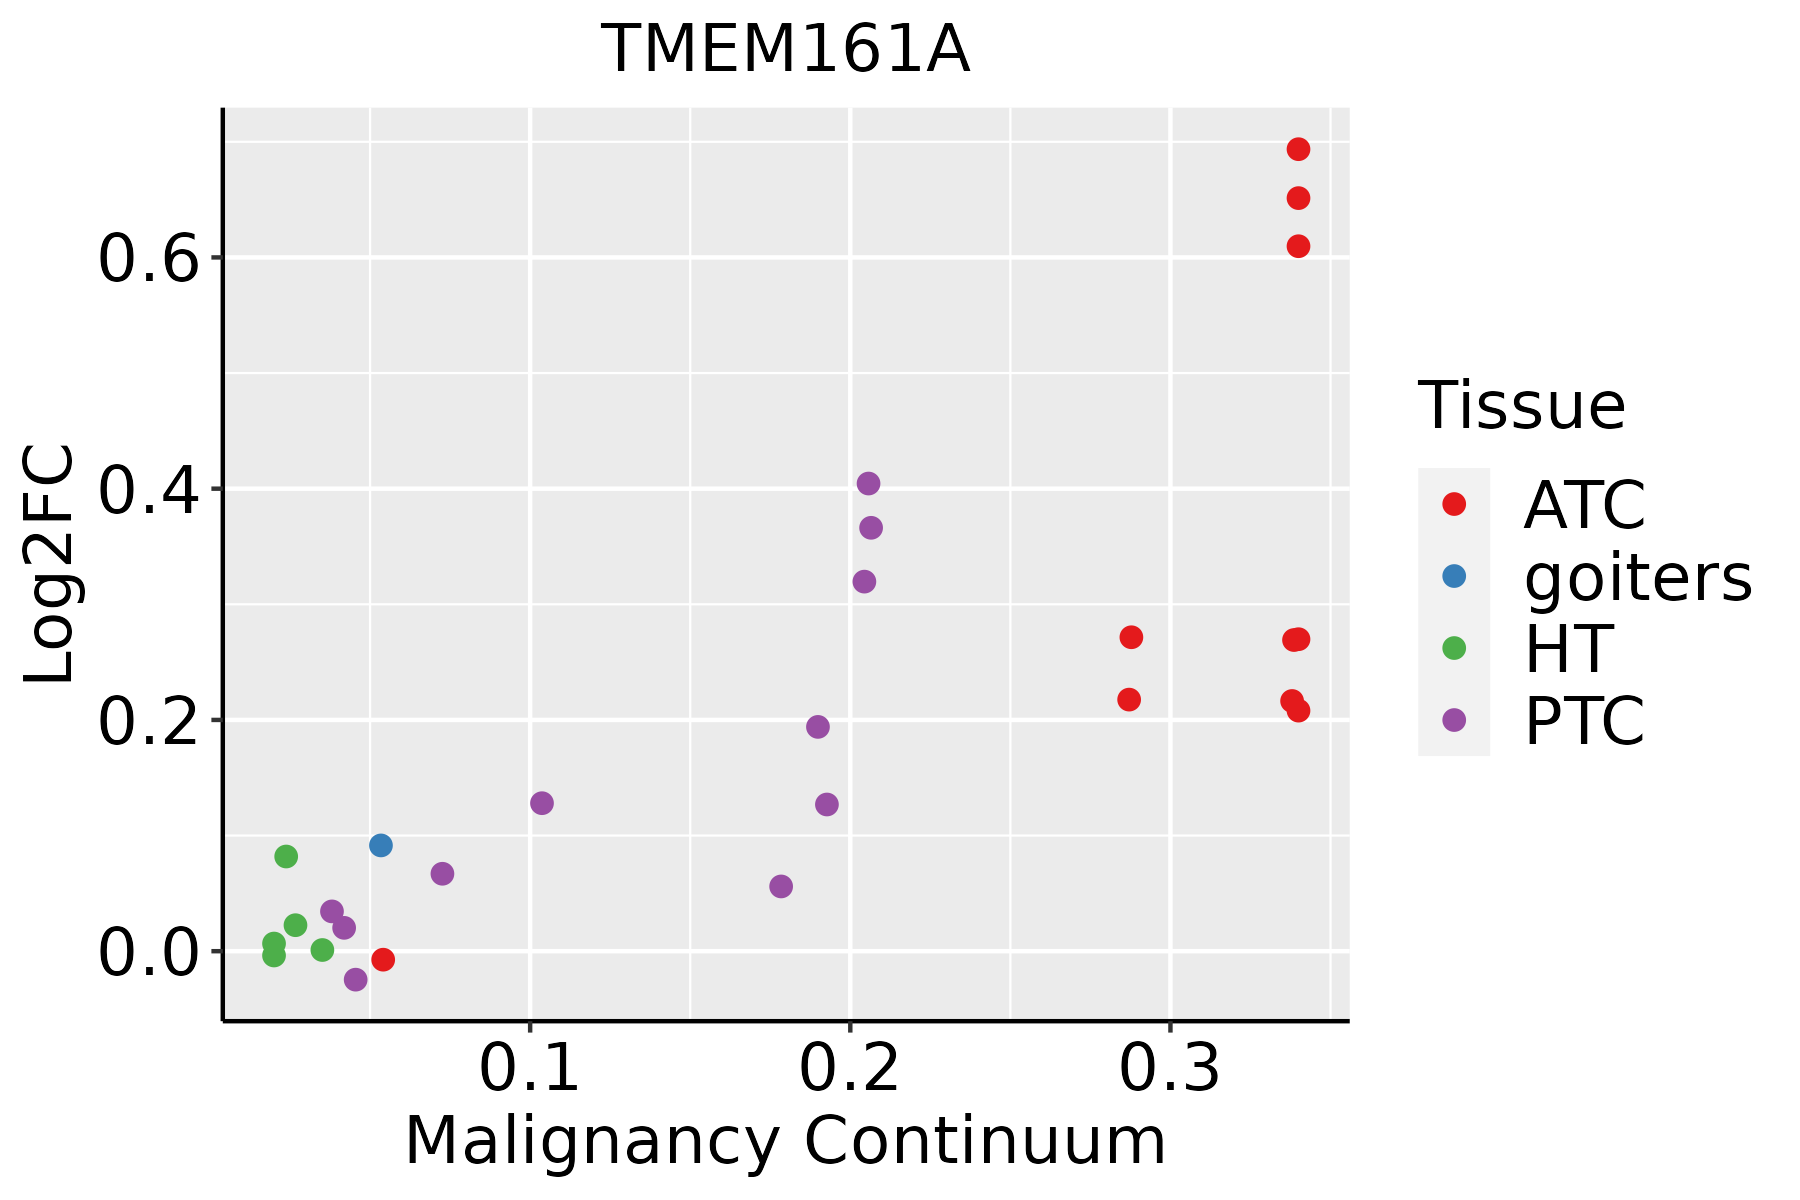 | ATC: Anaplastic thyroid cancer |
| HT: Hashimoto's thyroiditis | ||
| PTC: Papillary thyroid cancer |
| ∗log2FC in expression of this searched gene in stem-like cells from each diseased tissue sample relative to stem-like cells in normal samples in each tissue plotted against the malignancy continuum. Samples are colored based on if they are from different disease stage. |
Top |
Malignant transformation related pathway analysis |
| Find out the enriched GO biological processes and KEGG pathways involved in transition from healthy to precancer to cancer |
| Tissue | Disease Stage | Enriched GO biological Processes |
| Colorectum | AD |  |
| Colorectum | SER |  |
| Colorectum | MSS |  |
| Colorectum | MSI-H |  |
| Colorectum | FAP |  |
| ∗Top 15 enriched GO BP terms are showed in the bar plot of each disease state in each tissue. Each row represents a significant GO biological process which is colored according to the -log10(p.adjust). |
| Page: 1 2 3 4 5 6 7 8 9 |
| GO ID | Tissue | Disease Stage | Description | Gene Ratio | Bg Ratio | pvalue | p.adjust | Count |
| GO:200102211 | Liver | HCC | positive regulation of response to DNA damage stimulus | 64/7958 | 105/18723 | 1.03e-04 | 8.88e-04 | 64 |
| GO:00346441 | Liver | HCC | cellular response to UV | 56/7958 | 90/18723 | 1.25e-04 | 1.03e-03 | 56 |
| GO:00714782 | Liver | HCC | cellular response to radiation | 104/7958 | 186/18723 | 1.48e-04 | 1.19e-03 | 104 |
| GO:0009411 | Liver | HCC | response to UV | 85/7958 | 149/18723 | 2.34e-04 | 1.77e-03 | 85 |
| GO:00062824 | Liver | HCC | regulation of DNA repair | 74/7958 | 130/18723 | 6.27e-04 | 3.89e-03 | 74 |
| GO:000863011 | Liver | HCC | intrinsic apoptotic signaling pathway in response to DNA damage | 58/7958 | 99/18723 | 8.97e-04 | 5.29e-03 | 58 |
| GO:00093146 | Liver | HCC | response to radiation | 223/7958 | 456/18723 | 3.08e-03 | 1.43e-02 | 223 |
| GO:00457393 | Liver | HCC | positive regulation of DNA repair | 43/7958 | 73/18723 | 3.43e-03 | 1.55e-02 | 43 |
| GO:200123320 | Oral cavity | OSCC | regulation of apoptotic signaling pathway | 242/7305 | 356/18723 | 6.66e-29 | 3.24e-26 | 242 |
| GO:009719320 | Oral cavity | OSCC | intrinsic apoptotic signaling pathway | 202/7305 | 288/18723 | 4.64e-27 | 1.73e-24 | 202 |
| GO:000697920 | Oral cavity | OSCC | response to oxidative stress | 273/7305 | 446/18723 | 8.35e-22 | 1.65e-19 | 273 |
| GO:200124220 | Oral cavity | OSCC | regulation of intrinsic apoptotic signaling pathway | 123/7305 | 164/18723 | 5.71e-21 | 9.77e-19 | 123 |
| GO:200123420 | Oral cavity | OSCC | negative regulation of apoptotic signaling pathway | 148/7305 | 224/18723 | 1.71e-16 | 1.36e-14 | 148 |
| GO:006219720 | Oral cavity | OSCC | cellular response to chemical stress | 204/7305 | 337/18723 | 6.89e-16 | 5.19e-14 | 204 |
| GO:003459920 | Oral cavity | OSCC | cellular response to oxidative stress | 173/7305 | 288/18723 | 2.90e-13 | 1.43e-11 | 173 |
| GO:005105210 | Oral cavity | OSCC | regulation of DNA metabolic process | 207/7305 | 359/18723 | 4.45e-13 | 2.17e-11 | 207 |
| GO:200124320 | Oral cavity | OSCC | negative regulation of intrinsic apoptotic signaling pathway | 73/7305 | 98/18723 | 9.33e-13 | 4.22e-11 | 73 |
| GO:005105414 | Oral cavity | OSCC | positive regulation of DNA metabolic process | 126/7305 | 201/18723 | 8.12e-12 | 3.01e-10 | 126 |
| GO:000863018 | Oral cavity | OSCC | intrinsic apoptotic signaling pathway in response to DNA damage | 72/7305 | 99/18723 | 9.50e-12 | 3.50e-10 | 72 |
| GO:00094114 | Oral cavity | OSCC | response to UV | 99/7305 | 149/18723 | 1.01e-11 | 3.70e-10 | 99 |
| Page: 1 2 3 4 5 6 7 8 |
| Pathway ID | Tissue | Disease Stage | Description | Gene Ratio | Bg Ratio | pvalue | p.adjust | qvalue | Count |
| Page: 1 |
Top |
Cell-cell communication analysis |
| Identification of potential cell-cell interactions between two cell types and their ligand-receptor pairs for different disease states |
| Ligand | Receptor | LRpair | Pathway | Tissue | Disease Stage |
| Page: 1 |
Top |
Single-cell gene regulatory network inference analysis |
| Find out the significant the regulons (TFs) and the target genes of each regulon across cell types for different disease states |
| TF | Cell Type | Tissue | Disease Stage | Target Gene | RSS | Regulon Activity |
| ∗The dot plots of a searched regulon are shown for all cell subpopulations in each disease state of each tissue based on the regulon specific score inferred using pySCENIC and by calculating the average expression. |
| Page: 1 |
Top |
Somatic mutation of malignant transformation related genes |
| Annotation of somatic variants for genes involved in malignant transformation |
| Hugo Symbol | Variant Class | Variant Classification | dbSNP RS | HGVSc | HGVSp | HGVSp Short | SWISSPROT | BIOTYPE | SIFT | PolyPhen | Tumor Sample Barcode | Tissue | Histology | Sex | Age | Stage | Therapy Types | Drugs | Outcome |
| TMEM161A | SNV | Missense_Mutation | c.570N>T | p.Glu190Asp | p.E190D | Q9NX61 | protein_coding | tolerated(1) | benign(0.005) | TCGA-A2-A0ET-01 | Breast | breast invasive carcinoma | Female | <65 | III/IV | Chemotherapy | cytoxan | SD | |
| TMEM161A | SNV | Missense_Mutation | c.1312N>G | p.Leu438Val | p.L438V | Q9NX61 | protein_coding | deleterious(0.04) | possibly_damaging(0.836) | TCGA-AC-A23H-01 | Breast | breast invasive carcinoma | Female | >=65 | I/II | Unknown | Unknown | PD | |
| TMEM161A | SNV | Missense_Mutation | rs530025077 | c.577N>A | p.Glu193Lys | p.E193K | Q9NX61 | protein_coding | deleterious(0.04) | probably_damaging(0.995) | TCGA-AN-A046-01 | Breast | breast invasive carcinoma | Female | >=65 | I/II | Unknown | Unknown | SD |
| TMEM161A | SNV | Missense_Mutation | rs72993472 | c.682C>T | p.Arg228Cys | p.R228C | Q9NX61 | protein_coding | deleterious(0.01) | probably_damaging(0.947) | TCGA-BH-A5IZ-01 | Breast | breast invasive carcinoma | Female | <65 | I/II | Chemotherapy | adriamycin | CR |
| TMEM161A | SNV | Missense_Mutation | c.1030N>T | p.Arg344Trp | p.R344W | Q9NX61 | protein_coding | tolerated(0.07) | benign(0.003) | TCGA-A6-A567-01 | Colorectum | colon adenocarcinoma | Male | <65 | III/IV | Unknown | Unknown | PD | |
| TMEM161A | SNV | Missense_Mutation | rs549197484 | c.656N>T | p.Ala219Val | p.A219V | Q9NX61 | protein_coding | tolerated(0.13) | benign(0.005) | TCGA-AD-6964-01 | Colorectum | colon adenocarcinoma | Male | <65 | III/IV | Chemotherapy | folfox | PD |
| TMEM161A | SNV | Missense_Mutation | c.904C>T | p.Arg302Cys | p.R302C | Q9NX61 | protein_coding | deleterious(0.01) | benign(0.289) | TCGA-D5-6927-01 | Colorectum | colon adenocarcinoma | Male | <65 | I/II | Unknown | Unknown | SD | |
| TMEM161A | SNV | Missense_Mutation | rs372352382 | c.1249N>A | p.Ala417Thr | p.A417T | Q9NX61 | protein_coding | tolerated(0.52) | benign(0.001) | TCGA-NH-A5IV-01 | Colorectum | colon adenocarcinoma | Female | >=65 | I/II | Unknown | Unknown | SD |
| TMEM161A | SNV | Missense_Mutation | novel | c.610N>G | p.Thr204Ala | p.T204A | Q9NX61 | protein_coding | tolerated(0.09) | benign(0.081) | TCGA-AG-A014-01 | Colorectum | rectum adenocarcinoma | Male | >=65 | I/II | Unknown | Unknown | SD |
| TMEM161A | SNV | Missense_Mutation | rs772837226 | c.145C>T | p.Arg49Trp | p.R49W | Q9NX61 | protein_coding | deleterious(0.01) | probably_damaging(0.999) | TCGA-A5-A0G2-01 | Endometrium | uterine corpus endometrioid carcinoma | Female | <65 | III/IV | Unknown | Unknown | SD |
| Page: 1 2 3 4 5 |
Top |
Related drugs of malignant transformation related genes |
| Identification of chemicals and drugs interact with genes involved in malignant transfromation |
| (DGIdb 4.0) |
| Entrez ID | Symbol | Category | Interaction Types | Drug Claim Name | Drug Name | PMIDs |
| Page: 1 |

Copyright 2023-Present -The University of Texas Health Science Center at Houston |