Schematic overview of the cellular and molecular mechanisms involved in the cancer progression, including the proposed cellular and molecular mechanisms in cancer cells trajectory. AT1: alveolar type 1 cells; AT2: alveolar type 2 cells; AAH: atypical adenomatous hyperplasia; AIS: adenocarcinoma in situ; MIA: minimally invasive adenocarcinoma; IA: invasive adenocarcinoma; EMT: epithelial-mesenchymal transition

Home

Download

Statistics

Help

Contact

Center for Computational Systems Medicine
leaf

Gene summary

leaf

Malignant transformation analysis

leaf

Malignant transformation related pathway analysis

leaf

Cell-cell communication analysis

leaf

Single-cell gene regulatory network inference analysis

leaf

Somatic mutation of malignant transformation related genes

leaf

Related drugs of malignant transformation related genes

Gene: TLK2

Gene summary for TLK2

check button Gene summary.

Gene informationSpeciesHuman
Gene symbol

TLK2

Gene ID

11011

Gene nametousled like kinase 2
Gene AliasHsHPK
Cytomap17q23.2
Gene Typeprotein-coding
GO ID

GO:0001672

UniProtAcc

Q86UE8


Top

Malignant transformation analysis

check button Identification of the aberrant gene expression in precancerous and cancerous lesions by comparing the gene expression of stem-like cells in diseased tissues with normal stem cells
check button Malignant transformation involving gene list.
Entrez IDSymbolReplicatesSpeciesOrganTissueAdj P-valueLog2FCMalignancy
11011TLK2HTA11_3410_2000001011HumanColorectumAD3.18e-13-5.25e-010.0155
11011TLK2HTA11_866_3004761011HumanColorectumAD1.73e-06-4.26e-010.096
11011TLK2HTA11_8622_2000001021HumanColorectumSER4.43e-02-5.96e-010.0528
11011TLK2HTA11_7696_3000711011HumanColorectumAD7.67e-09-4.17e-010.0674
11011TLK2HTA11_6818_2000001021HumanColorectumAD8.39e-03-5.00e-010.0588
11011TLK2HTA11_99999970781_79442HumanColorectumMSS7.10e-12-4.87e-010.294
11011TLK2HTA11_99999965104_69814HumanColorectumMSS1.41e-117.63e-010.281
11011TLK2HTA11_99999974143_84620HumanColorectumMSS1.28e-06-3.86e-010.3005
11011TLK2F007HumanColorectumFAP4.14e-03-3.20e-010.1176
11011TLK2A002-C-010HumanColorectumFAP2.04e-02-2.33e-010.242
11011TLK2A001-C-207HumanColorectumFAP1.43e-04-3.15e-010.1278
11011TLK2A015-C-203HumanColorectumFAP5.79e-31-4.22e-01-0.1294
11011TLK2A015-C-204HumanColorectumFAP2.35e-09-3.33e-01-0.0228
11011TLK2A014-C-040HumanColorectumFAP3.56e-05-3.44e-01-0.1184
11011TLK2A002-C-201HumanColorectumFAP6.92e-20-4.24e-010.0324
11011TLK2A002-C-203HumanColorectumFAP1.51e-04-2.36e-010.2786
11011TLK2A001-C-119HumanColorectumFAP1.11e-09-3.90e-01-0.1557
11011TLK2A001-C-108HumanColorectumFAP3.21e-19-3.45e-01-0.0272
11011TLK2A002-C-205HumanColorectumFAP3.18e-26-4.21e-01-0.1236
11011TLK2A001-C-104HumanColorectumFAP8.62e-07-3.07e-010.0184
Page: 1 2 3 4 5 6 7 8 

check button Transcriptomic changes along malignancy continuum.
TissueExpression DynamicsAbbreviation
Colorectum (GSE201348)The image shows the transcriptomic changes along malignancy continuum.log2FC in expression of this searched gene in stem-like cells from each diseased tissue sample relative to stem-like cells in normal samples in each tissue plotted against the malignancy continuum. Samples are colored based on if they are from different disease stage.
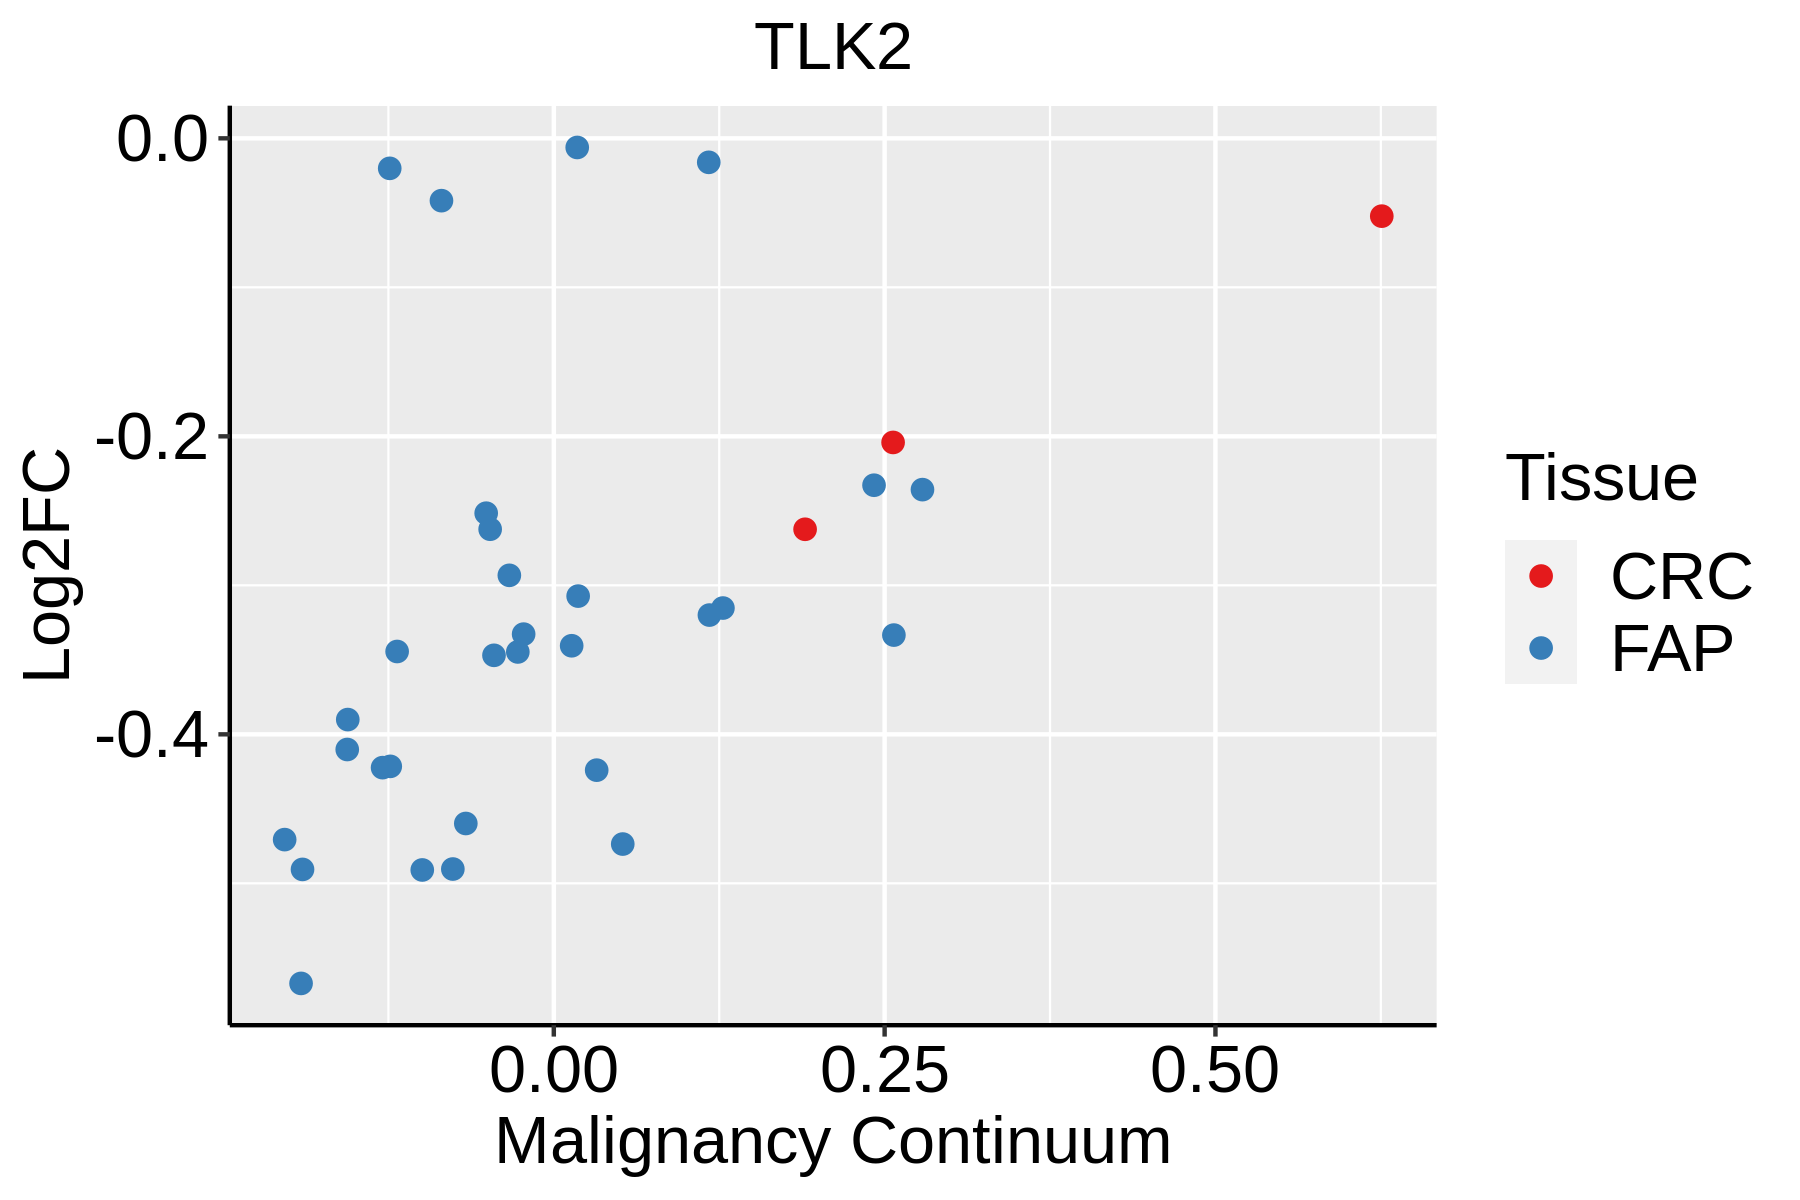
FAP: Familial adenomatous polyposis
CRC: Colorectal cancer
Colorectum (HTA11)The image shows the transcriptomic changes along malignancy continuum.log2FC in expression of this searched gene in stem-like cells from each diseased tissue sample relative to stem-like cells in normal samples in each tissue plotted against the malignancy continuum. Samples are colored based on if they are from different disease stage.AD: Adenomas
SER: Sessile serrated lesions
MSI-H: Microsatellite-high colorectal cancer
MSS: Microsatellite stable colorectal cancer
EndometriumThe image shows the transcriptomic changes along malignancy continuum.log2FC in expression of this searched gene in stem-like cells from each diseased tissue sample relative to stem-like cells in normal samples in each tissue plotted against the malignancy continuum. Samples are colored based on if they are from different disease stage.
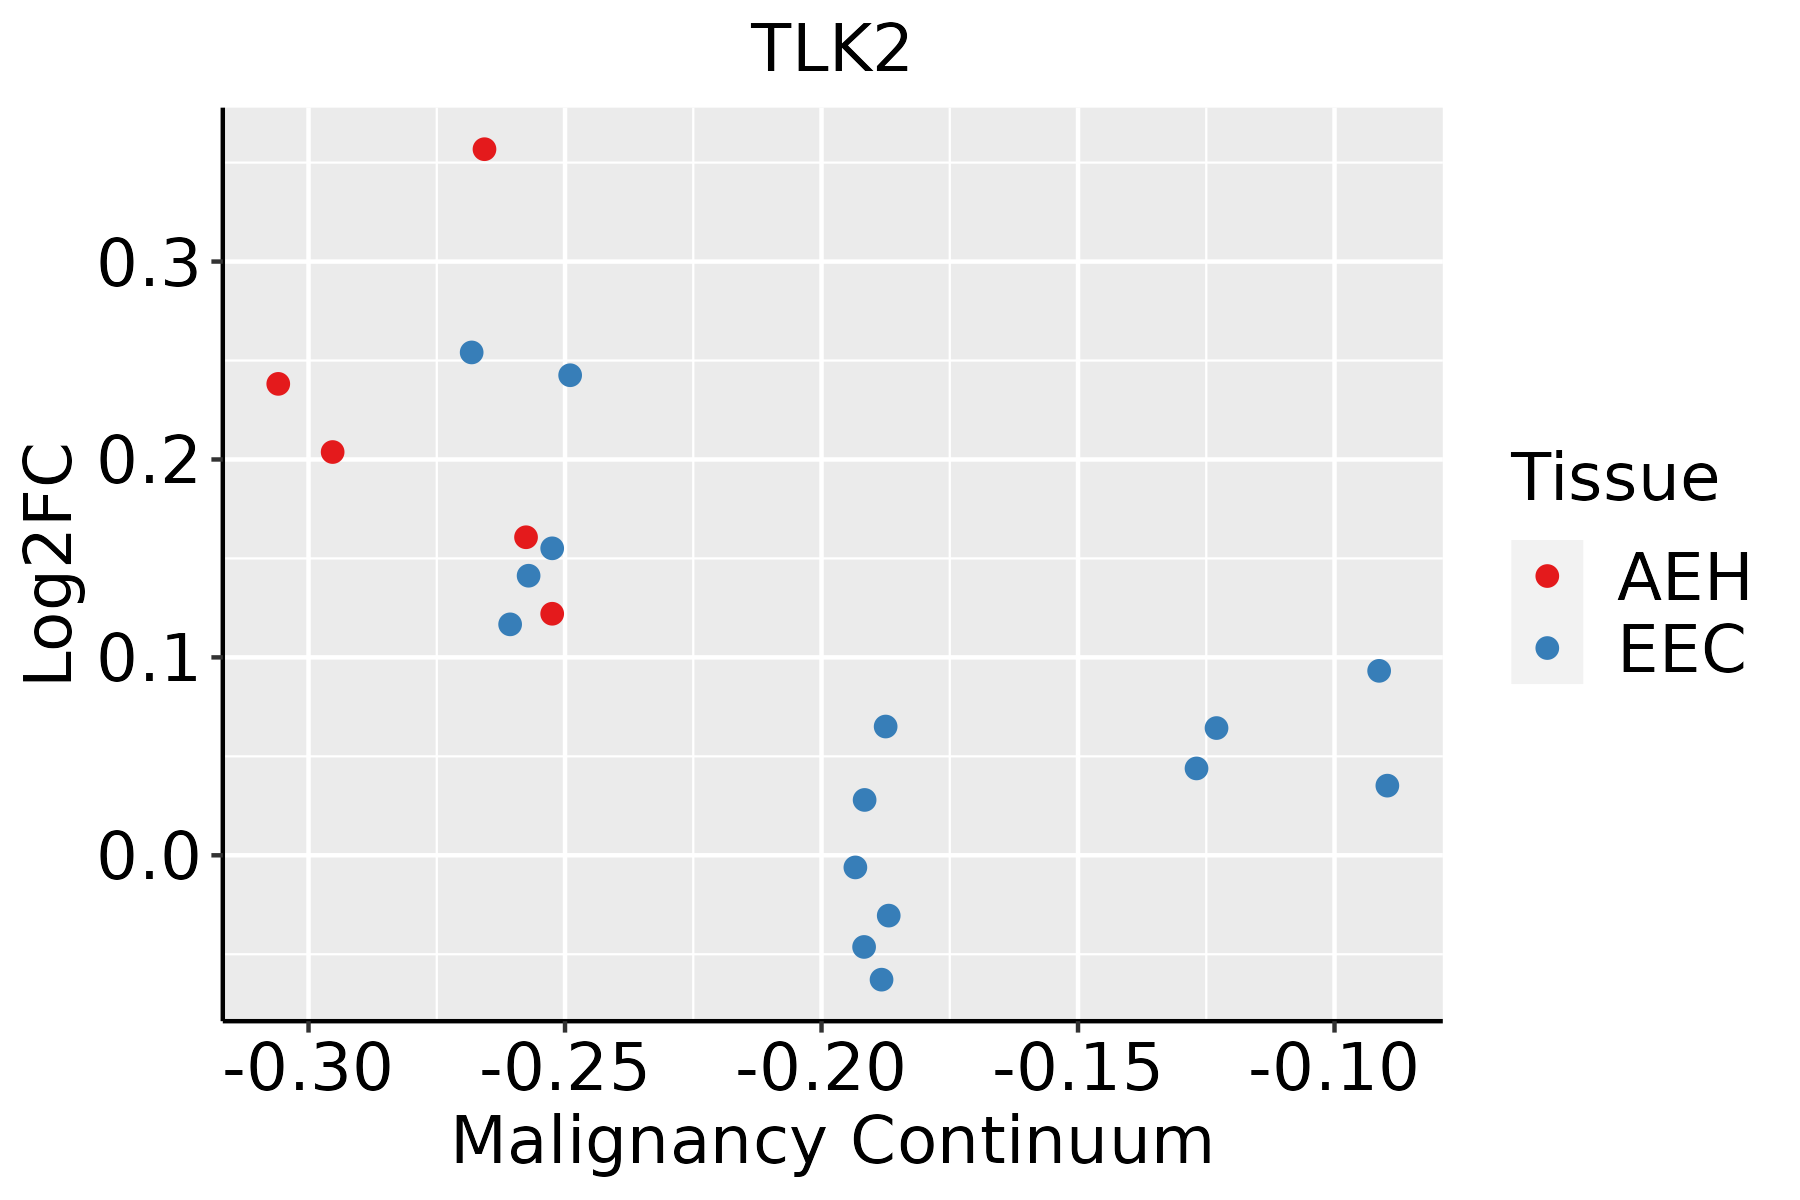
AEH: Atypical endometrial hyperplasia
EEC: Endometrioid Cancer
EsophagusThe image shows the transcriptomic changes along malignancy continuum.log2FC in expression of this searched gene in stem-like cells from each diseased tissue sample relative to stem-like cells in normal samples in each tissue plotted against the malignancy continuum. Samples are colored based on if they are from different disease stage.
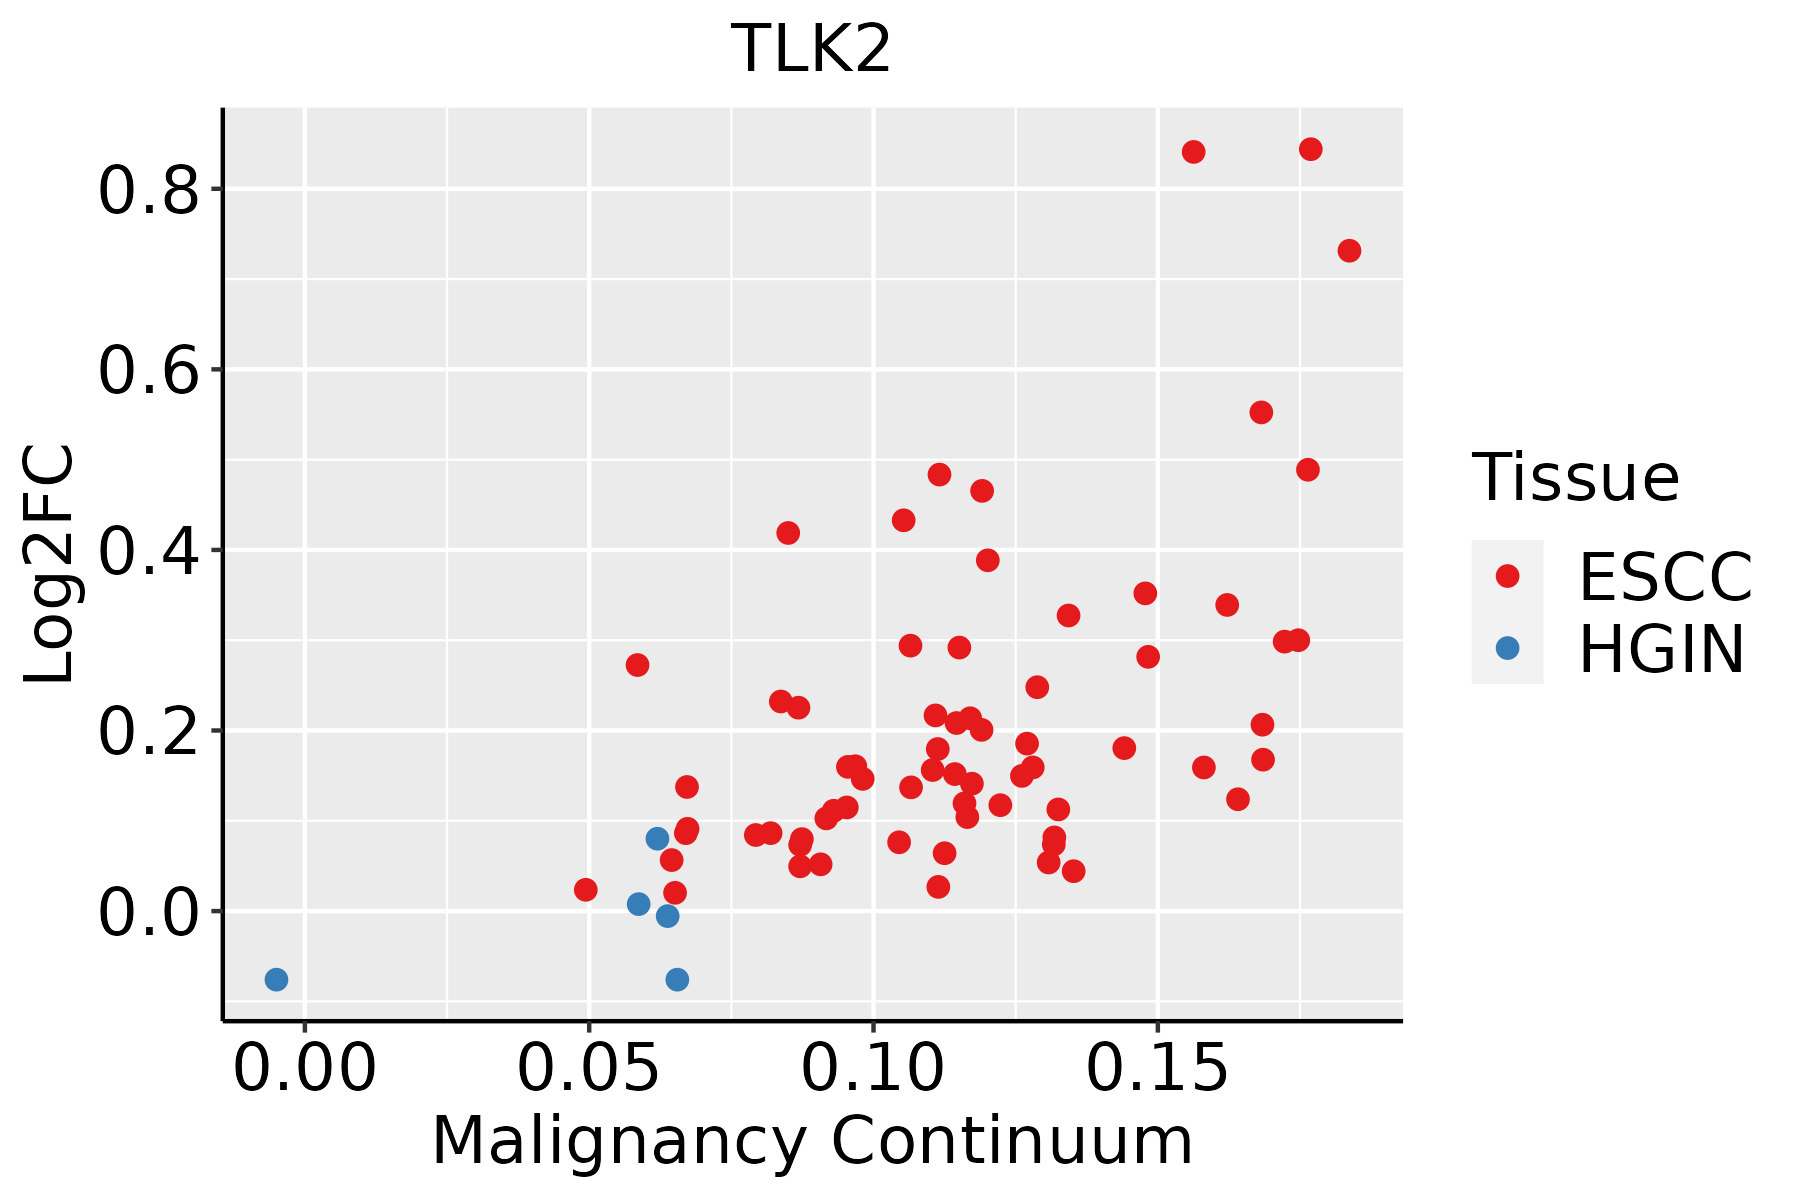
ESCC: Esophageal squamous cell carcinoma
HGIN: High-grade intraepithelial neoplasias
LGIN: Low-grade intraepithelial neoplasias
LiverThe image shows the transcriptomic changes along malignancy continuum.log2FC in expression of this searched gene in stem-like cells from each diseased tissue sample relative to stem-like cells in normal samples in each tissue plotted against the malignancy continuum. Samples are colored based on if they are from different disease stage.
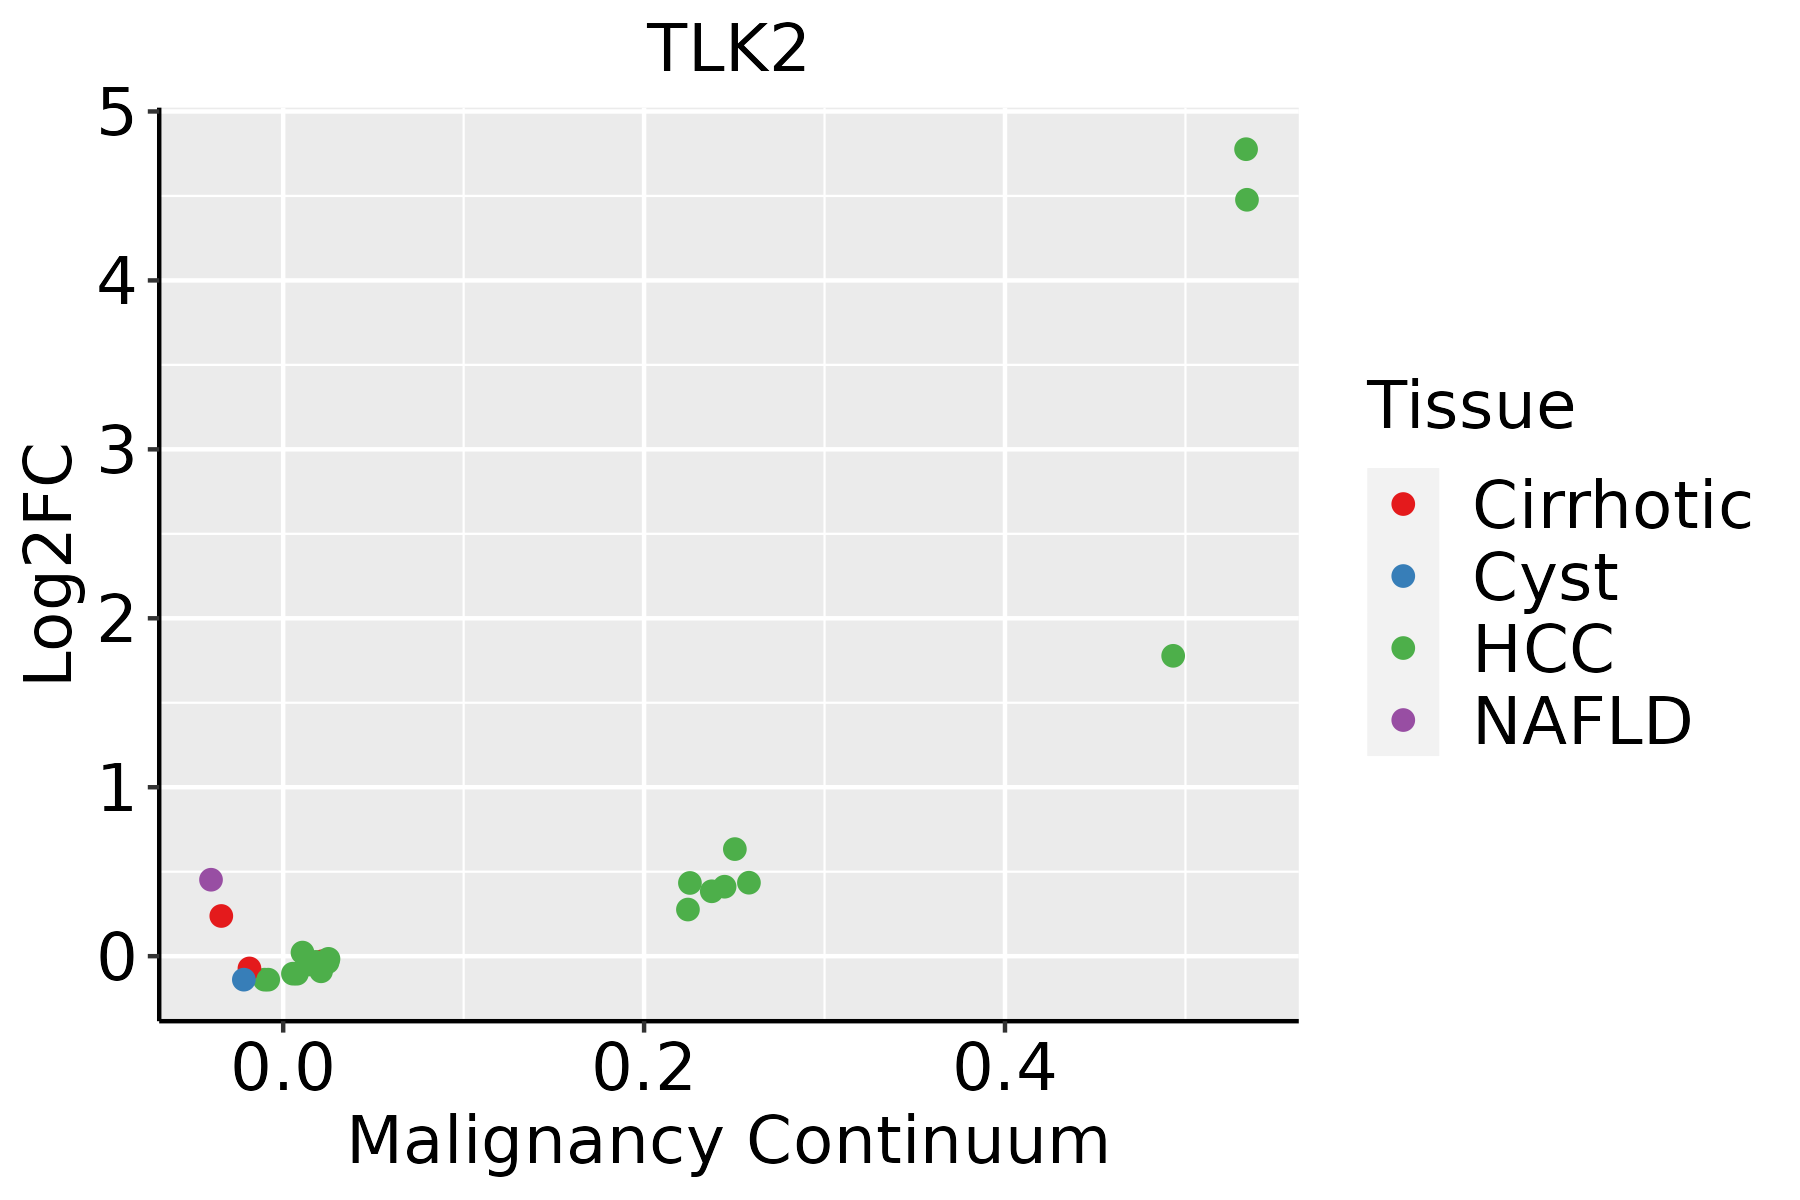
HCC: Hepatocellular carcinoma
NAFLD: Non-alcoholic fatty liver disease
Oral CavityThe image shows the transcriptomic changes along malignancy continuum.log2FC in expression of this searched gene in stem-like cells from each diseased tissue sample relative to stem-like cells in normal samples in each tissue plotted against the malignancy continuum. Samples are colored based on if they are from different disease stage.
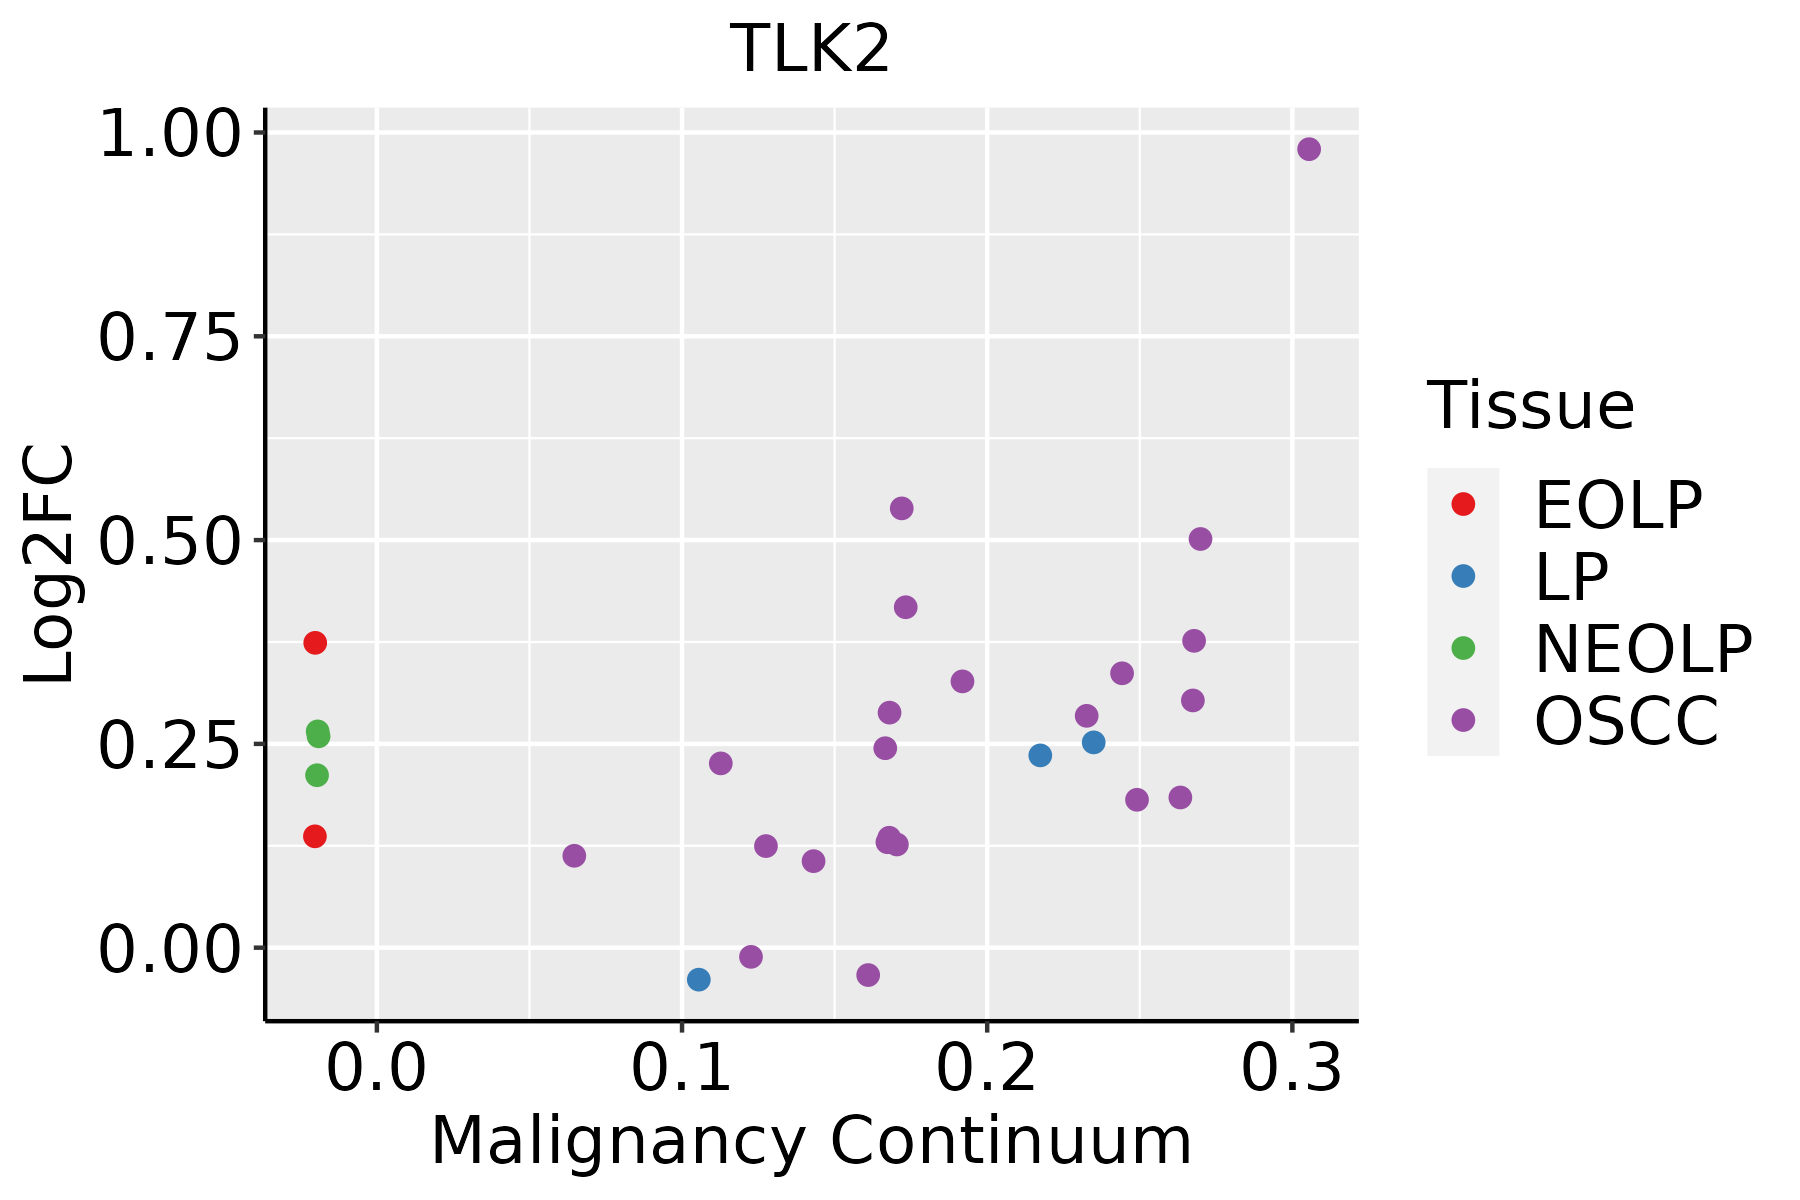
EOLP: Erosive Oral lichen planus
LP: leukoplakia
NEOLP: Non-erosive oral lichen planus
OSCC: Oral squamous cell carcinoma
ThyroidThe image shows the transcriptomic changes along malignancy continuum.log2FC in expression of this searched gene in stem-like cells from each diseased tissue sample relative to stem-like cells in normal samples in each tissue plotted against the malignancy continuum. Samples are colored based on if they are from different disease stage.
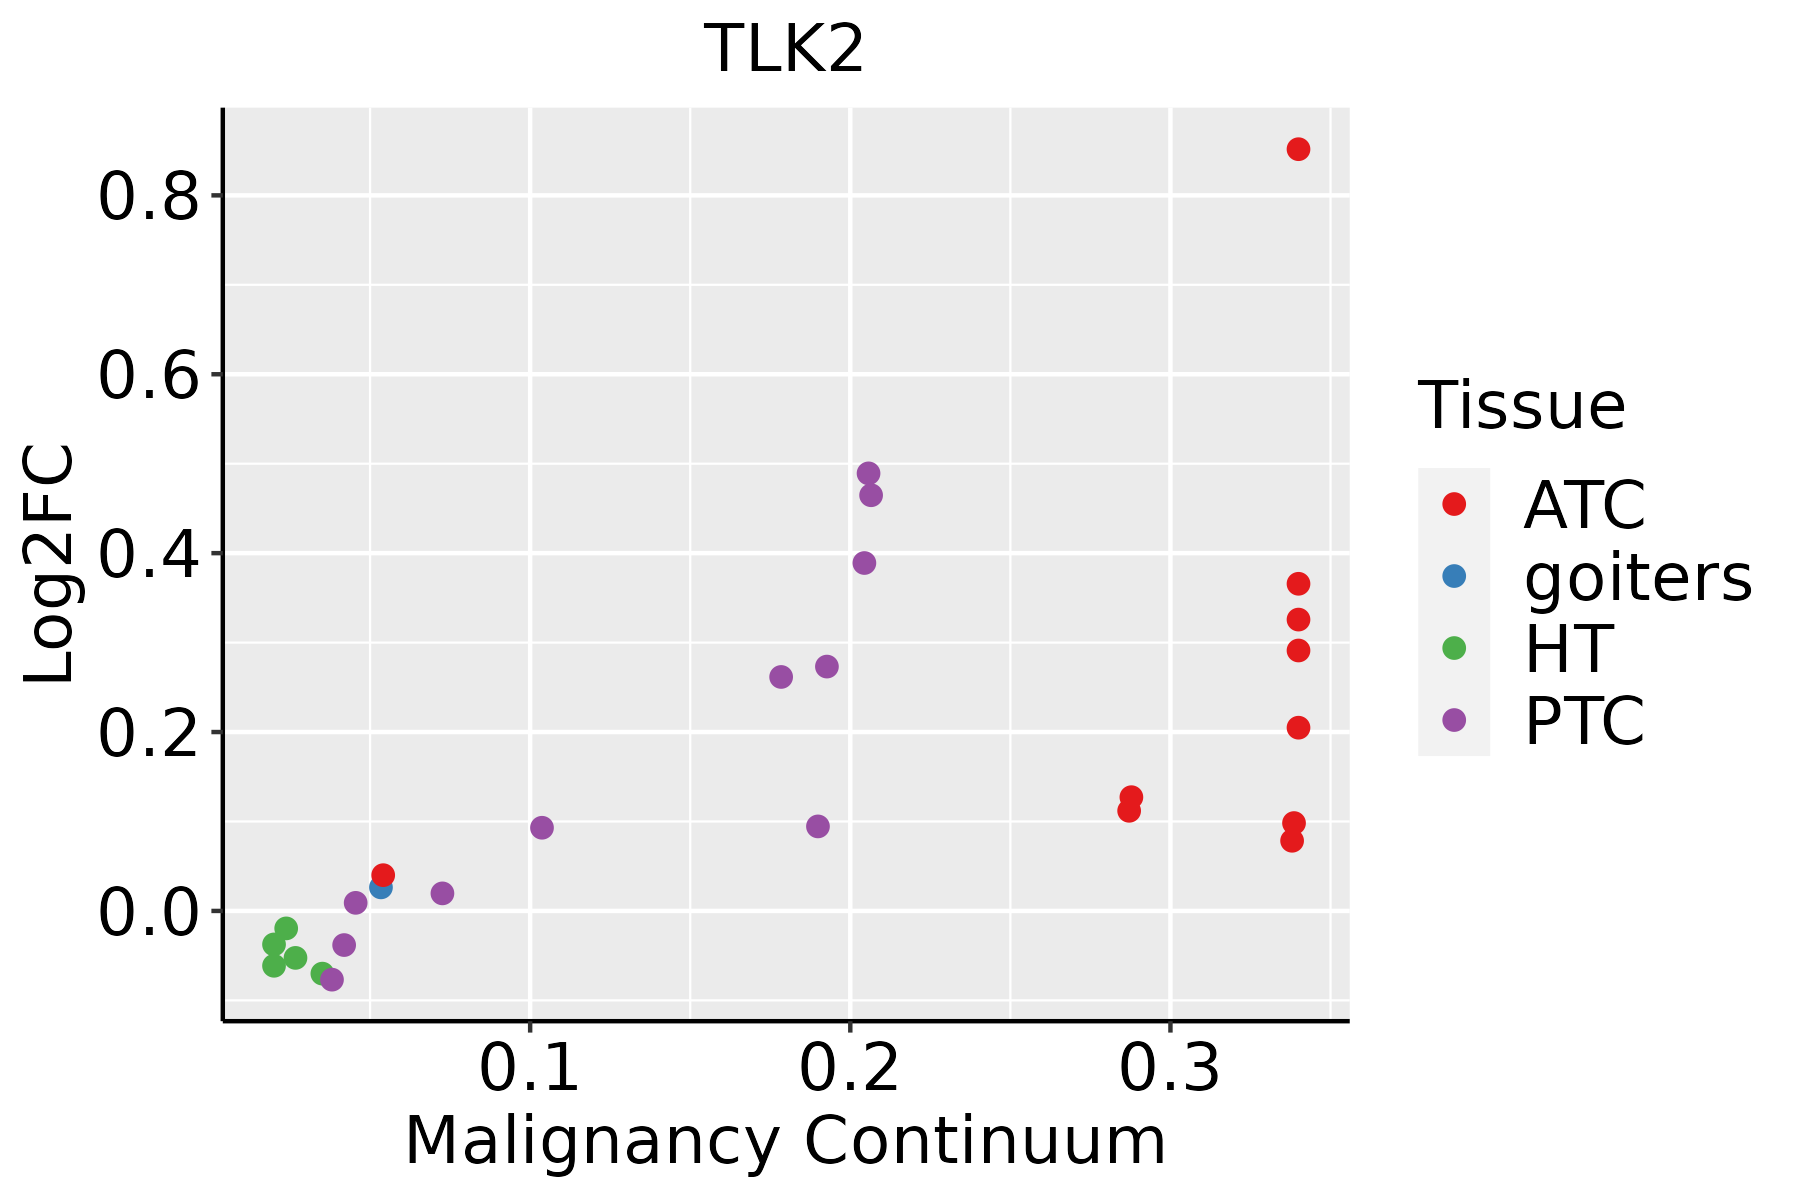
ATC: Anaplastic thyroid cancer
HT: Hashimoto's thyroiditis
PTC: Papillary thyroid cancer
∗log2FC in expression of this searched gene in stem-like cells from each diseased tissue sample relative to stem-like cells in normal samples in each tissue plotted against the malignancy continuum. Samples are colored based on if they are from different disease stage.

Top

Malignant transformation related pathway analysis

check buttonFind out the enriched GO biological processes and KEGG pathways involved in transition from healthy to precancer to cancer
check button Figure of enriched GO biological processes.
TissueDisease StageEnriched GO biological Processes
ColorectumADGO analysis - Figure of enriched GO biological processes: Top 15 enriched GO BP terms are showed in the bar plot of each disease state in each tissue. Each row represents a significant GO biological process which is colored according to the -log10(p.adjust).
ColorectumSERGO analysis - Figure of enriched GO biological processes: Top 15 enriched GO BP terms are showed in the bar plot of each disease state in each tissue. Each row represents a significant GO biological process which is colored according to the -log10(p.adjust).
ColorectumMSSGO analysis - Figure of enriched GO biological processes: Top 15 enriched GO BP terms are showed in the bar plot of each disease state in each tissue. Each row represents a significant GO biological process which is colored according to the -log10(p.adjust).
ColorectumMSI-HGO analysis - Figure of enriched GO biological processes: Top 15 enriched GO BP terms are showed in the bar plot of each disease state in each tissue. Each row represents a significant GO biological process which is colored according to the -log10(p.adjust).
ColorectumFAPGO analysis - Figure of enriched GO biological processes: Top 15 enriched GO BP terms are showed in the bar plot of each disease state in each tissue. Each row represents a significant GO biological process which is colored according to the -log10(p.adjust).
∗Top 15 enriched GO BP terms are showed in the bar plot of each disease state in each tissue. Each row represents a significant GO biological process which is colored according to the -log10(p.adjust).
Page: 1 2 3 4 5 6 7 8 9 

check button Enriched GO biological processes.
GO IDTissueDisease StageDescriptionGene RatioBg Ratiopvaluep.adjustCount
GO:20000591ColorectumSERnegative regulation of ubiquitin-dependent protein catabolic process17/289748/187235.46e-047.63e-0317
GO:00181051ColorectumSERpeptidyl-serine phosphorylation66/2897315/187235.47e-034.06e-0266
GO:00421762ColorectumMSSregulation of protein catabolic process145/3467391/187232.03e-181.17e-15145
GO:19033622ColorectumMSSregulation of cellular protein catabolic process99/3467255/187231.90e-145.37e-1299
GO:00104982ColorectumMSSproteasomal protein catabolic process157/3467490/187232.39e-135.25e-11157
GO:00313302ColorectumMSSnegative regulation of cellular catabolic process96/3467262/187232.67e-124.63e-1096
GO:00098952ColorectumMSSnegative regulation of catabolic process110/3467320/187237.88e-121.20e-09110
GO:19030502ColorectumMSSregulation of proteolysis involved in cellular protein catabolic process82/3467221/187234.97e-115.64e-0982
GO:00431612ColorectumMSSproteasome-mediated ubiquitin-dependent protein catabolic process127/3467412/187237.70e-106.32e-08127
GO:20000582ColorectumMSSregulation of ubiquitin-dependent protein catabolic process61/3467164/187231.28e-087.61e-0761
GO:00611362ColorectumMSSregulation of proteasomal protein catabolic process67/3467187/187231.45e-088.47e-0767
GO:19033632ColorectumMSSnegative regulation of cellular protein catabolic process34/346775/187238.96e-084.44e-0634
GO:00421772ColorectumMSSnegative regulation of protein catabolic process47/3467121/187231.28e-076.01e-0647
GO:00105062ColorectumMSSregulation of autophagy95/3467317/187234.36e-071.71e-0595
GO:00324342ColorectumMSSregulation of proteasomal ubiquitin-dependent protein catabolic process49/3467134/187236.02e-072.26e-0549
GO:20000592ColorectumMSSnegative regulation of ubiquitin-dependent protein catabolic process22/346748/187231.33e-053.07e-0422
GO:00458612ColorectumMSSnegative regulation of proteolysis97/3467351/187231.57e-053.54e-0497
GO:19030512ColorectumMSSnegative regulation of proteolysis involved in cellular protein catabolic process26/346764/187233.19e-056.30e-0426
GO:00324352ColorectumMSSnegative regulation of proteasomal ubiquitin-dependent protein catabolic process17/346735/187235.07e-059.12e-0417
GO:00063252ColorectumMSSchromatin organization107/3467409/187237.22e-051.21e-03107
Page: 1 2 3 4 5 6 7 8 9 10 11 12 13 14 15 16 17 18 19 20 

check button Enriched KEGG pathways.
Pathway IDTissueDisease StageDescriptionGene RatioBg Ratiopvaluep.adjustqvalueCount
Page: 1 

Top

Cell-cell communication analysis

check buttonIdentification of potential cell-cell interactions between two cell types and their ligand-receptor pairs for different disease states
LigandReceptorLRpairPathwayTissueDisease Stage
Page: 1 

Top

Single-cell gene regulatory network inference analysis

check buttonFind out the significant the regulons (TFs) and the target genes of each regulon across cell types for different disease states
TFCell TypeTissueDisease StageTarget GeneRSSRegulon Activity
∗The dot plots of a searched regulon are shown for all cell subpopulations in each disease state of each tissue based on the regulon specific score inferred using pySCENIC and by calculating the average expression.
Page: 1 

Top

Somatic mutation of malignant transformation related genes

check buttonAnnotation of somatic variants for genes involved in malignant transformation
Hugo SymbolVariant ClassVariant ClassificationdbSNP RSHGVScHGVSpHGVSp ShortSWISSPROTBIOTYPESIFTPolyPhenTumor Sample BarcodeTissueHistologySexAgeStageTherapy TypesDrugsOutcome
TLK2SNVMissense_Mutationnovelc.1820N>Cp.Gly607Alap.G607AQ86UE8protein_codingdeleterious(0)probably_damaging(1)TCGA-3C-AALI-01Breastbreast invasive carcinomaFemale<65I/IIUnspecificPoly EComplete Response
TLK2SNVMissense_Mutationc.1219N>Cp.Glu407Glnp.E407QQ86UE8protein_codingdeleterious(0.01)benign(0.371)TCGA-A2-A0CX-01Breastbreast invasive carcinomaFemale<65I/IIChemotherapyadriamycinSD
TLK2SNVMissense_Mutationc.1730N>Tp.Ala577Valp.A577VQ86UE8protein_codingdeleterious(0)probably_damaging(0.926)TCGA-A8-A09Z-01Breastbreast invasive carcinomaFemale>=65I/IIUnknownUnknownSD
TLK2SNVMissense_Mutationc.1658A>Gp.Asp553Glyp.D553GQ86UE8protein_codingdeleterious(0)possibly_damaging(0.685)TCGA-D8-A1XC-01Breastbreast invasive carcinomaFemale>=65III/IVUnknownUnknownPD
TLK2SNVMissense_Mutationnovelc.93N>Gp.Asn31Lysp.N31KQ86UE8protein_codingdeleterious_low_confidence(0.02)benign(0.007)TCGA-PE-A5DC-01Breastbreast invasive carcinomaFemale>=65III/IVUnknownUnknownSD
TLK2SNVMissense_Mutationnovelc.1703G>Ap.Arg568Glnp.R568QQ86UE8protein_codingdeleterious(0)probably_damaging(0.909)TCGA-UL-AAZ6-01Breastbreast invasive carcinomaFemale>=65I/IIChemotherapyherceptinSD
TLK2SNVMissense_Mutationrs200158456c.127N>Ap.Gly43Argp.G43RQ86UE8protein_codingdeleterious_low_confidence(0)probably_damaging(1)TCGA-2W-A8YY-01Cervixcervical & endocervical cancerFemale<65I/IIChemotherapycisplatinCR
TLK2SNVMissense_Mutationnovelc.1864G>Tp.Asp622Tyrp.D622YQ86UE8protein_codingdeleterious(0)probably_damaging(0.928)TCGA-C5-A8XI-01Cervixcervical & endocervical cancerFemale>=65I/IIChemotherapycisplatinSD
TLK2SNVMissense_Mutationc.857G>Cp.Arg286Thrp.R286TQ86UE8protein_codingdeleterious(0)probably_damaging(0.997)TCGA-JX-A3Q0-01Cervixcervical & endocervical cancerFemale<65III/IVUnknownUnknownSD
TLK2SNVMissense_Mutationc.1801N>Cp.Val601Leup.V601LQ86UE8protein_codingtolerated(0.24)probably_damaging(0.981)TCGA-Q1-A73O-01Cervixcervical & endocervical cancerFemale<65I/IIChemotherapycisplatinCR
Page: 1 2 3 4 5 6 7 8 

Top

Related drugs of malignant transformation related genes

check buttonIdentification of chemicals and drugs interact with genes involved in malignant transfromation
(DGIdb 4.0)
Entrez IDSymbolCategoryInteraction TypesDrug Claim NameDrug NamePMIDs
11011TLK2DRUGGABLE GENOME, SERINE THREONINE KINASE, KINASE, ENZYMEGO698327694828
11011TLK2DRUGGABLE GENOME, SERINE THREONINE KINASE, KINASE, ENZYMEGF109203X27694828
Page: 1