
|
|||||
|
 | |
| |
| |
| |
| |
| |
|
Gene: TLE1 |
Gene summary for TLE1 |
| Gene information | Species | Human | Gene symbol | TLE1 | Gene ID | 7088 |
| Gene name | TLE family member 1, transcriptional corepressor | |
| Gene Alias | ESG | |
| Cytomap | 9q21.32 | |
| Gene Type | protein-coding | GO ID | GO:0006139 | UniProtAcc | Q04724 |
Top |
Malignant transformation analysis |
| Identification of the aberrant gene expression in precancerous and cancerous lesions by comparing the gene expression of stem-like cells in diseased tissues with normal stem cells |
| Entrez ID | Symbol | Replicates | Species | Organ | Tissue | Adj P-value | Log2FC | Malignancy |
| 7088 | TLE1 | HTA11_3410_2000001011 | Human | Colorectum | AD | 9.03e-05 | -2.81e-01 | 0.0155 |
| 7088 | TLE1 | HTA11_347_2000001011 | Human | Colorectum | AD | 8.12e-03 | 4.32e-01 | -0.1954 |
| 7088 | TLE1 | HTA11_99999970781_79442 | Human | Colorectum | MSS | 5.59e-11 | -4.85e-01 | 0.294 |
| 7088 | TLE1 | HTA11_99999974143_84620 | Human | Colorectum | MSS | 2.38e-12 | -4.75e-01 | 0.3005 |
| 7088 | TLE1 | A015-C-203 | Human | Colorectum | FAP | 9.26e-20 | -3.61e-01 | -0.1294 |
| 7088 | TLE1 | A015-C-204 | Human | Colorectum | FAP | 3.25e-05 | -2.37e-01 | -0.0228 |
| 7088 | TLE1 | A014-C-040 | Human | Colorectum | FAP | 9.50e-03 | -2.36e-01 | -0.1184 |
| 7088 | TLE1 | A002-C-201 | Human | Colorectum | FAP | 2.47e-08 | -8.65e-02 | 0.0324 |
| 7088 | TLE1 | A002-C-203 | Human | Colorectum | FAP | 1.12e-02 | 1.23e-01 | 0.2786 |
| 7088 | TLE1 | A001-C-119 | Human | Colorectum | FAP | 1.18e-04 | -3.30e-01 | -0.1557 |
| 7088 | TLE1 | A001-C-108 | Human | Colorectum | FAP | 1.52e-13 | -2.66e-01 | -0.0272 |
| 7088 | TLE1 | A002-C-205 | Human | Colorectum | FAP | 6.91e-17 | -2.90e-01 | -0.1236 |
| 7088 | TLE1 | A001-C-104 | Human | Colorectum | FAP | 5.74e-03 | -2.31e-01 | 0.0184 |
| 7088 | TLE1 | A015-C-005 | Human | Colorectum | FAP | 2.02e-05 | -1.79e-01 | -0.0336 |
| 7088 | TLE1 | A015-C-006 | Human | Colorectum | FAP | 1.71e-16 | -5.15e-01 | -0.0994 |
| 7088 | TLE1 | A015-C-106 | Human | Colorectum | FAP | 4.30e-11 | -2.97e-01 | -0.0511 |
| 7088 | TLE1 | A002-C-114 | Human | Colorectum | FAP | 7.73e-17 | -3.65e-01 | -0.1561 |
| 7088 | TLE1 | A015-C-104 | Human | Colorectum | FAP | 1.84e-24 | -4.72e-01 | -0.1899 |
| 7088 | TLE1 | A001-C-014 | Human | Colorectum | FAP | 2.60e-11 | -1.46e-01 | 0.0135 |
| 7088 | TLE1 | A002-C-016 | Human | Colorectum | FAP | 3.85e-17 | -9.11e-02 | 0.0521 |
| Page: 1 2 3 4 5 6 7 |
| Tissue | Expression Dynamics | Abbreviation |
| Colorectum (GSE201348) |  | FAP: Familial adenomatous polyposis |
| CRC: Colorectal cancer | ||
| Colorectum (HTA11) |  | AD: Adenomas |
| SER: Sessile serrated lesions | ||
| MSI-H: Microsatellite-high colorectal cancer | ||
| MSS: Microsatellite stable colorectal cancer | ||
| Endometrium | 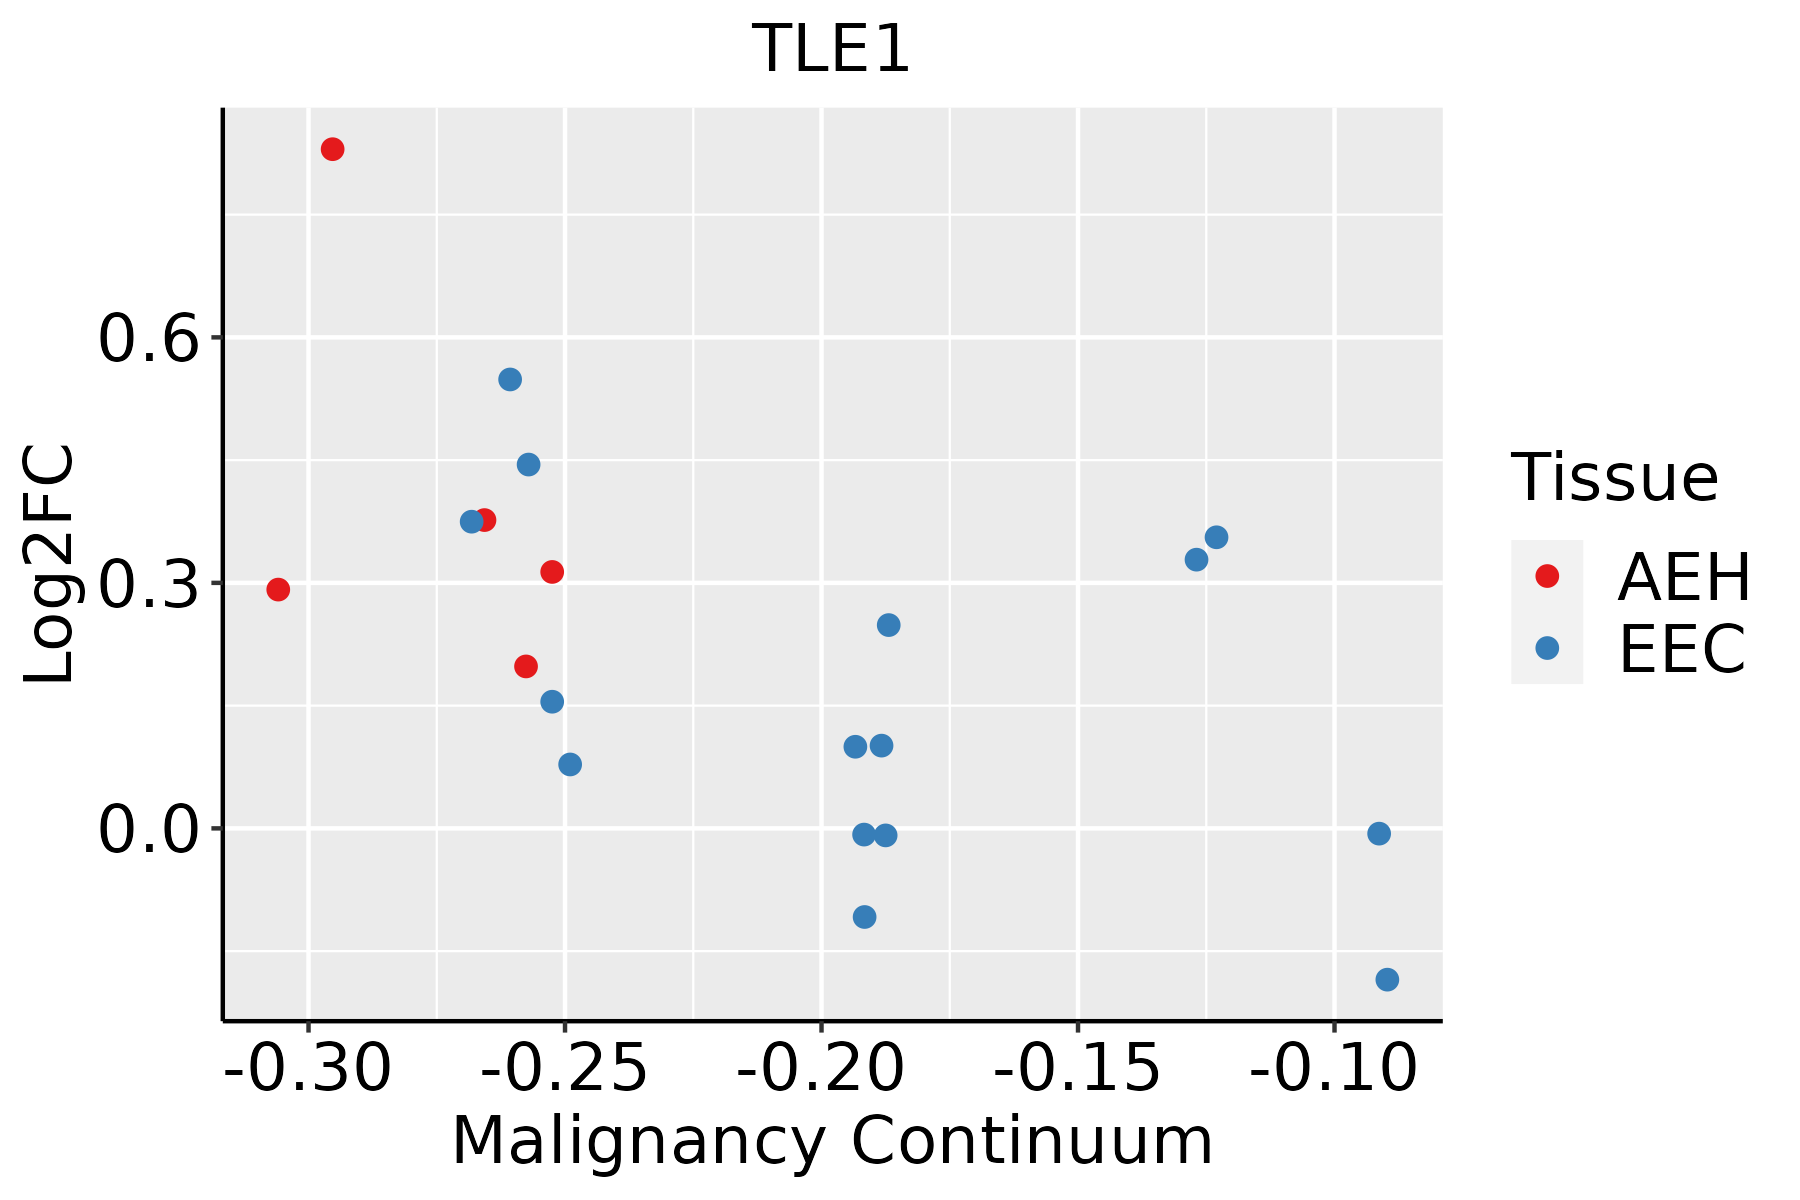 | AEH: Atypical endometrial hyperplasia |
| EEC: Endometrioid Cancer | ||
| Esophagus | 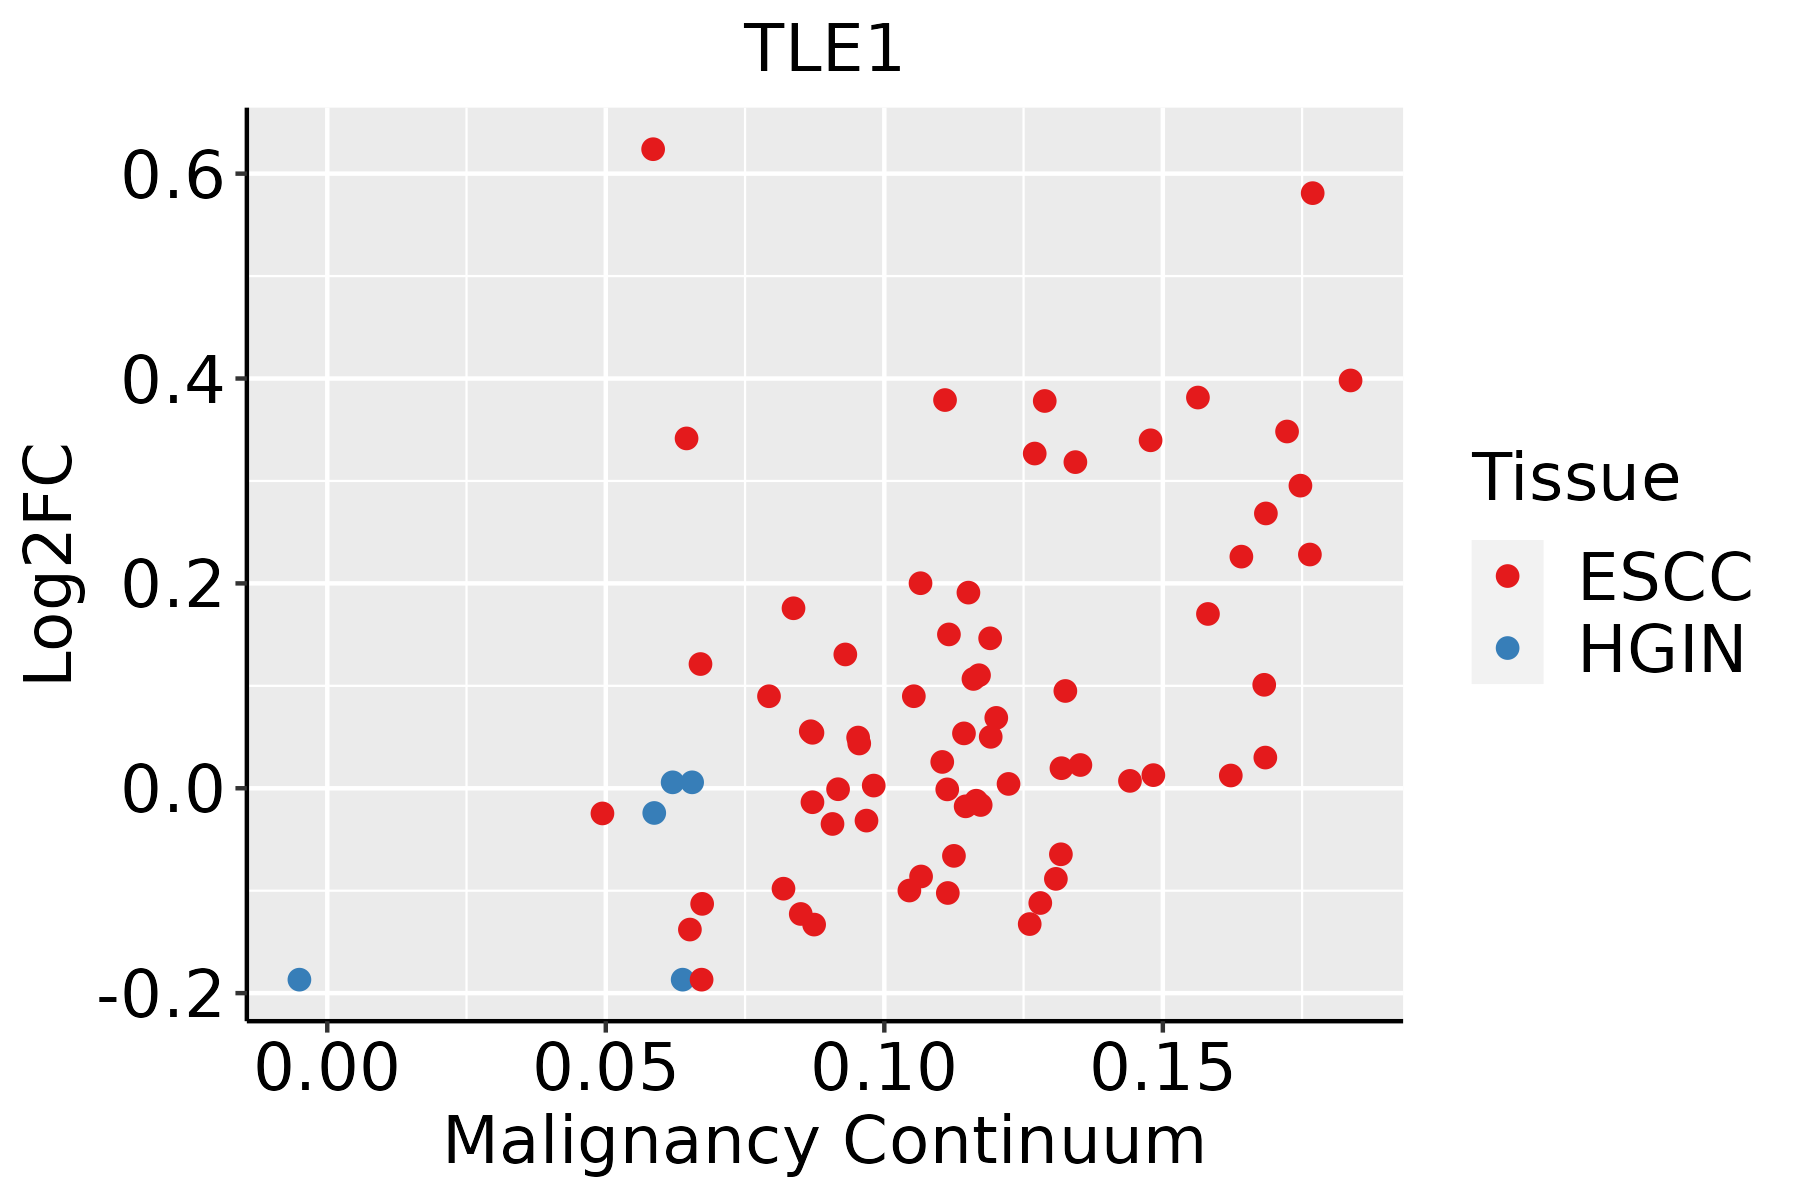 | ESCC: Esophageal squamous cell carcinoma |
| HGIN: High-grade intraepithelial neoplasias | ||
| LGIN: Low-grade intraepithelial neoplasias | ||
| Liver | 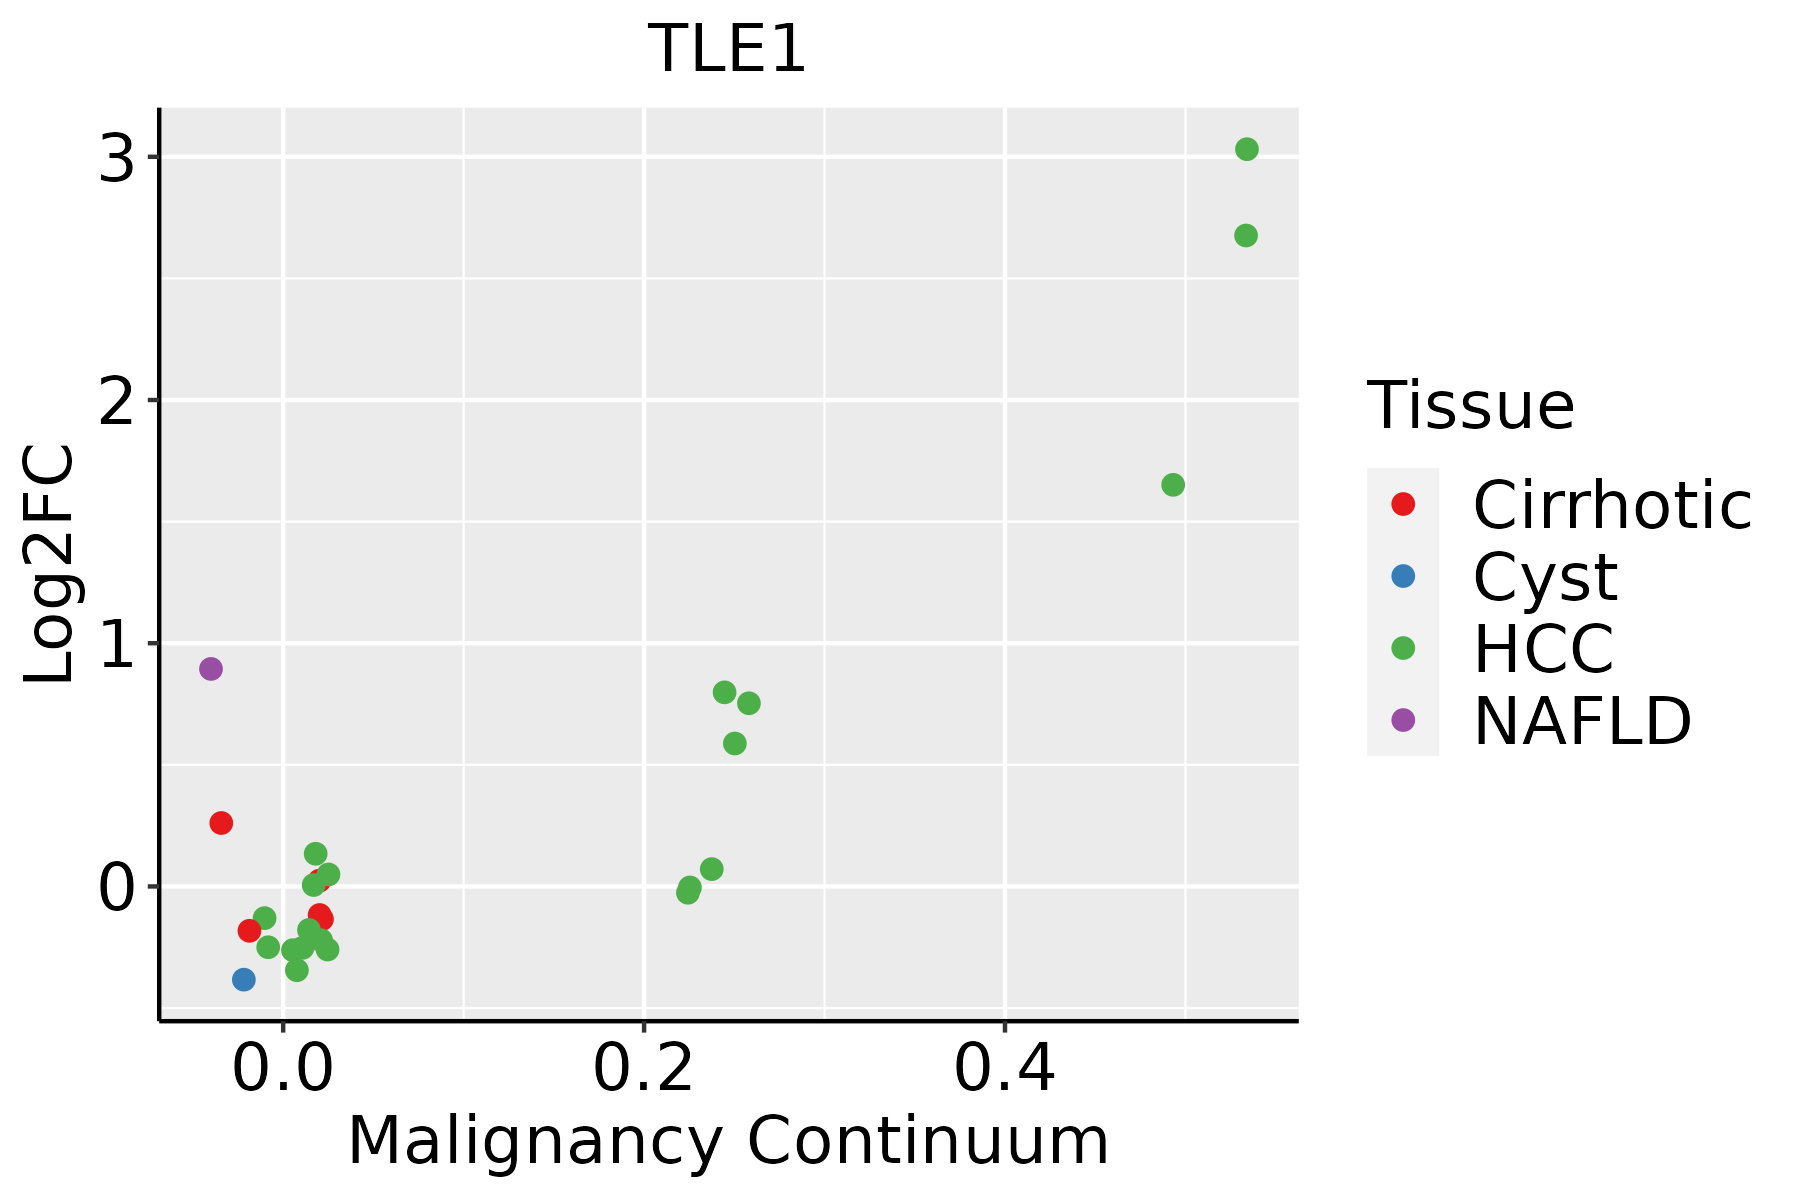 | HCC: Hepatocellular carcinoma |
| NAFLD: Non-alcoholic fatty liver disease | ||
| Oral Cavity | 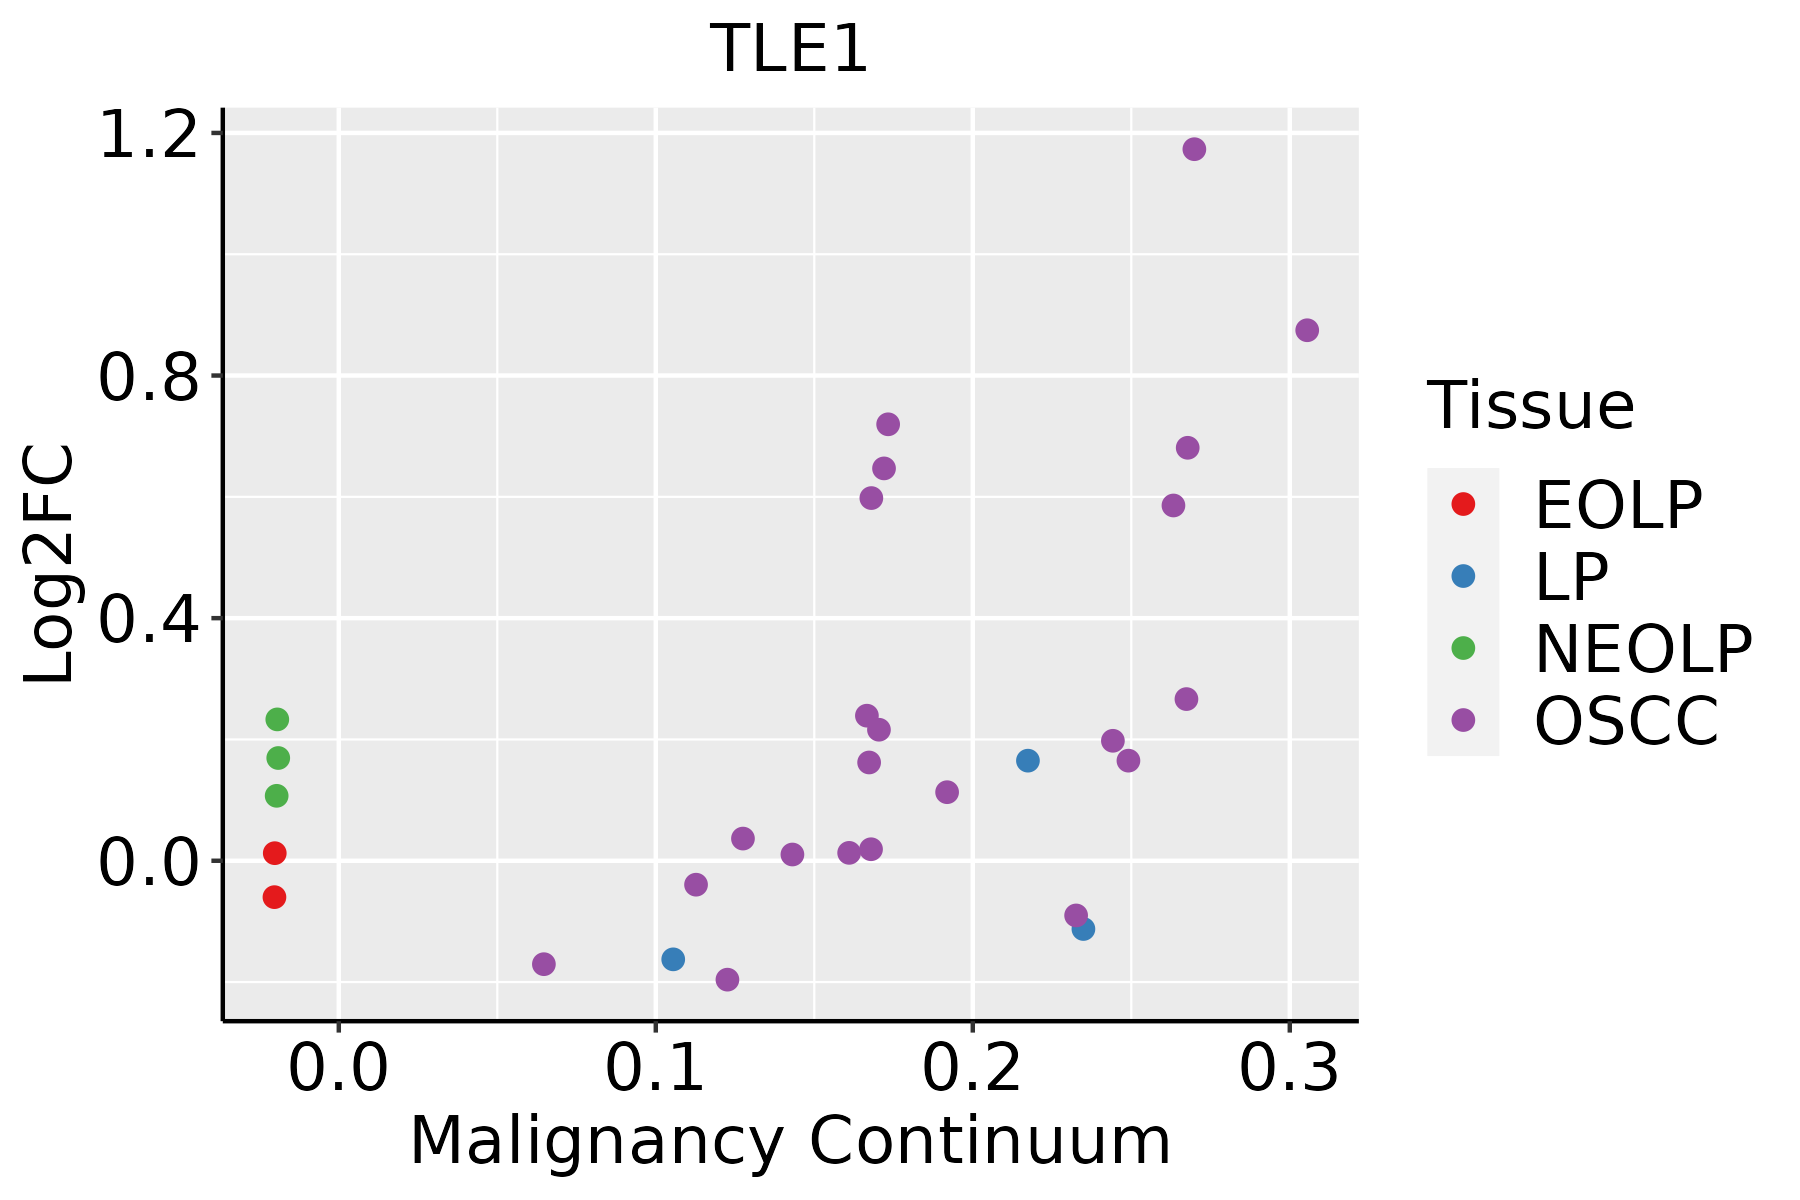 | EOLP: Erosive Oral lichen planus |
| LP: leukoplakia | ||
| NEOLP: Non-erosive oral lichen planus | ||
| OSCC: Oral squamous cell carcinoma | ||
| Thyroid | 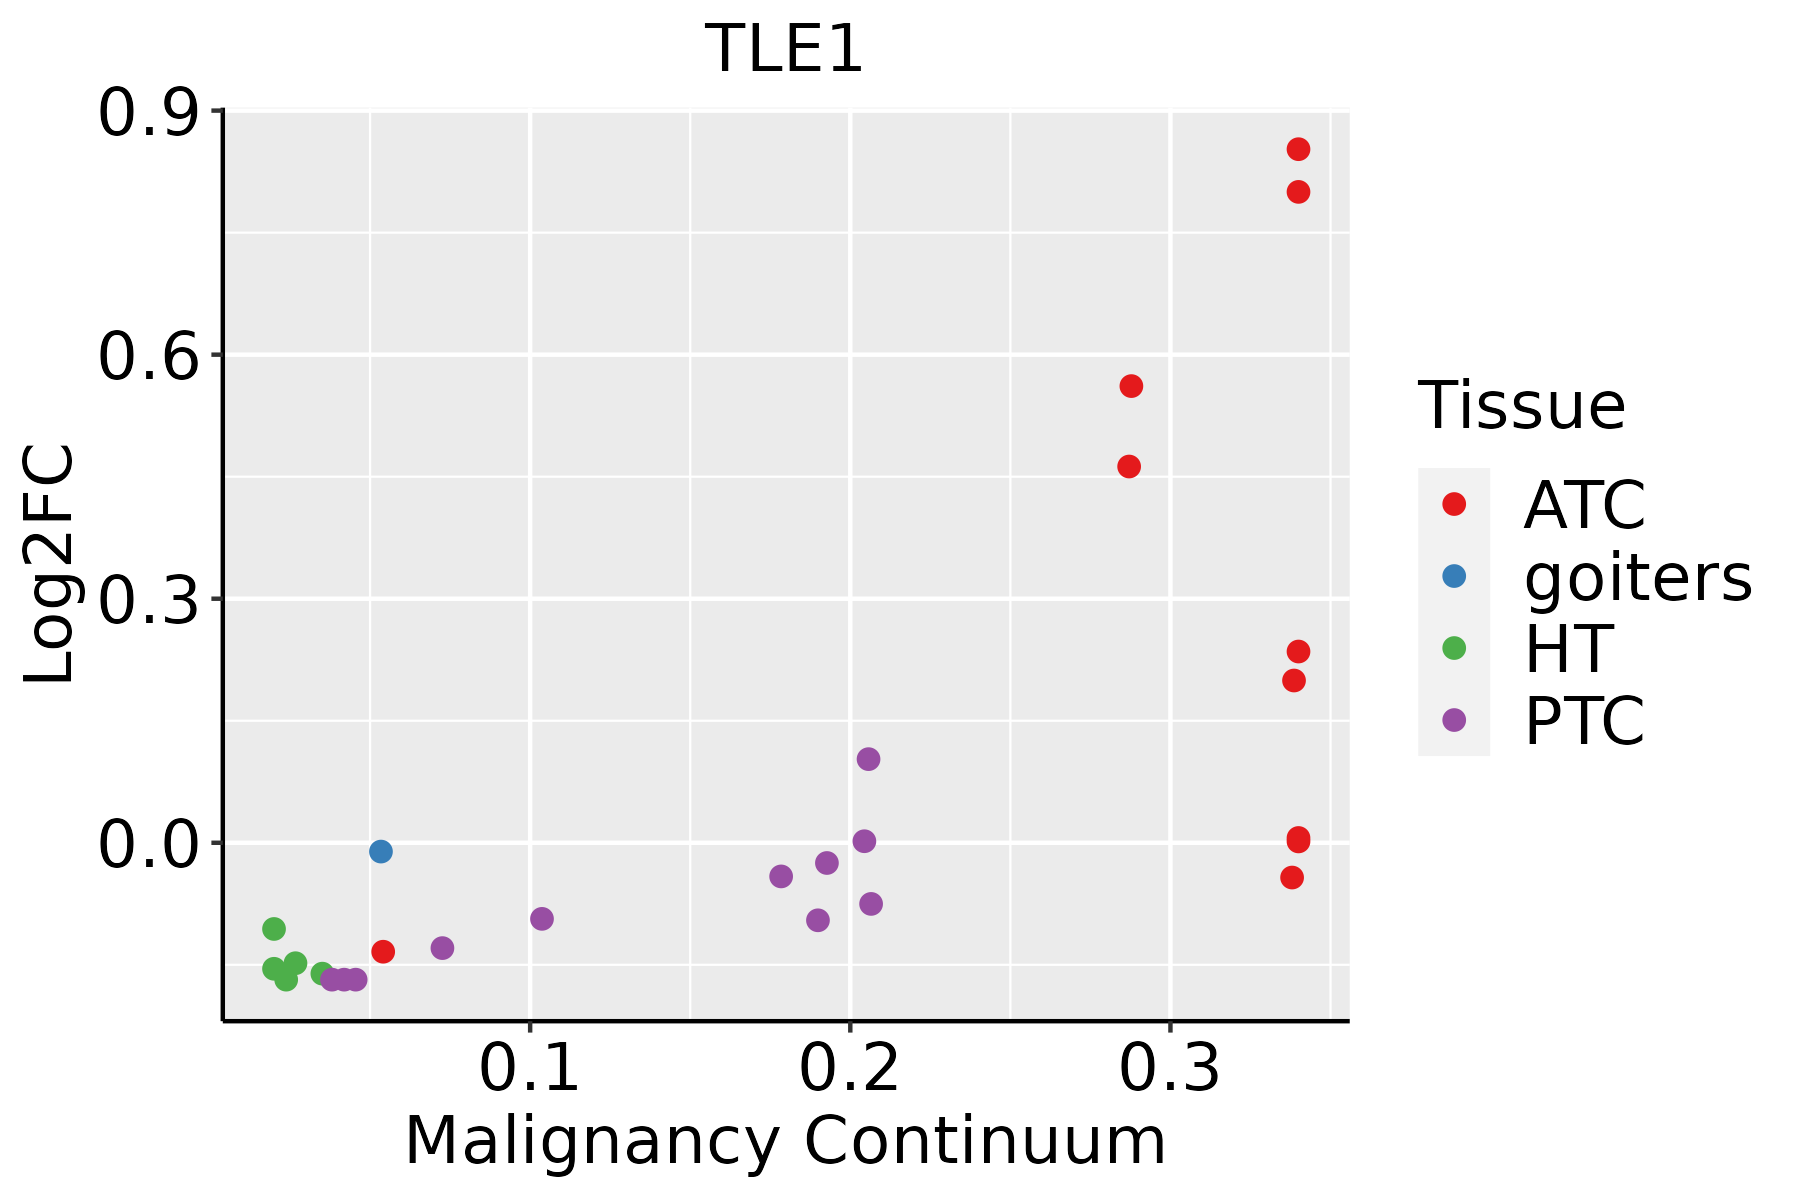 | ATC: Anaplastic thyroid cancer |
| HT: Hashimoto's thyroiditis | ||
| PTC: Papillary thyroid cancer |
| ∗log2FC in expression of this searched gene in stem-like cells from each diseased tissue sample relative to stem-like cells in normal samples in each tissue plotted against the malignancy continuum. Samples are colored based on if they are from different disease stage. |
Top |
Malignant transformation related pathway analysis |
| Find out the enriched GO biological processes and KEGG pathways involved in transition from healthy to precancer to cancer |
| Tissue | Disease Stage | Enriched GO biological Processes |
| Colorectum | AD |  |
| Colorectum | SER |  |
| Colorectum | MSS |  |
| Colorectum | MSI-H |  |
| Colorectum | FAP |  |
| ∗Top 15 enriched GO BP terms are showed in the bar plot of each disease state in each tissue. Each row represents a significant GO biological process which is colored according to the -log10(p.adjust). |
| Page: 1 2 3 4 5 6 7 8 9 |
| GO ID | Tissue | Disease Stage | Description | Gene Ratio | Bg Ratio | pvalue | p.adjust | Count |
| GO:001605513 | Endometrium | EEC | Wnt signaling pathway | 90/2168 | 444/18723 | 6.65e-08 | 3.50e-06 | 90 |
| GO:019873813 | Endometrium | EEC | cell-cell signaling by wnt | 90/2168 | 446/18723 | 8.25e-08 | 4.23e-06 | 90 |
| GO:006082813 | Endometrium | EEC | regulation of canonical Wnt signaling pathway | 56/2168 | 253/18723 | 1.18e-06 | 3.90e-05 | 56 |
| GO:004312216 | Endometrium | EEC | regulation of I-kappaB kinase/NF-kappaB signaling | 53/2168 | 249/18723 | 7.59e-06 | 1.73e-04 | 53 |
| GO:006007013 | Endometrium | EEC | canonical Wnt signaling pathway | 61/2168 | 303/18723 | 1.05e-05 | 2.25e-04 | 61 |
| GO:000724915 | Endometrium | EEC | I-kappaB kinase/NF-kappaB signaling | 57/2168 | 281/18723 | 1.60e-05 | 3.12e-04 | 57 |
| GO:003017812 | Endometrium | EEC | negative regulation of Wnt signaling pathway | 35/2168 | 170/18723 | 4.84e-04 | 4.96e-03 | 35 |
| GO:009009011 | Endometrium | EEC | negative regulation of canonical Wnt signaling pathway | 29/2168 | 137/18723 | 8.94e-04 | 8.12e-03 | 29 |
| GO:0043122110 | Esophagus | ESCC | regulation of I-kappaB kinase/NF-kappaB signaling | 167/8552 | 249/18723 | 6.11e-12 | 2.32e-10 | 167 |
| GO:000724919 | Esophagus | ESCC | I-kappaB kinase/NF-kappaB signaling | 183/8552 | 281/18723 | 3.02e-11 | 1.01e-09 | 183 |
| GO:001605517 | Esophagus | ESCC | Wnt signaling pathway | 268/8552 | 444/18723 | 2.32e-10 | 6.58e-09 | 268 |
| GO:019873817 | Esophagus | ESCC | cell-cell signaling by wnt | 269/8552 | 446/18723 | 2.41e-10 | 6.79e-09 | 269 |
| GO:003011117 | Esophagus | ESCC | regulation of Wnt signaling pathway | 194/8552 | 328/18723 | 5.39e-07 | 7.14e-06 | 194 |
| GO:006007016 | Esophagus | ESCC | canonical Wnt signaling pathway | 180/8552 | 303/18723 | 9.15e-07 | 1.17e-05 | 180 |
| GO:006082817 | Esophagus | ESCC | regulation of canonical Wnt signaling pathway | 153/8552 | 253/18723 | 1.38e-06 | 1.67e-05 | 153 |
| GO:20002093 | Esophagus | ESCC | regulation of anoikis | 20/8552 | 24/18723 | 1.69e-04 | 1.11e-03 | 20 |
| GO:00432761 | Esophagus | ESCC | anoikis | 26/8552 | 34/18723 | 2.53e-04 | 1.55e-03 | 26 |
| GO:00301788 | Esophagus | ESCC | negative regulation of Wnt signaling pathway | 97/8552 | 170/18723 | 1.81e-03 | 8.31e-03 | 97 |
| GO:20008113 | Esophagus | ESCC | negative regulation of anoikis | 14/8552 | 17/18723 | 2.22e-03 | 9.78e-03 | 14 |
| GO:00900905 | Esophagus | ESCC | negative regulation of canonical Wnt signaling pathway | 78/8552 | 137/18723 | 5.17e-03 | 1.95e-02 | 78 |
| Page: 1 2 3 4 5 6 7 |
| Pathway ID | Tissue | Disease Stage | Description | Gene Ratio | Bg Ratio | pvalue | p.adjust | qvalue | Count |
| hsa04310 | Colorectum | AD | Wnt signaling pathway | 56/2092 | 171/8465 | 1.03e-02 | 3.93e-02 | 2.51e-02 | 56 |
| hsa043101 | Colorectum | AD | Wnt signaling pathway | 56/2092 | 171/8465 | 1.03e-02 | 3.93e-02 | 2.51e-02 | 56 |
| hsa043102 | Colorectum | MSS | Wnt signaling pathway | 53/1875 | 171/8465 | 4.24e-03 | 1.86e-02 | 1.14e-02 | 53 |
| hsa043103 | Colorectum | MSS | Wnt signaling pathway | 53/1875 | 171/8465 | 4.24e-03 | 1.86e-02 | 1.14e-02 | 53 |
| hsa043104 | Colorectum | FAP | Wnt signaling pathway | 46/1404 | 171/8465 | 3.94e-04 | 3.06e-03 | 1.86e-03 | 46 |
| hsa043105 | Colorectum | FAP | Wnt signaling pathway | 46/1404 | 171/8465 | 3.94e-04 | 3.06e-03 | 1.86e-03 | 46 |
| hsa043106 | Colorectum | CRC | Wnt signaling pathway | 40/1091 | 171/8465 | 1.01e-04 | 1.57e-03 | 1.07e-03 | 40 |
| hsa043107 | Colorectum | CRC | Wnt signaling pathway | 40/1091 | 171/8465 | 1.01e-04 | 1.57e-03 | 1.07e-03 | 40 |
| hsa0431010 | Endometrium | AEH | Wnt signaling pathway | 37/1197 | 171/8465 | 4.68e-03 | 2.53e-02 | 1.86e-02 | 37 |
| hsa0431013 | Endometrium | AEH | Wnt signaling pathway | 37/1197 | 171/8465 | 4.68e-03 | 2.53e-02 | 1.86e-02 | 37 |
| hsa0431022 | Endometrium | EEC | Wnt signaling pathway | 40/1237 | 171/8465 | 1.37e-03 | 8.99e-03 | 6.70e-03 | 40 |
| hsa0431032 | Endometrium | EEC | Wnt signaling pathway | 40/1237 | 171/8465 | 1.37e-03 | 8.99e-03 | 6.70e-03 | 40 |
| hsa043306 | Esophagus | ESCC | Notch signaling pathway | 42/4205 | 62/8465 | 2.97e-03 | 7.97e-03 | 4.08e-03 | 42 |
| hsa0433013 | Esophagus | ESCC | Notch signaling pathway | 42/4205 | 62/8465 | 2.97e-03 | 7.97e-03 | 4.08e-03 | 42 |
| hsa043305 | Oral cavity | OSCC | Notch signaling pathway | 44/3704 | 62/8465 | 1.26e-05 | 5.55e-05 | 2.83e-05 | 44 |
| hsa0433012 | Oral cavity | OSCC | Notch signaling pathway | 44/3704 | 62/8465 | 1.26e-05 | 5.55e-05 | 2.83e-05 | 44 |
| hsa0433021 | Oral cavity | NEOLP | Notch signaling pathway | 21/1112 | 62/8465 | 2.23e-05 | 1.87e-04 | 1.18e-04 | 21 |
| hsa0431024 | Oral cavity | NEOLP | Wnt signaling pathway | 34/1112 | 171/8465 | 8.05e-03 | 2.88e-02 | 1.81e-02 | 34 |
| hsa0433031 | Oral cavity | NEOLP | Notch signaling pathway | 21/1112 | 62/8465 | 2.23e-05 | 1.87e-04 | 1.18e-04 | 21 |
| hsa0431034 | Oral cavity | NEOLP | Wnt signaling pathway | 34/1112 | 171/8465 | 8.05e-03 | 2.88e-02 | 1.81e-02 | 34 |
| Page: 1 |
Top |
Cell-cell communication analysis |
| Identification of potential cell-cell interactions between two cell types and their ligand-receptor pairs for different disease states |
| Ligand | Receptor | LRpair | Pathway | Tissue | Disease Stage |
| Page: 1 |
Top |
Single-cell gene regulatory network inference analysis |
| Find out the significant the regulons (TFs) and the target genes of each regulon across cell types for different disease states |
| TF | Cell Type | Tissue | Disease Stage | Target Gene | RSS | Regulon Activity |
| ∗The dot plots of a searched regulon are shown for all cell subpopulations in each disease state of each tissue based on the regulon specific score inferred using pySCENIC and by calculating the average expression. |
| Page: 1 |
Top |
Somatic mutation of malignant transformation related genes |
| Annotation of somatic variants for genes involved in malignant transformation |
| Hugo Symbol | Variant Class | Variant Classification | dbSNP RS | HGVSc | HGVSp | HGVSp Short | SWISSPROT | BIOTYPE | SIFT | PolyPhen | Tumor Sample Barcode | Tissue | Histology | Sex | Age | Stage | Therapy Types | Drugs | Outcome |
| TLE1 | SNV | Missense_Mutation | c.718N>A | p.Asp240Asn | p.D240N | Q04724 | protein_coding | deleterious(0.03) | probably_damaging(0.91) | TCGA-A2-A0CL-01 | Breast | breast invasive carcinoma | Female | <65 | III/IV | Chemotherapy | cytoxan | SD | |
| TLE1 | SNV | Missense_Mutation | c.1830N>T | p.Arg610Ser | p.R610S | Q04724 | protein_coding | deleterious(0) | probably_damaging(0.999) | TCGA-AO-A1KT-01 | Breast | breast invasive carcinoma | Female | >=65 | I/II | Chemotherapy | fluorouracil | SD | |
| TLE1 | SNV | Missense_Mutation | c.1846A>G | p.Thr616Ala | p.T616A | Q04724 | protein_coding | deleterious(0.02) | possibly_damaging(0.557) | TCGA-E9-A1NE-01 | Breast | breast invasive carcinoma | Female | <65 | I/II | Chemotherapy | doxorubicin | CR | |
| TLE1 | SNV | Missense_Mutation | c.1852G>C | p.Gly618Arg | p.G618R | Q04724 | protein_coding | deleterious(0) | probably_damaging(1) | TCGA-OL-A5RZ-01 | Breast | breast invasive carcinoma | Female | <65 | I/II | Chemotherapy | doxorubicin | CR | |
| TLE1 | insertion | Frame_Shift_Ins | novel | c.1459_1460insCAGGCTCCGCCTCCGGGGTTTACGCCGTTCTCCTGCCT | p.Val487AlafsTer17 | p.V487Afs*17 | Q04724 | protein_coding | TCGA-B6-A0IK-01 | Breast | breast invasive carcinoma | Female | <65 | III/IV | Unknown | Unknown | PD | ||
| TLE1 | SNV | Missense_Mutation | c.1465G>A | p.Ala489Thr | p.A489T | Q04724 | protein_coding | deleterious(0.01) | probably_damaging(1) | TCGA-AA-3697-01 | Colorectum | colon adenocarcinoma | Male | >=65 | I/II | Unknown | Unknown | SD | |
| TLE1 | SNV | Missense_Mutation | c.1679C>T | p.Ala560Val | p.A560V | Q04724 | protein_coding | deleterious(0) | possibly_damaging(0.703) | TCGA-AA-3852-01 | Colorectum | colon adenocarcinoma | Male | >=65 | I/II | Unknown | Unknown | PD | |
| TLE1 | SNV | Missense_Mutation | c.1748N>A | p.Ser583Asn | p.S583N | Q04724 | protein_coding | deleterious(0) | probably_damaging(0.999) | TCGA-AA-A02R-01 | Colorectum | colon adenocarcinoma | Female | >=65 | I/II | Unknown | Unknown | PD | |
| TLE1 | SNV | Missense_Mutation | c.1660N>G | p.Leu554Val | p.L554V | Q04724 | protein_coding | tolerated(0.07) | probably_damaging(0.999) | TCGA-AZ-4315-01 | Colorectum | colon adenocarcinoma | Male | <65 | I/II | Unknown | Unknown | SD | |
| TLE1 | SNV | Missense_Mutation | c.1690N>T | p.Pro564Ser | p.P564S | Q04724 | protein_coding | deleterious(0.01) | probably_damaging(0.999) | TCGA-CM-5344-01 | Colorectum | colon adenocarcinoma | Female | <65 | III/IV | Chemotherapy | oxaliplatin | SD |
| Page: 1 2 3 4 5 6 7 8 9 10 |
Top |
Related drugs of malignant transformation related genes |
| Identification of chemicals and drugs interact with genes involved in malignant transfromation |
| (DGIdb 4.0) |
| Entrez ID | Symbol | Category | Interaction Types | Drug Claim Name | Drug Name | PMIDs |
| Page: 1 |

Copyright 2023-Present -The University of Texas Health Science Center at Houston |