
|
|||||
|
 | |
| |
| |
| |
| |
| |
|
Gene: THUMPD3 |
Gene summary for THUMPD3 |
| Gene information | Species | Human | Gene symbol | THUMPD3 | Gene ID | 25917 |
| Gene name | THUMP domain containing 3 | |
| Gene Alias | THUMPD3 | |
| Cytomap | 3p25.3 | |
| Gene Type | protein-coding | GO ID | GO:0001510 | UniProtAcc | A0A024R2F4 |
Top |
Malignant transformation analysis |
| Identification of the aberrant gene expression in precancerous and cancerous lesions by comparing the gene expression of stem-like cells in diseased tissues with normal stem cells |
| Entrez ID | Symbol | Replicates | Species | Organ | Tissue | Adj P-value | Log2FC | Malignancy |
| 25917 | THUMPD3 | LZE4T | Human | Esophagus | ESCC | 1.36e-08 | 2.04e-01 | 0.0811 |
| 25917 | THUMPD3 | LZE7T | Human | Esophagus | ESCC | 7.88e-04 | 1.38e-01 | 0.0667 |
| 25917 | THUMPD3 | LZE20T | Human | Esophagus | ESCC | 1.81e-02 | 3.92e-02 | 0.0662 |
| 25917 | THUMPD3 | LZE24T | Human | Esophagus | ESCC | 4.10e-11 | 2.02e-01 | 0.0596 |
| 25917 | THUMPD3 | LZE21T | Human | Esophagus | ESCC | 1.41e-02 | 1.49e-01 | 0.0655 |
| 25917 | THUMPD3 | LZE6T | Human | Esophagus | ESCC | 1.59e-03 | 2.09e-01 | 0.0845 |
| 25917 | THUMPD3 | P1T-E | Human | Esophagus | ESCC | 3.87e-09 | 3.42e-01 | 0.0875 |
| 25917 | THUMPD3 | P2T-E | Human | Esophagus | ESCC | 5.12e-30 | 4.29e-01 | 0.1177 |
| 25917 | THUMPD3 | P4T-E | Human | Esophagus | ESCC | 2.55e-28 | 6.15e-01 | 0.1323 |
| 25917 | THUMPD3 | P5T-E | Human | Esophagus | ESCC | 2.76e-36 | 7.00e-01 | 0.1327 |
| 25917 | THUMPD3 | P8T-E | Human | Esophagus | ESCC | 6.41e-15 | 2.38e-01 | 0.0889 |
| 25917 | THUMPD3 | P9T-E | Human | Esophagus | ESCC | 6.42e-05 | 1.58e-01 | 0.1131 |
| 25917 | THUMPD3 | P10T-E | Human | Esophagus | ESCC | 2.13e-13 | 2.21e-01 | 0.116 |
| 25917 | THUMPD3 | P11T-E | Human | Esophagus | ESCC | 1.07e-11 | 5.28e-01 | 0.1426 |
| 25917 | THUMPD3 | P12T-E | Human | Esophagus | ESCC | 5.35e-24 | 4.33e-01 | 0.1122 |
| 25917 | THUMPD3 | P15T-E | Human | Esophagus | ESCC | 1.40e-12 | 2.33e-01 | 0.1149 |
| 25917 | THUMPD3 | P16T-E | Human | Esophagus | ESCC | 3.81e-31 | 3.87e-01 | 0.1153 |
| 25917 | THUMPD3 | P17T-E | Human | Esophagus | ESCC | 8.38e-06 | 1.81e-01 | 0.1278 |
| 25917 | THUMPD3 | P19T-E | Human | Esophagus | ESCC | 3.09e-10 | 3.77e-01 | 0.1662 |
| 25917 | THUMPD3 | P20T-E | Human | Esophagus | ESCC | 1.98e-16 | 3.70e-01 | 0.1124 |
| Page: 1 2 3 4 5 6 |
| Tissue | Expression Dynamics | Abbreviation |
| Esophagus | 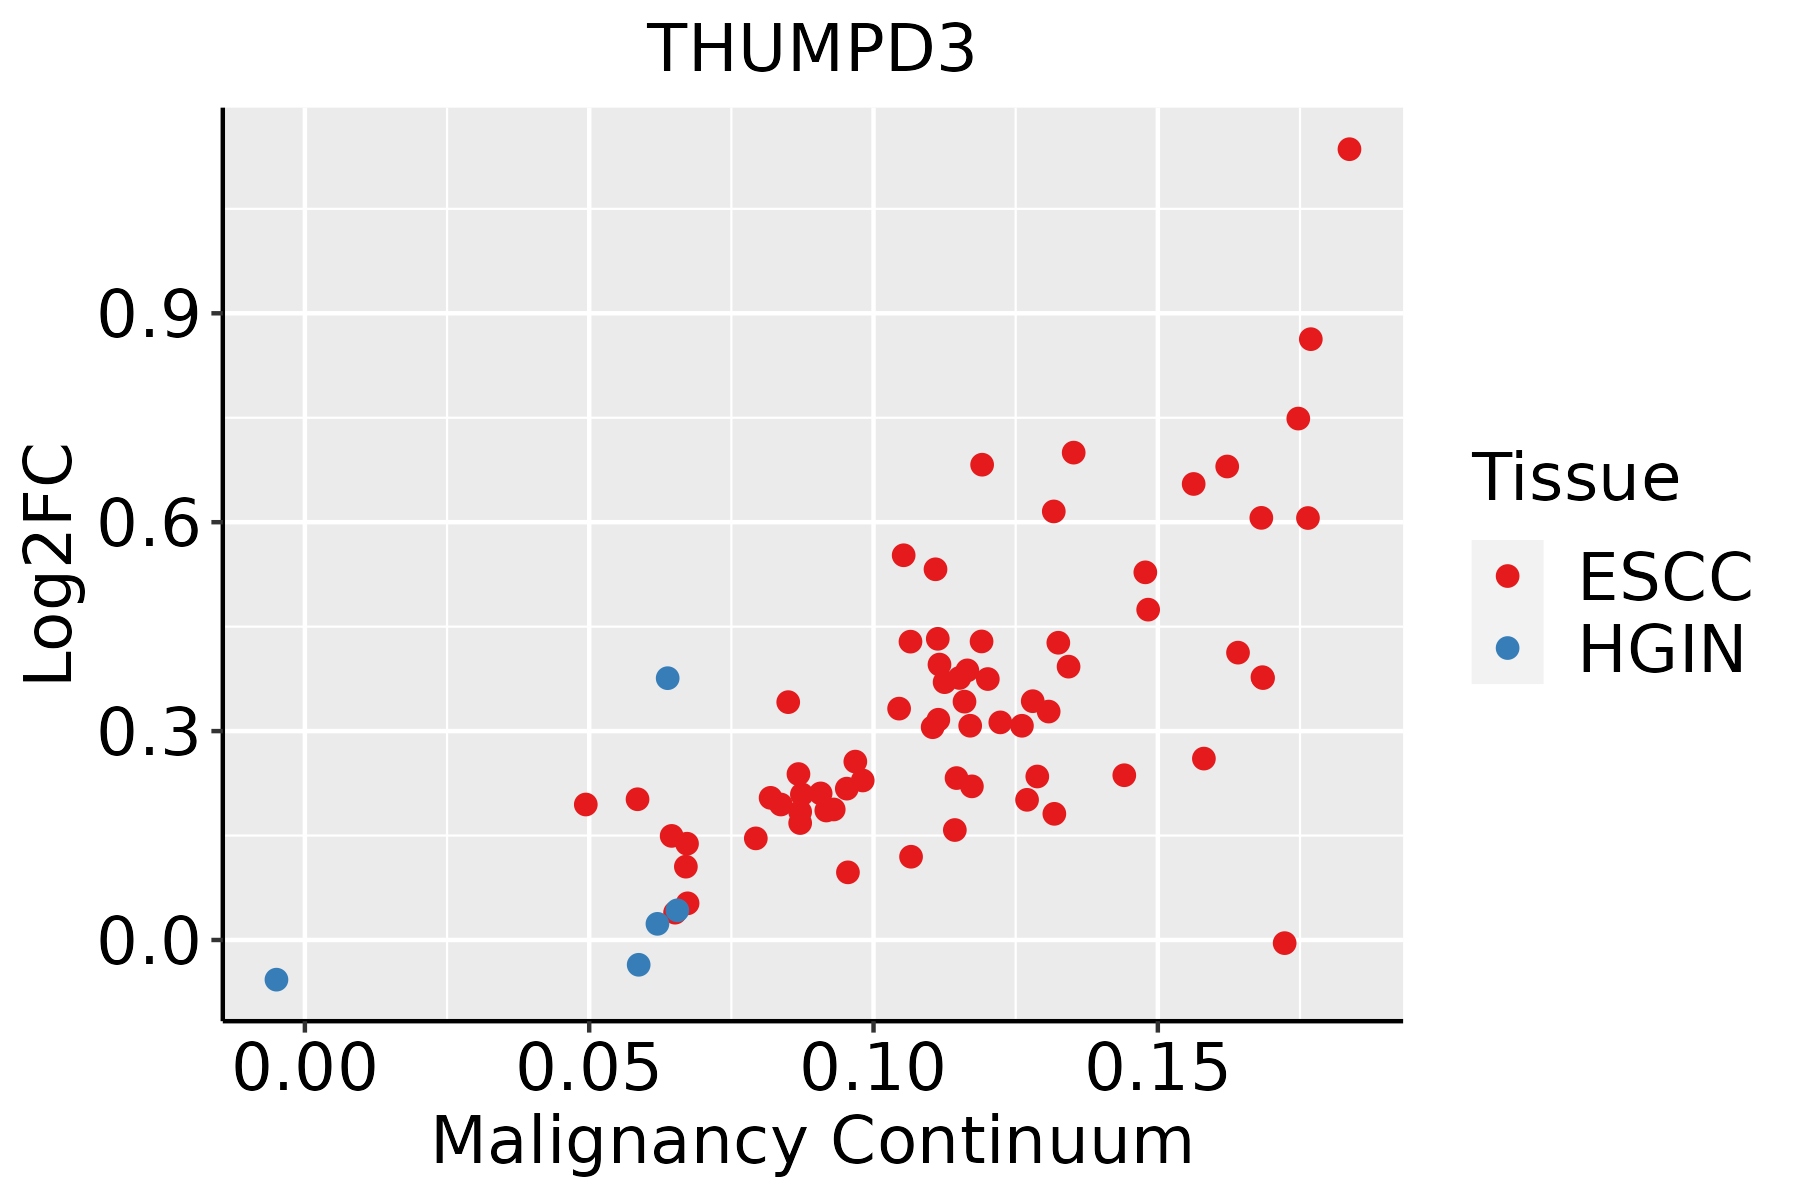 | ESCC: Esophageal squamous cell carcinoma |
| HGIN: High-grade intraepithelial neoplasias | ||
| LGIN: Low-grade intraepithelial neoplasias | ||
| Liver | 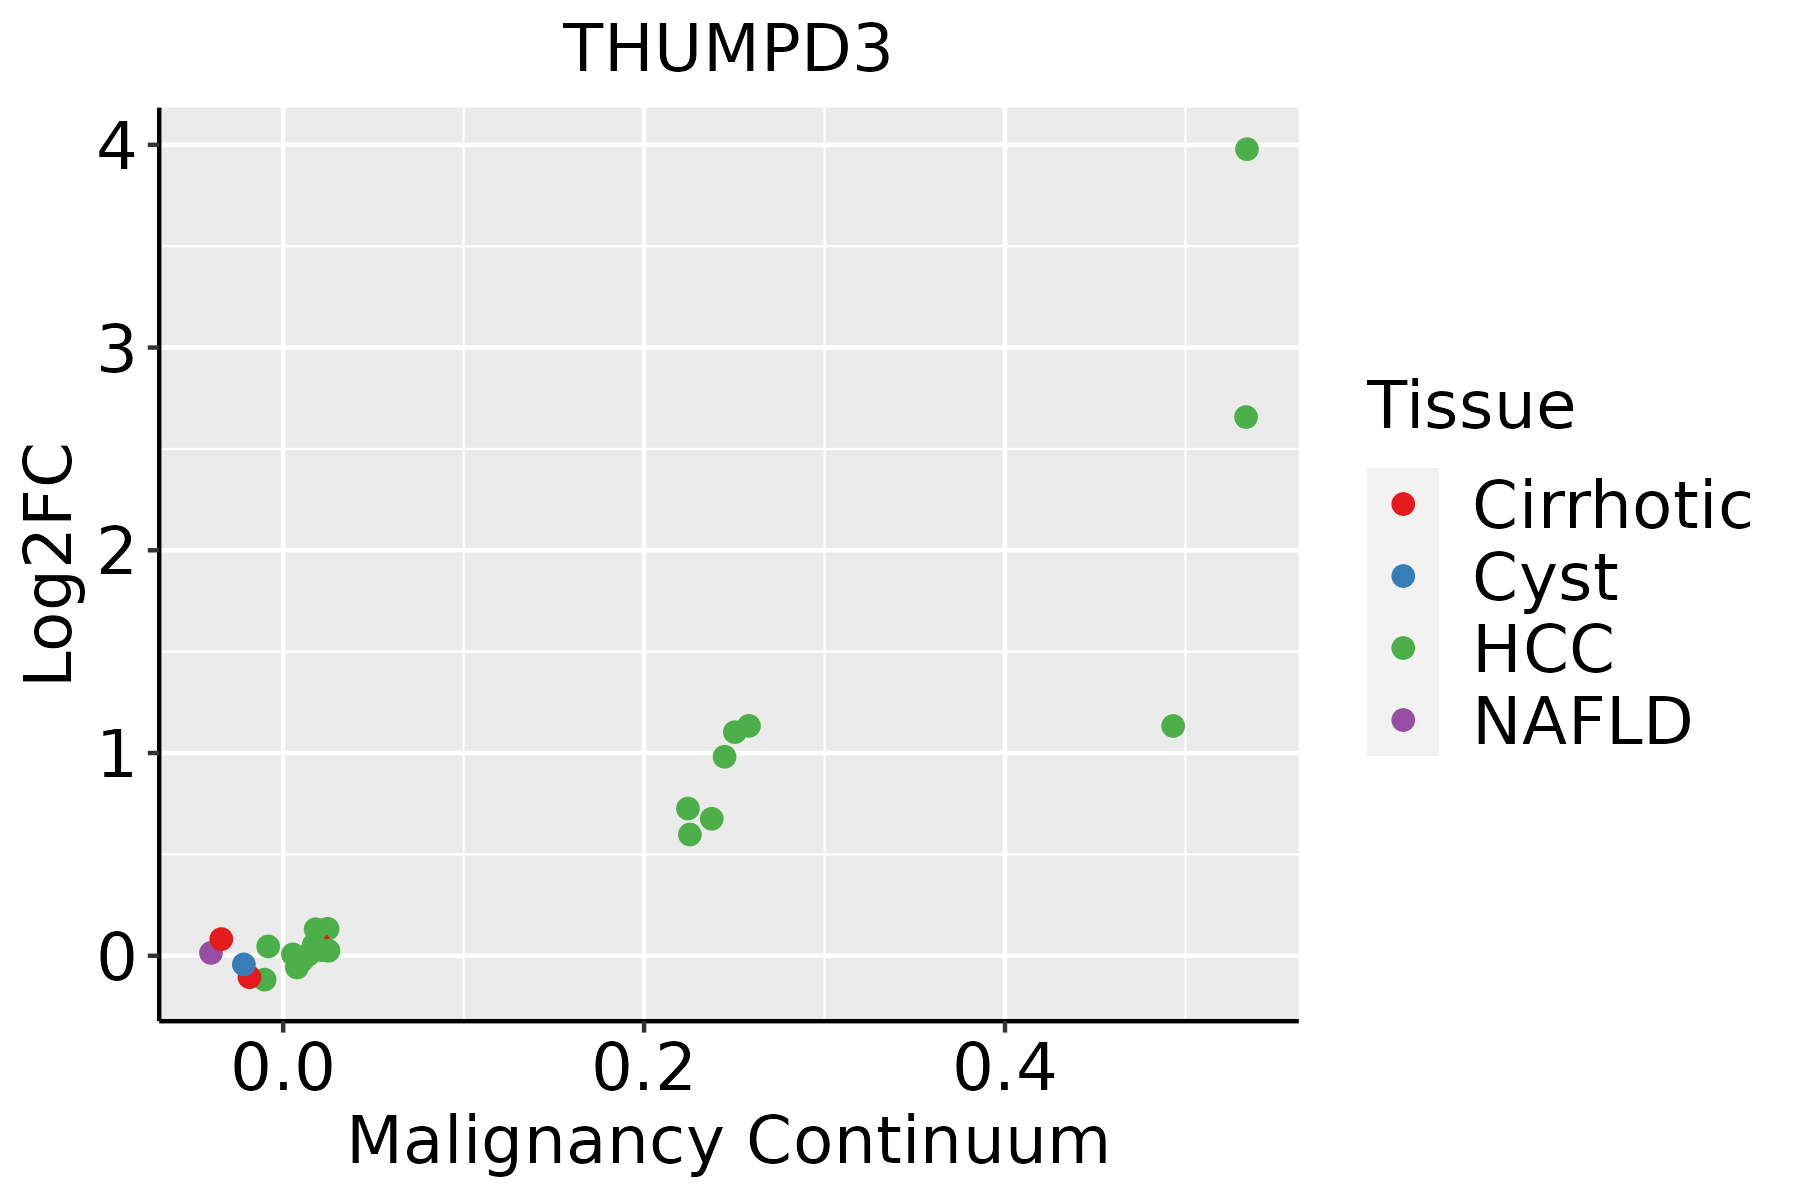 | HCC: Hepatocellular carcinoma |
| NAFLD: Non-alcoholic fatty liver disease | ||
| Oral Cavity |  | EOLP: Erosive Oral lichen planus |
| LP: leukoplakia | ||
| NEOLP: Non-erosive oral lichen planus | ||
| OSCC: Oral squamous cell carcinoma | ||
| Prostate | 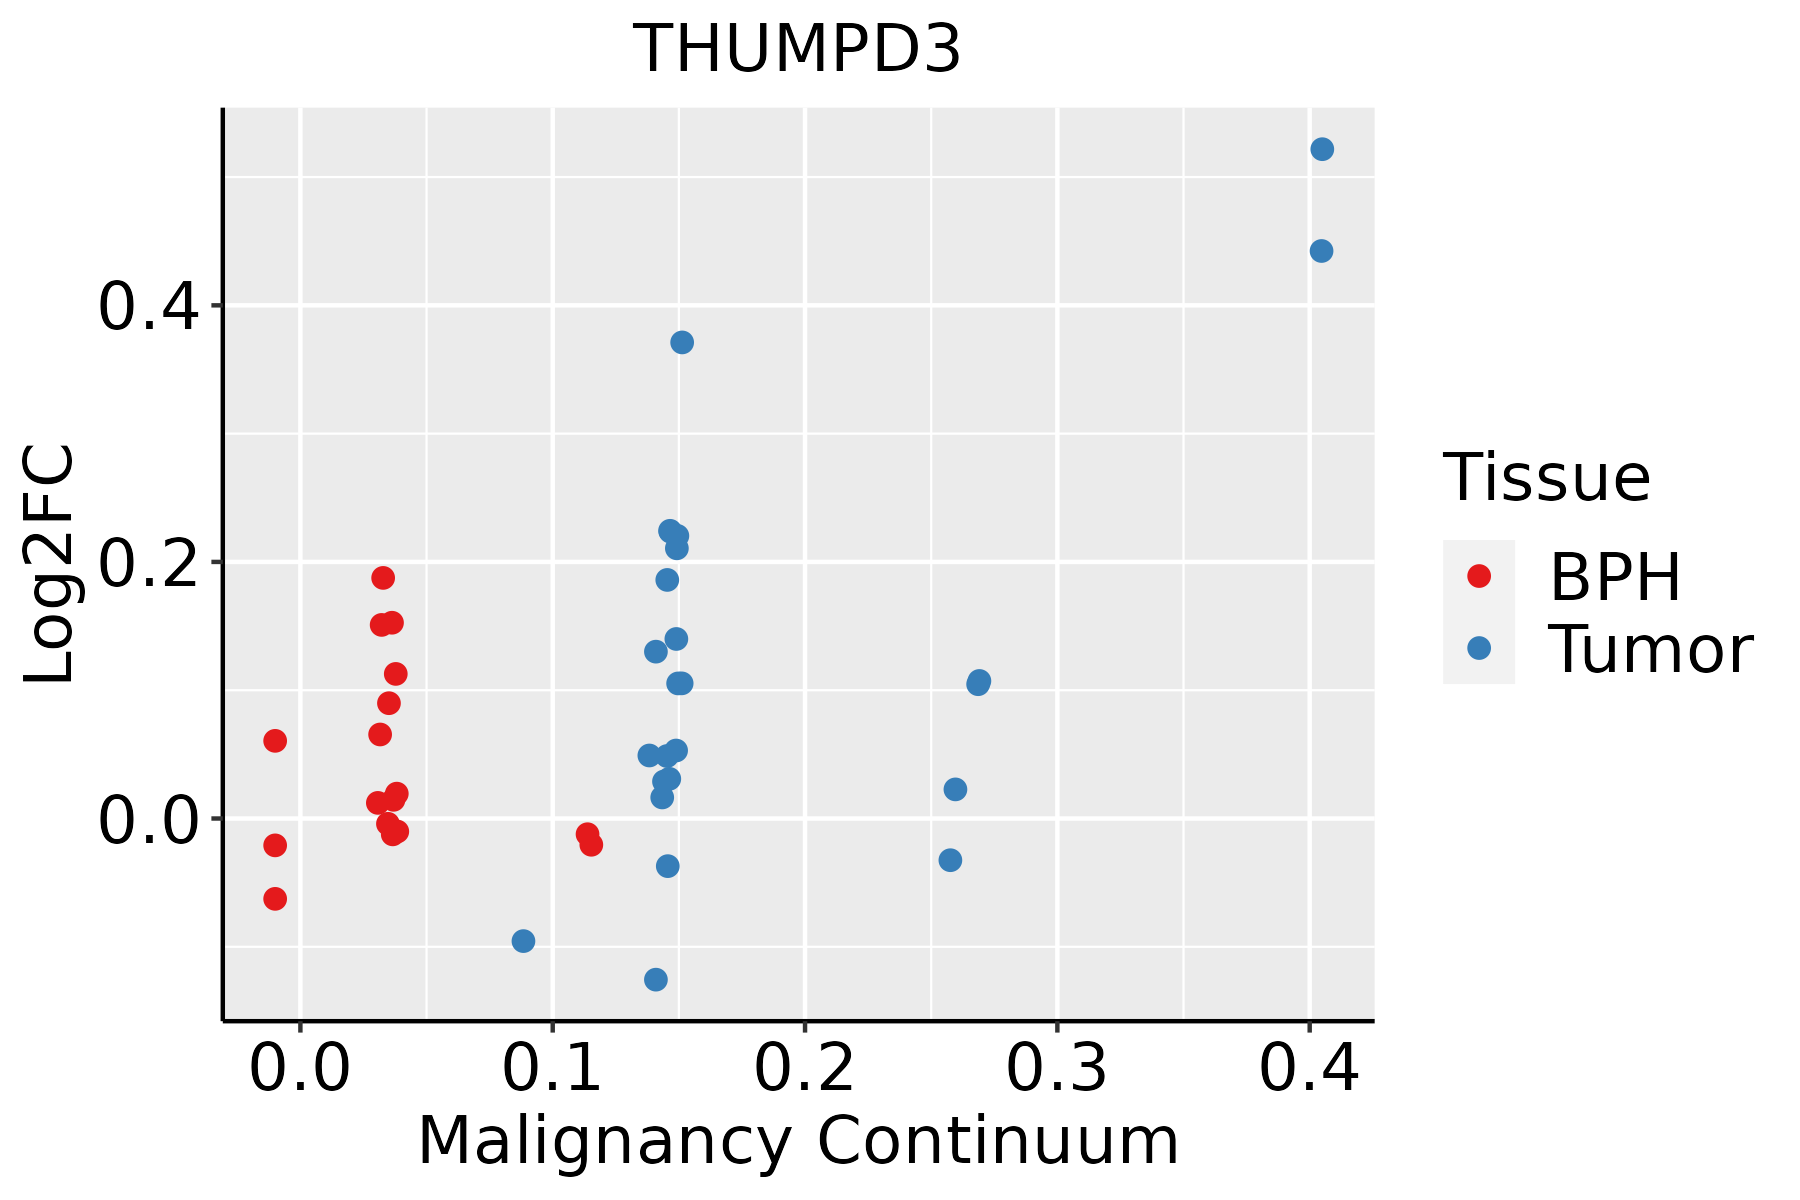 | BPH: Benign Prostatic Hyperplasia |
| Skin | 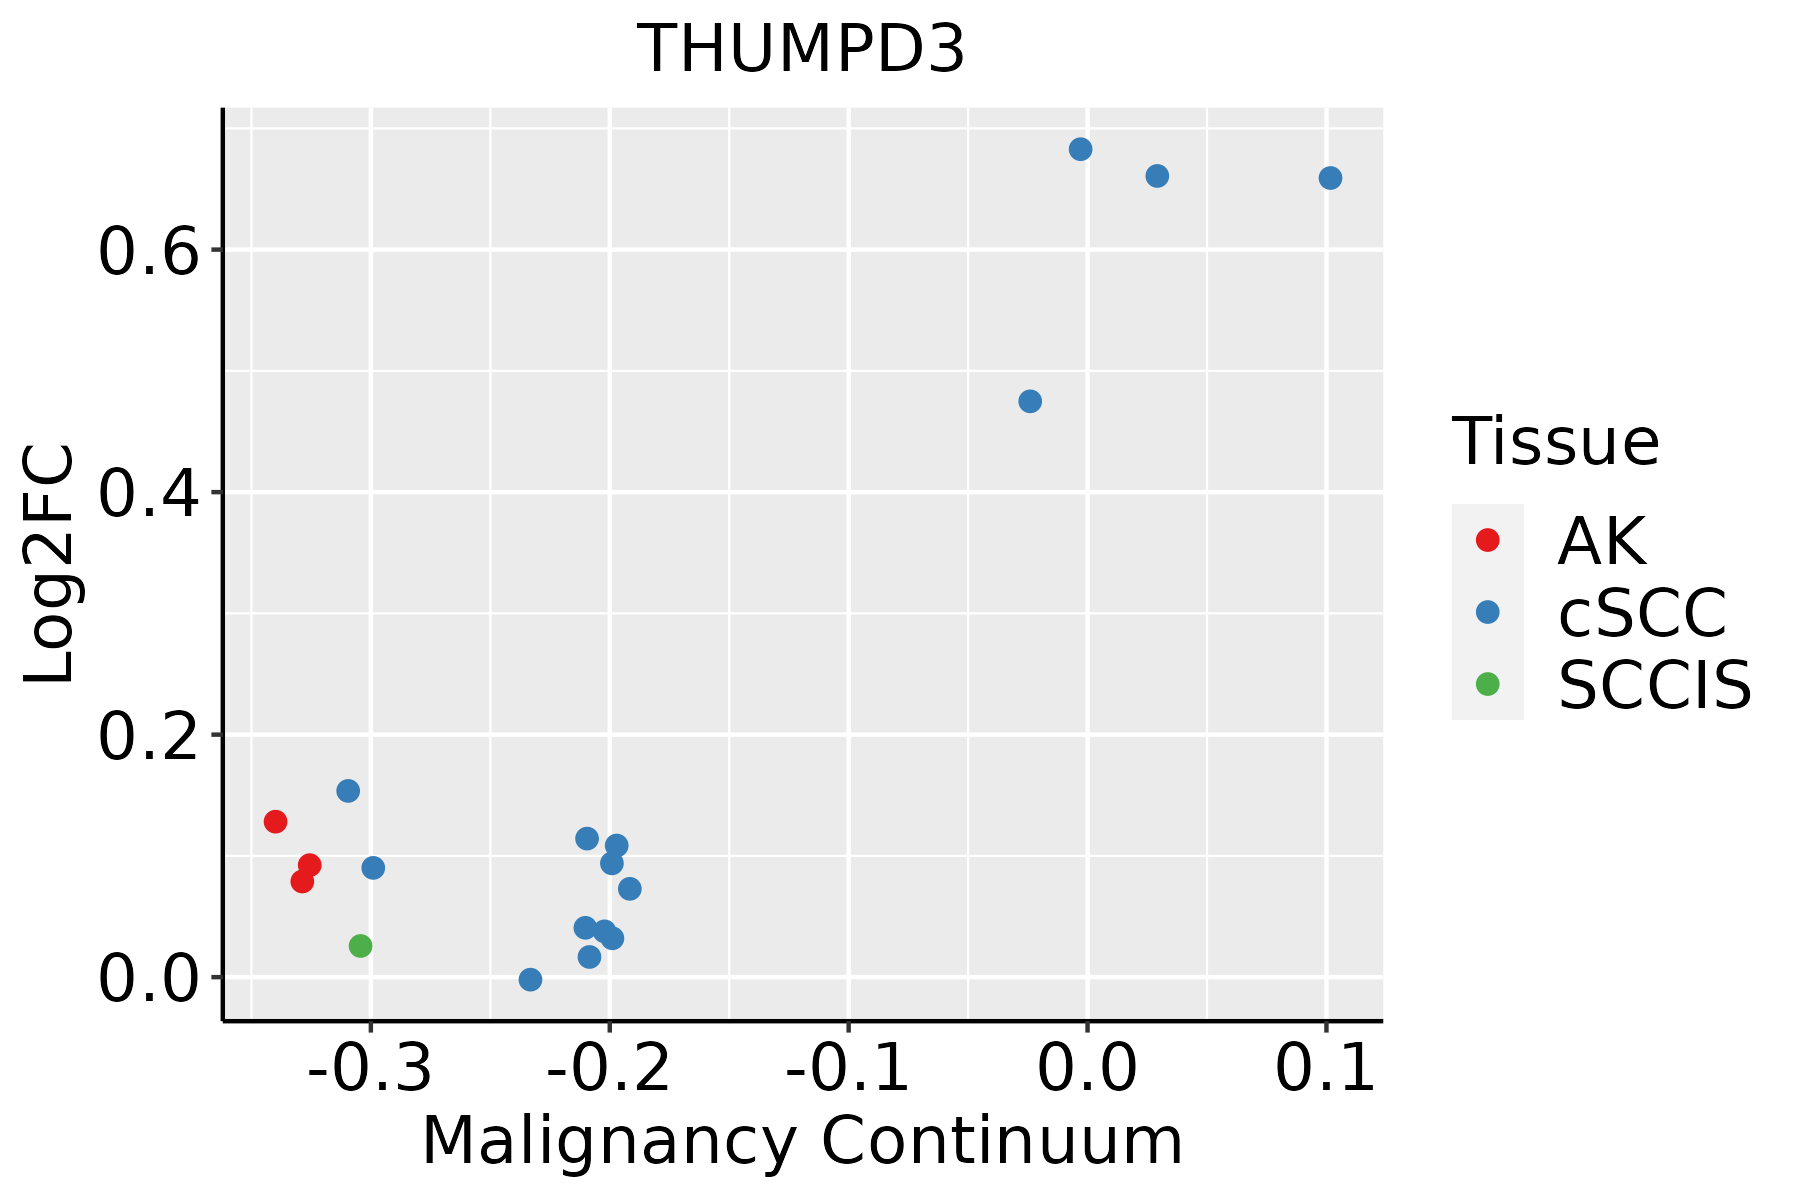 | AK: Actinic keratosis |
| cSCC: Cutaneous squamous cell carcinoma | ||
| SCCIS:squamous cell carcinoma in situ | ||
| Thyroid | 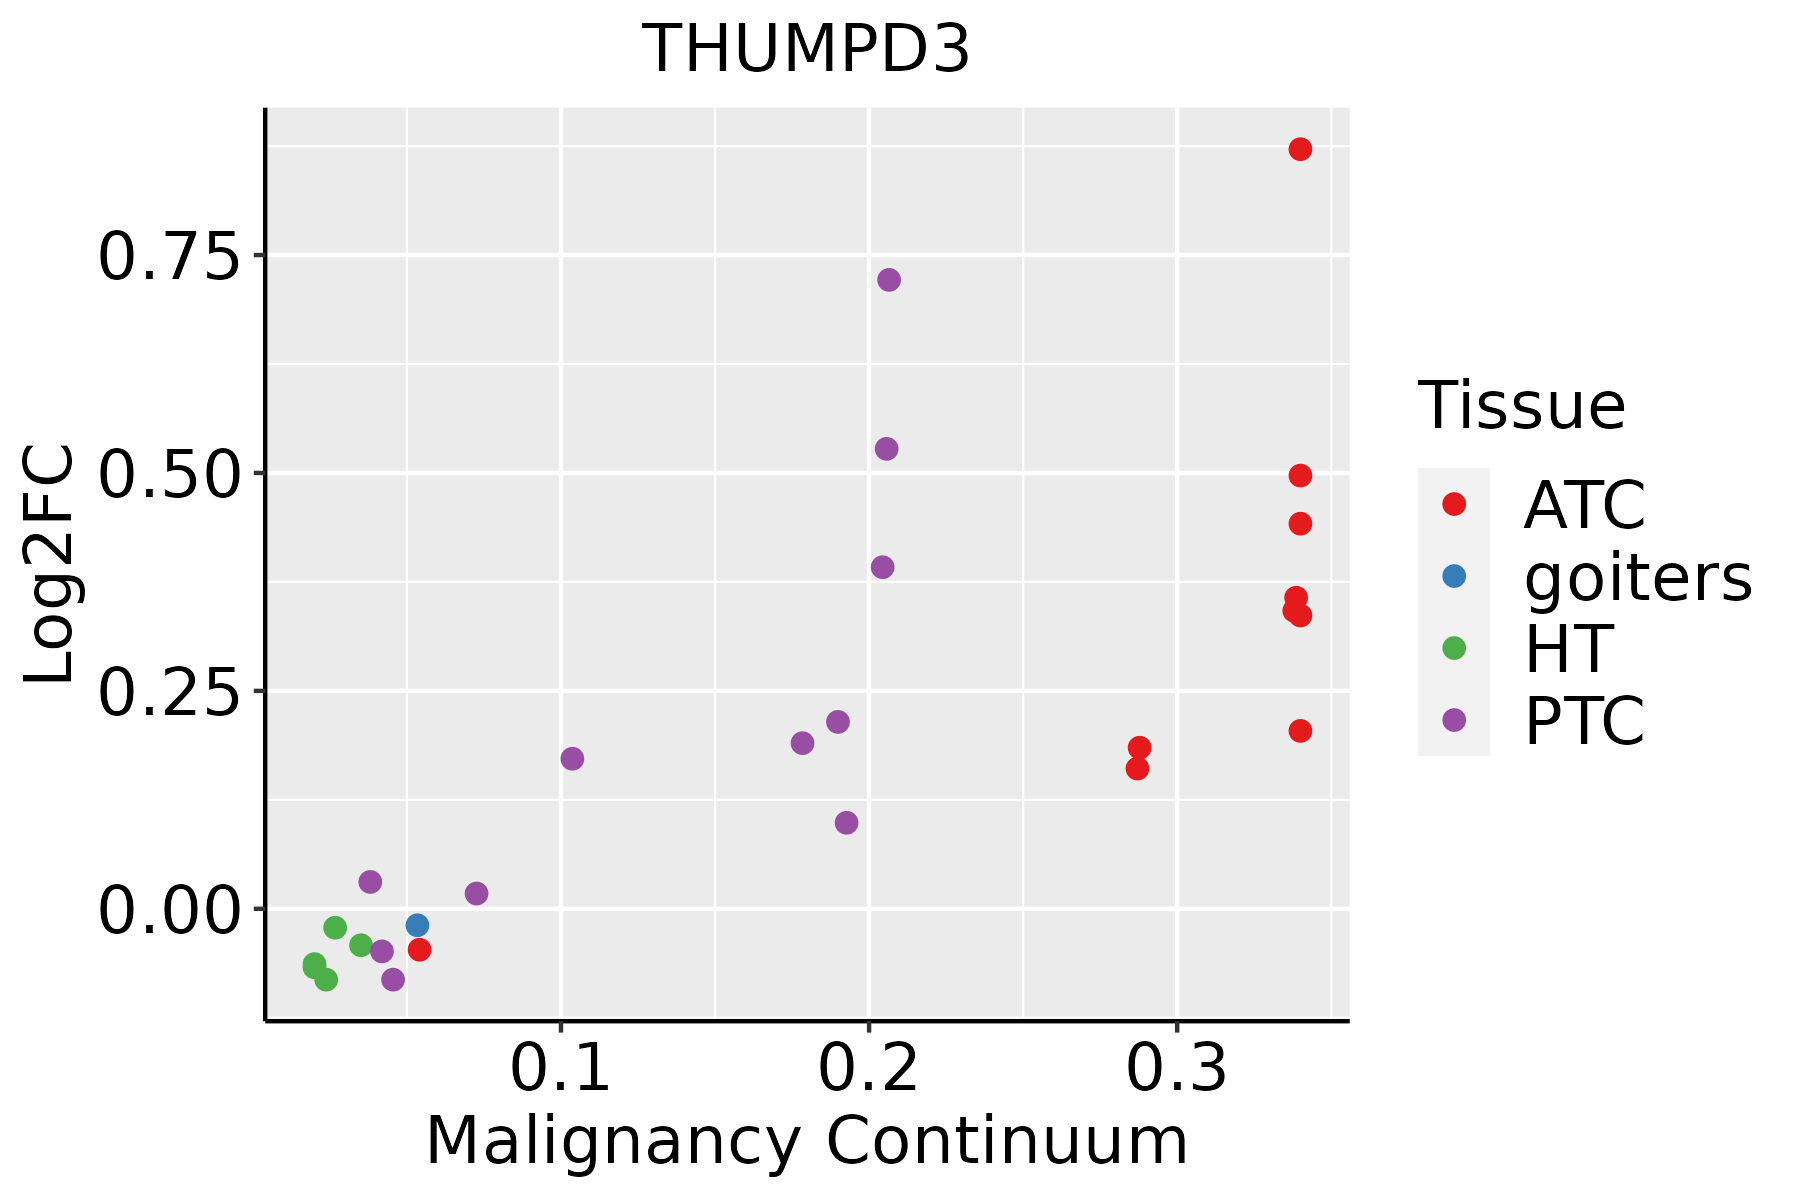 | ATC: Anaplastic thyroid cancer |
| HT: Hashimoto's thyroiditis | ||
| PTC: Papillary thyroid cancer |
| ∗log2FC in expression of this searched gene in stem-like cells from each diseased tissue sample relative to stem-like cells in normal samples in each tissue plotted against the malignancy continuum. Samples are colored based on if they are from different disease stage. |
Top |
Malignant transformation related pathway analysis |
| Find out the enriched GO biological processes and KEGG pathways involved in transition from healthy to precancer to cancer |
| Tissue | Disease Stage | Enriched GO biological Processes |
| Colorectum | AD |  |
| Colorectum | SER |  |
| Colorectum | MSS |  |
| Colorectum | MSI-H |  |
| Colorectum | FAP |  |
| ∗Top 15 enriched GO BP terms are showed in the bar plot of each disease state in each tissue. Each row represents a significant GO biological process which is colored according to the -log10(p.adjust). |
| Page: 1 2 3 4 5 6 7 8 9 |
| GO ID | Tissue | Disease Stage | Description | Gene Ratio | Bg Ratio | pvalue | p.adjust | Count |
| GO:003447021 | Thyroid | ATC | ncRNA processing | 216/6293 | 395/18723 | 3.14e-18 | 3.98e-16 | 216 |
| GO:003466021 | Thyroid | ATC | ncRNA metabolic process | 240/6293 | 485/18723 | 2.03e-13 | 9.91e-12 | 240 |
| GO:004341412 | Thyroid | ATC | macromolecule methylation | 131/6293 | 316/18723 | 2.01e-03 | 9.60e-03 | 131 |
| GO:003225911 | Thyroid | ATC | methylation | 148/6293 | 364/18723 | 2.69e-03 | 1.23e-02 | 148 |
| Page: 1 2 3 |
| Pathway ID | Tissue | Disease Stage | Description | Gene Ratio | Bg Ratio | pvalue | p.adjust | qvalue | Count |
| Page: 1 |
Top |
Cell-cell communication analysis |
| Identification of potential cell-cell interactions between two cell types and their ligand-receptor pairs for different disease states |
| Ligand | Receptor | LRpair | Pathway | Tissue | Disease Stage |
| Page: 1 |
Top |
Single-cell gene regulatory network inference analysis |
| Find out the significant the regulons (TFs) and the target genes of each regulon across cell types for different disease states |
| TF | Cell Type | Tissue | Disease Stage | Target Gene | RSS | Regulon Activity |
| ∗The dot plots of a searched regulon are shown for all cell subpopulations in each disease state of each tissue based on the regulon specific score inferred using pySCENIC and by calculating the average expression. |
| Page: 1 |
Top |
Somatic mutation of malignant transformation related genes |
| Annotation of somatic variants for genes involved in malignant transformation |
| Hugo Symbol | Variant Class | Variant Classification | dbSNP RS | HGVSc | HGVSp | HGVSp Short | SWISSPROT | BIOTYPE | SIFT | PolyPhen | Tumor Sample Barcode | Tissue | Histology | Sex | Age | Stage | Therapy Types | Drugs | Outcome |
| THUMPD3 | SNV | Missense_Mutation | novel | c.991N>T | p.Gly331Trp | p.G331W | Q9BV44 | protein_coding | deleterious(0.01) | probably_damaging(1) | TCGA-A7-A0DB-01 | Breast | breast invasive carcinoma | Female | <65 | I/II | Hormone Therapy | arimidex | SD |
| THUMPD3 | SNV | Missense_Mutation | novel | c.120N>G | p.Ile40Met | p.I40M | Q9BV44 | protein_coding | deleterious(0) | possibly_damaging(0.826) | TCGA-A8-A095-01 | Breast | breast invasive carcinoma | Female | <65 | I/II | Chemotherapy | 5-fluorouracil | CR |
| THUMPD3 | SNV | Missense_Mutation | novel | c.1285N>A | p.Glu429Lys | p.E429K | Q9BV44 | protein_coding | deleterious(0) | probably_damaging(0.999) | TCGA-D8-A1JS-01 | Breast | breast invasive carcinoma | Female | >=65 | I/II | Hormone Therapy | tamoxiphen | SD |
| THUMPD3 | SNV | Missense_Mutation | rs766648779 | c.526A>T | p.Thr176Ser | p.T176S | Q9BV44 | protein_coding | tolerated(0.77) | benign(0) | TCGA-E2-A1L8-01 | Breast | breast invasive carcinoma | Female | <65 | I/II | Chemotherapy | cyclophosphamide | SD |
| THUMPD3 | insertion | Nonsense_Mutation | novel | c.166_167insAGATCTTGTGAGACTTATTCACTACCACAAGAACAGTA | p.Val56GlufsTer4 | p.V56Efs*4 | Q9BV44 | protein_coding | TCGA-B6-A0IK-01 | Breast | breast invasive carcinoma | Female | <65 | III/IV | Unknown | Unknown | PD | ||
| THUMPD3 | SNV | Missense_Mutation | novel | c.31N>T | p.Leu11Phe | p.L11F | Q9BV44 | protein_coding | tolerated_low_confidence(0.14) | benign(0.007) | TCGA-C5-A2LV-01 | Cervix | cervical & endocervical cancer | Female | <65 | I/II | Unknown | Unknown | SD |
| THUMPD3 | SNV | Missense_Mutation | novel | c.977N>A | p.Pro326Gln | p.P326Q | Q9BV44 | protein_coding | deleterious(0) | probably_damaging(0.998) | TCGA-AA-3947-01 | Colorectum | colon adenocarcinoma | Female | <65 | I/II | Unknown | Unknown | SD |
| THUMPD3 | SNV | Missense_Mutation | c.1114A>T | p.Ile372Phe | p.I372F | Q9BV44 | protein_coding | tolerated(0.05) | possibly_damaging(0.49) | TCGA-AA-A010-01 | Colorectum | colon adenocarcinoma | Female | <65 | I/II | Chemotherapy | folinic | CR | |
| THUMPD3 | SNV | Missense_Mutation | c.1519G>A | p.Glu507Lys | p.E507K | Q9BV44 | protein_coding | tolerated_low_confidence(0.05) | benign(0) | TCGA-AA-A010-01 | Colorectum | colon adenocarcinoma | Female | <65 | I/II | Chemotherapy | folinic | CR | |
| THUMPD3 | SNV | Missense_Mutation | rs140248268 | c.541N>T | p.Asp181Tyr | p.D181Y | Q9BV44 | protein_coding | deleterious(0) | possibly_damaging(0.564) | TCGA-CA-6717-01 | Colorectum | colon adenocarcinoma | Male | <65 | I/II | Chemotherapy | oxaliplatin | CR |
| Page: 1 2 3 4 |
Top |
Related drugs of malignant transformation related genes |
| Identification of chemicals and drugs interact with genes involved in malignant transfromation |
| (DGIdb 4.0) |
| Entrez ID | Symbol | Category | Interaction Types | Drug Claim Name | Drug Name | PMIDs |
| Page: 1 |

Copyright 2023-Present -The University of Texas Health Science Center at Houston |