
|
|||||
|
 | |
| |
| |
| |
| |
| |
|
Gene: TFDP1 |
Gene summary for TFDP1 |
| Gene information | Species | Human | Gene symbol | TFDP1 | Gene ID | 7027 |
| Gene name | transcription factor Dp-1 | |
| Gene Alias | DILC | |
| Cytomap | 13q34 | |
| Gene Type | protein-coding | GO ID | GO:0000082 | UniProtAcc | A0A024RDY4 |
Top |
Malignant transformation analysis |
| Identification of the aberrant gene expression in precancerous and cancerous lesions by comparing the gene expression of stem-like cells in diseased tissues with normal stem cells |
| Entrez ID | Symbol | Replicates | Species | Organ | Tissue | Adj P-value | Log2FC | Malignancy |
| 7027 | TFDP1 | LZE8T | Human | Esophagus | ESCC | 6.63e-03 | 1.35e-01 | 0.067 |
| 7027 | TFDP1 | LZE24T | Human | Esophagus | ESCC | 2.26e-02 | 2.38e-02 | 0.0596 |
| 7027 | TFDP1 | P2T-E | Human | Esophagus | ESCC | 1.34e-29 | 7.15e-01 | 0.1177 |
| 7027 | TFDP1 | P4T-E | Human | Esophagus | ESCC | 6.35e-29 | 9.09e-01 | 0.1323 |
| 7027 | TFDP1 | P5T-E | Human | Esophagus | ESCC | 3.39e-26 | 5.33e-01 | 0.1327 |
| 7027 | TFDP1 | P8T-E | Human | Esophagus | ESCC | 5.43e-27 | 5.61e-01 | 0.0889 |
| 7027 | TFDP1 | P9T-E | Human | Esophagus | ESCC | 4.59e-05 | 1.59e-01 | 0.1131 |
| 7027 | TFDP1 | P10T-E | Human | Esophagus | ESCC | 2.01e-23 | 5.35e-01 | 0.116 |
| 7027 | TFDP1 | P11T-E | Human | Esophagus | ESCC | 7.15e-08 | 6.76e-01 | 0.1426 |
| 7027 | TFDP1 | P12T-E | Human | Esophagus | ESCC | 8.80e-22 | 4.38e-01 | 0.1122 |
| 7027 | TFDP1 | P15T-E | Human | Esophagus | ESCC | 3.02e-12 | 2.49e-01 | 0.1149 |
| 7027 | TFDP1 | P16T-E | Human | Esophagus | ESCC | 2.59e-26 | 6.11e-01 | 0.1153 |
| 7027 | TFDP1 | P17T-E | Human | Esophagus | ESCC | 7.25e-09 | 3.35e-01 | 0.1278 |
| 7027 | TFDP1 | P19T-E | Human | Esophagus | ESCC | 7.53e-05 | 5.84e-01 | 0.1662 |
| 7027 | TFDP1 | P20T-E | Human | Esophagus | ESCC | 1.10e-13 | 3.12e-01 | 0.1124 |
| 7027 | TFDP1 | P21T-E | Human | Esophagus | ESCC | 1.56e-27 | 6.01e-01 | 0.1617 |
| 7027 | TFDP1 | P22T-E | Human | Esophagus | ESCC | 2.03e-10 | 2.32e-01 | 0.1236 |
| 7027 | TFDP1 | P23T-E | Human | Esophagus | ESCC | 3.24e-11 | 2.89e-01 | 0.108 |
| 7027 | TFDP1 | P24T-E | Human | Esophagus | ESCC | 2.03e-15 | 3.28e-01 | 0.1287 |
| 7027 | TFDP1 | P26T-E | Human | Esophagus | ESCC | 8.84e-11 | 2.67e-01 | 0.1276 |
| Page: 1 2 3 4 5 |
| Tissue | Expression Dynamics | Abbreviation |
| Esophagus | 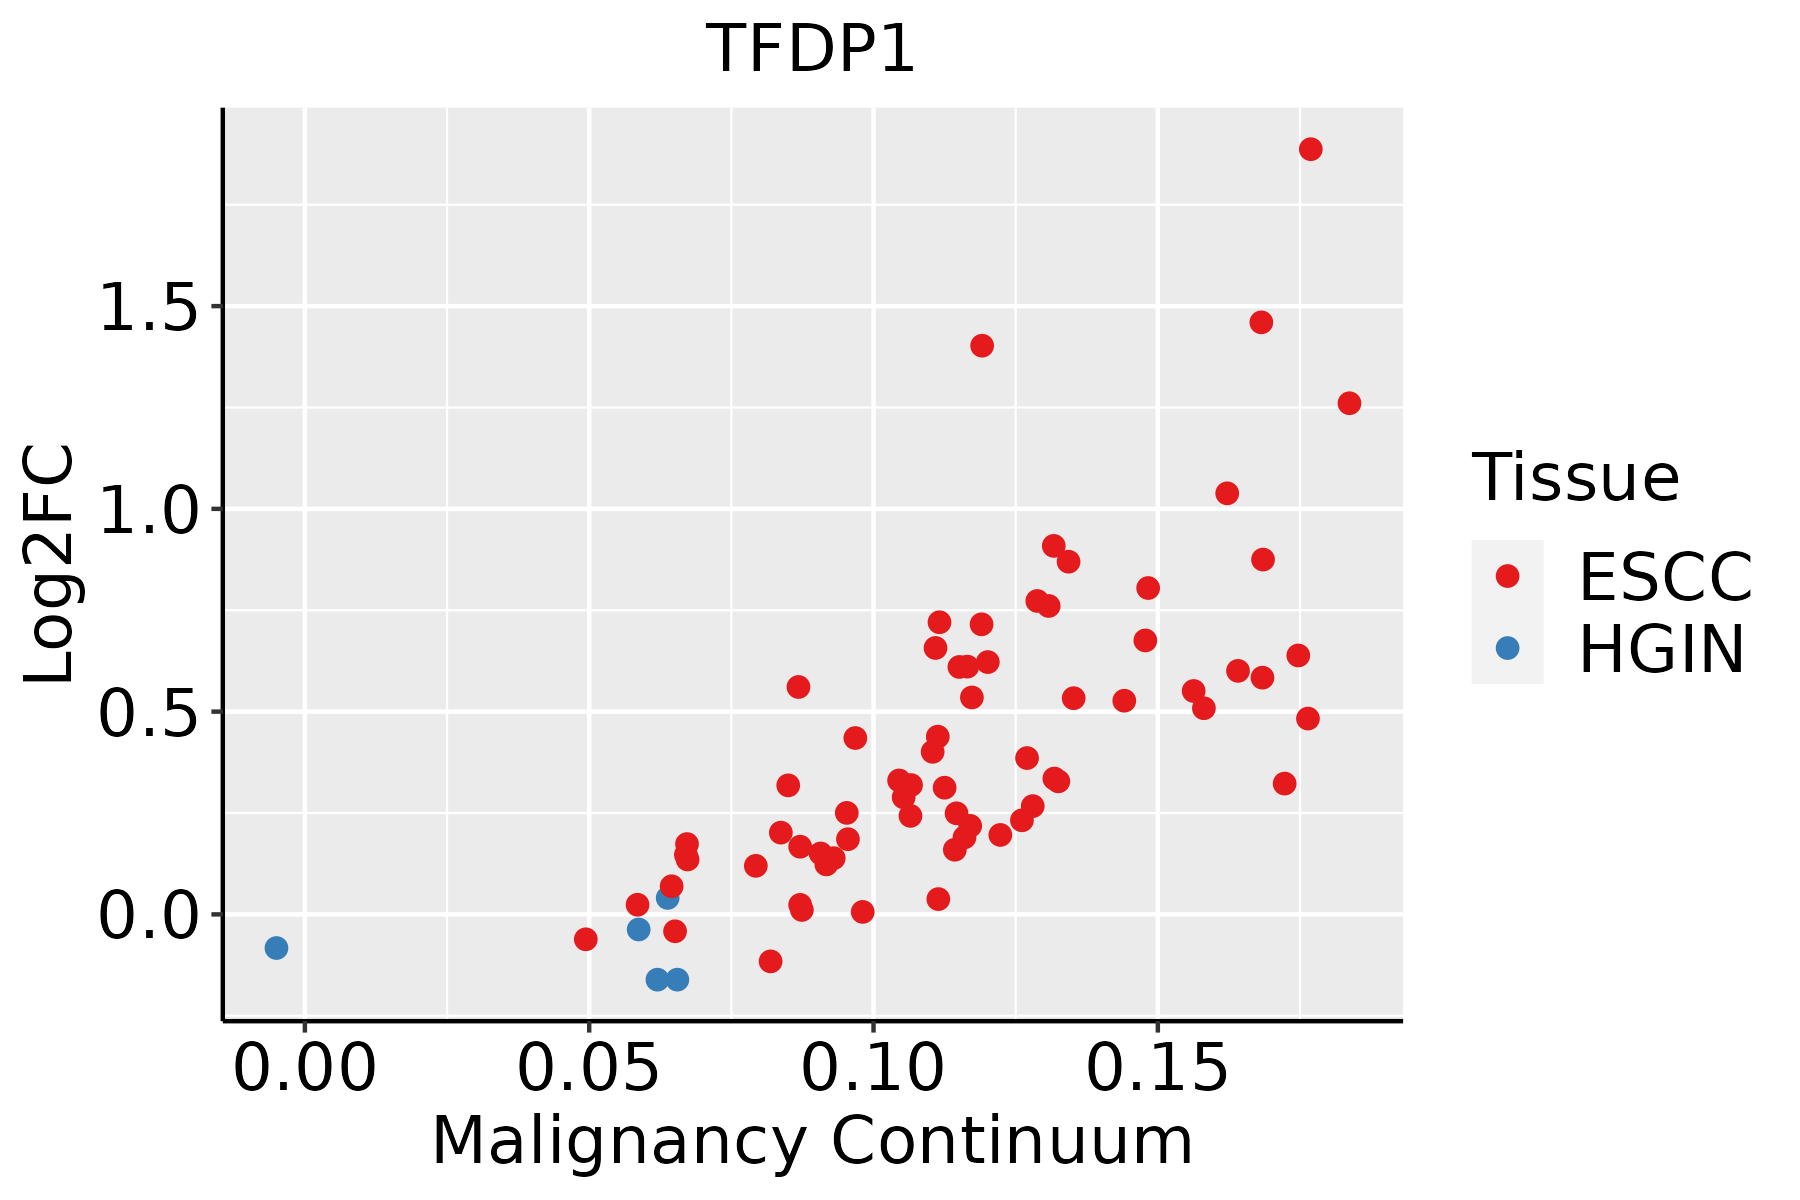 | ESCC: Esophageal squamous cell carcinoma |
| HGIN: High-grade intraepithelial neoplasias | ||
| LGIN: Low-grade intraepithelial neoplasias | ||
| Oral Cavity | 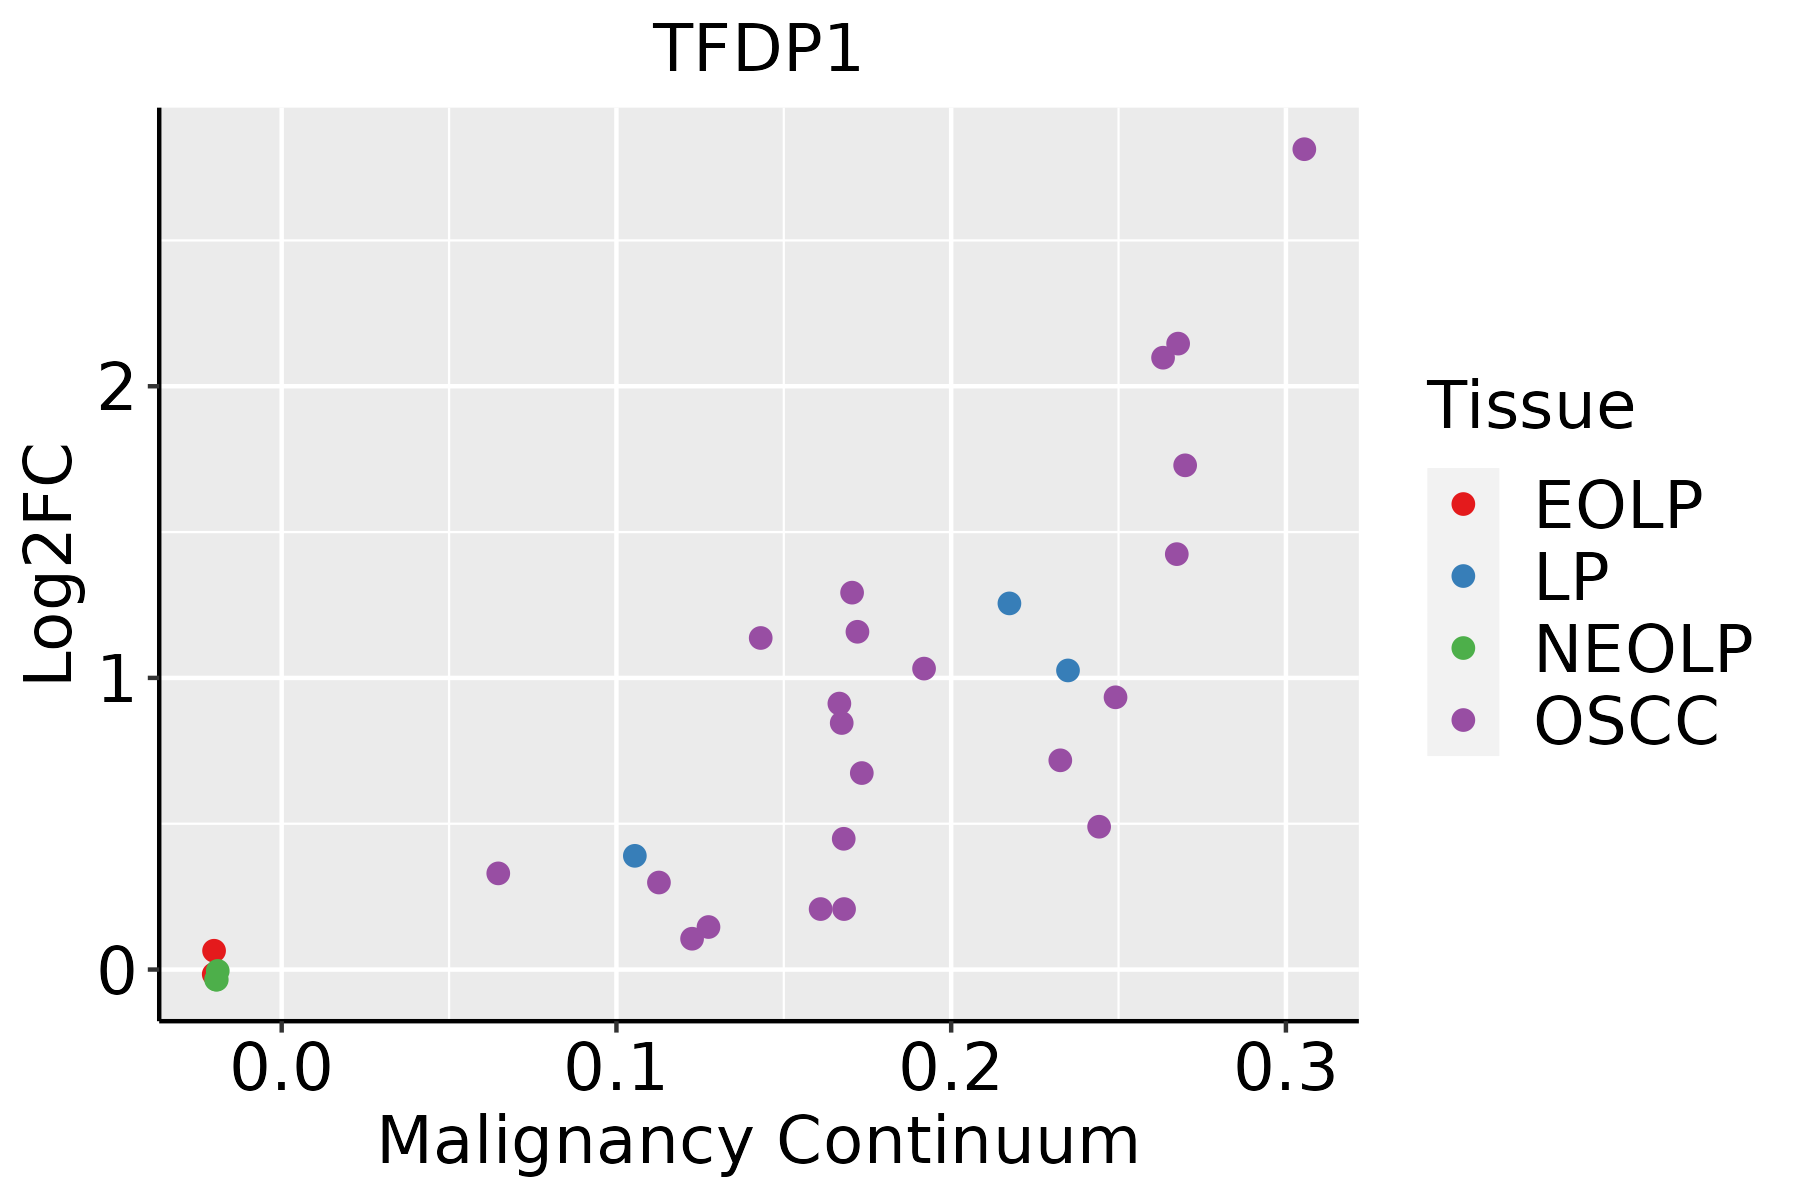 | EOLP: Erosive Oral lichen planus |
| LP: leukoplakia | ||
| NEOLP: Non-erosive oral lichen planus | ||
| OSCC: Oral squamous cell carcinoma | ||
| Skin | 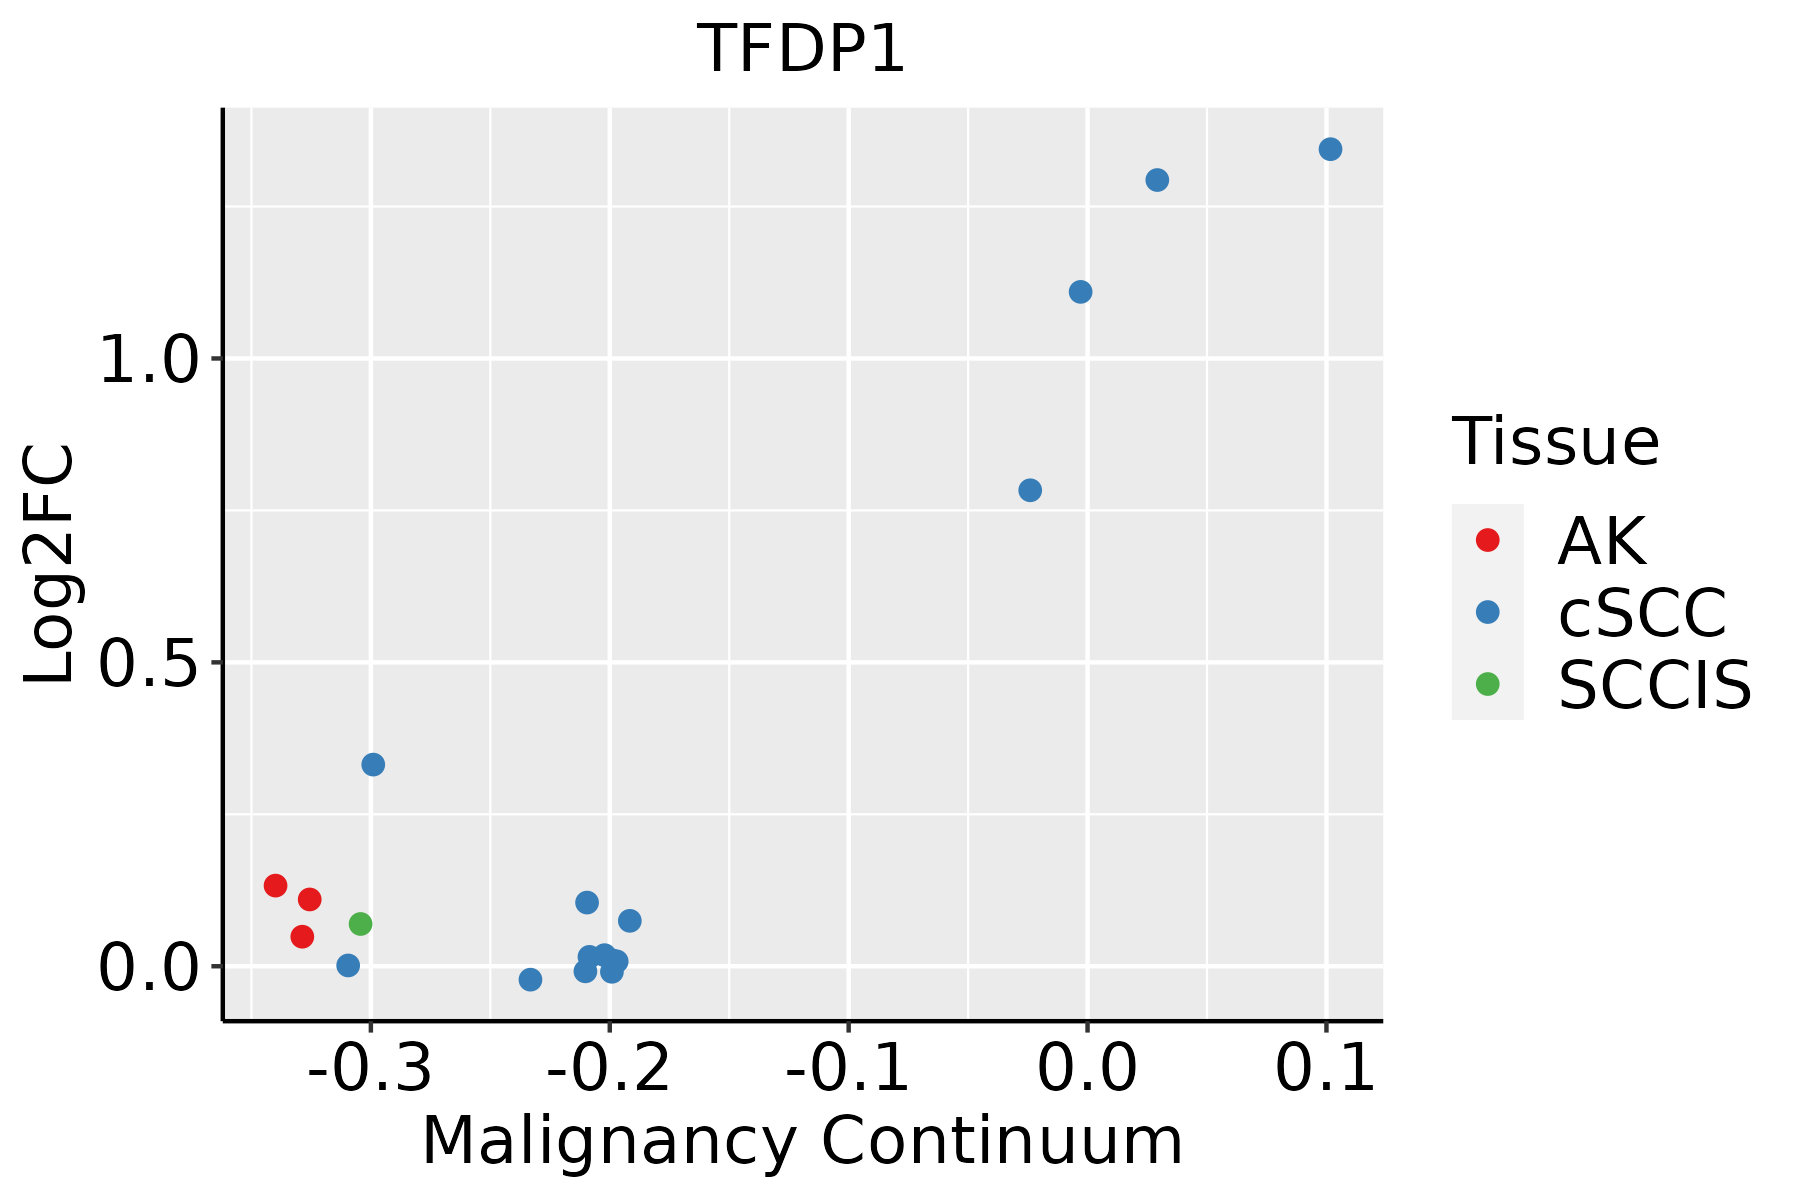 | AK: Actinic keratosis |
| cSCC: Cutaneous squamous cell carcinoma | ||
| SCCIS:squamous cell carcinoma in situ |
| ∗log2FC in expression of this searched gene in stem-like cells from each diseased tissue sample relative to stem-like cells in normal samples in each tissue plotted against the malignancy continuum. Samples are colored based on if they are from different disease stage. |
Top |
Malignant transformation related pathway analysis |
| Find out the enriched GO biological processes and KEGG pathways involved in transition from healthy to precancer to cancer |
| Tissue | Disease Stage | Enriched GO biological Processes |
| Colorectum | AD |  |
| Colorectum | SER |  |
| Colorectum | MSS |  |
| Colorectum | MSI-H |  |
| Colorectum | FAP |  |
| ∗Top 15 enriched GO BP terms are showed in the bar plot of each disease state in each tissue. Each row represents a significant GO biological process which is colored according to the -log10(p.adjust). |
| Page: 1 2 3 4 5 6 7 8 9 |
| GO ID | Tissue | Disease Stage | Description | Gene Ratio | Bg Ratio | pvalue | p.adjust | Count |
| GO:000734614 | Oral cavity | LP | regulation of mitotic cell cycle | 163/4623 | 457/18723 | 7.64e-08 | 2.56e-06 | 163 |
| GO:004477215 | Oral cavity | LP | mitotic cell cycle phase transition | 150/4623 | 424/18723 | 4.38e-07 | 1.23e-05 | 150 |
| GO:007189715 | Oral cavity | LP | DNA biosynthetic process | 71/4623 | 180/18723 | 8.04e-06 | 1.52e-04 | 71 |
| GO:005105213 | Oral cavity | LP | regulation of DNA metabolic process | 125/4623 | 359/18723 | 9.43e-06 | 1.75e-04 | 125 |
| GO:005109015 | Oral cavity | LP | regulation of DNA-binding transcription factor activity | 147/4623 | 440/18723 | 2.00e-05 | 3.35e-04 | 147 |
| GO:000008213 | Oral cavity | LP | G1/S transition of mitotic cell cycle | 80/4623 | 214/18723 | 2.30e-05 | 3.74e-04 | 80 |
| GO:004484313 | Oral cavity | LP | cell cycle G1/S phase transition | 88/4623 | 241/18723 | 2.62e-05 | 4.21e-04 | 88 |
| GO:000854416 | Oral cavity | LP | epidermis development | 112/4623 | 324/18723 | 3.81e-05 | 5.61e-04 | 112 |
| GO:200027818 | Oral cavity | LP | regulation of DNA biosynthetic process | 45/4623 | 106/18723 | 4.42e-05 | 6.30e-04 | 45 |
| GO:190199012 | Oral cavity | LP | regulation of mitotic cell cycle phase transition | 104/4623 | 299/18723 | 5.34e-05 | 7.41e-04 | 104 |
| GO:190198712 | Oral cavity | LP | regulation of cell cycle phase transition | 126/4623 | 390/18723 | 3.69e-04 | 3.64e-03 | 126 |
| GO:004593115 | Oral cavity | LP | positive regulation of mitotic cell cycle | 46/4623 | 121/18723 | 7.65e-04 | 6.80e-03 | 46 |
| GO:005109114 | Oral cavity | LP | positive regulation of DNA-binding transcription factor activity | 86/4623 | 260/18723 | 1.35e-03 | 1.08e-02 | 86 |
| GO:190280612 | Oral cavity | LP | regulation of cell cycle G1/S phase transition | 59/4623 | 168/18723 | 1.55e-03 | 1.20e-02 | 59 |
| GO:200004512 | Oral cavity | LP | regulation of G1/S transition of mitotic cell cycle | 51/4623 | 142/18723 | 1.81e-03 | 1.37e-02 | 51 |
| GO:190198912 | Oral cavity | LP | positive regulation of cell cycle phase transition | 42/4623 | 115/18723 | 3.06e-03 | 2.09e-02 | 42 |
| GO:190199211 | Oral cavity | LP | positive regulation of mitotic cell cycle phase transition | 34/4623 | 93/18723 | 7.08e-03 | 3.98e-02 | 34 |
| GO:004578715 | Oral cavity | LP | positive regulation of cell cycle | 96/4623 | 313/18723 | 9.08e-03 | 4.85e-02 | 96 |
| GO:000734617 | Skin | cSCC | regulation of mitotic cell cycle | 192/4864 | 457/18723 | 3.47e-14 | 2.31e-12 | 192 |
| GO:004477223 | Skin | cSCC | mitotic cell cycle phase transition | 180/4864 | 424/18723 | 7.09e-14 | 4.45e-12 | 180 |
| Page: 1 2 3 4 |
| Pathway ID | Tissue | Disease Stage | Description | Gene Ratio | Bg Ratio | pvalue | p.adjust | qvalue | Count |
| hsa0411023 | Esophagus | ESCC | Cell cycle | 126/4205 | 157/8465 | 1.34e-15 | 5.60e-14 | 2.87e-14 | 126 |
| hsa043507 | Esophagus | ESCC | TGF-beta signaling pathway | 69/4205 | 108/8465 | 1.92e-03 | 5.54e-03 | 2.84e-03 | 69 |
| hsa0411033 | Esophagus | ESCC | Cell cycle | 126/4205 | 157/8465 | 1.34e-15 | 5.60e-14 | 2.87e-14 | 126 |
| hsa0435014 | Esophagus | ESCC | TGF-beta signaling pathway | 69/4205 | 108/8465 | 1.92e-03 | 5.54e-03 | 2.84e-03 | 69 |
| hsa041108 | Oral cavity | OSCC | Cell cycle | 118/3704 | 157/8465 | 7.15e-16 | 2.66e-14 | 1.35e-14 | 118 |
| hsa043506 | Oral cavity | OSCC | TGF-beta signaling pathway | 60/3704 | 108/8465 | 8.66e-03 | 1.97e-02 | 1.00e-02 | 60 |
| hsa0411015 | Oral cavity | OSCC | Cell cycle | 118/3704 | 157/8465 | 7.15e-16 | 2.66e-14 | 1.35e-14 | 118 |
| hsa0435013 | Oral cavity | OSCC | TGF-beta signaling pathway | 60/3704 | 108/8465 | 8.66e-03 | 1.97e-02 | 1.00e-02 | 60 |
| hsa0411022 | Oral cavity | LP | Cell cycle | 70/2418 | 157/8465 | 1.17e-05 | 8.27e-05 | 5.33e-05 | 70 |
| hsa0411032 | Oral cavity | LP | Cell cycle | 70/2418 | 157/8465 | 1.17e-05 | 8.27e-05 | 5.33e-05 | 70 |
| Page: 1 |
Top |
Cell-cell communication analysis |
| Identification of potential cell-cell interactions between two cell types and their ligand-receptor pairs for different disease states |
| Ligand | Receptor | LRpair | Pathway | Tissue | Disease Stage |
| Page: 1 |
Top |
Single-cell gene regulatory network inference analysis |
| Find out the significant the regulons (TFs) and the target genes of each regulon across cell types for different disease states |
| TF | Cell Type | Tissue | Disease Stage | Target Gene | RSS | Regulon Activity |
| TFDP1 | MES | Cervix | ADJ | NPW,PCNA,NOXO1, etc. | 6.26e-01 |  |
| TFDP1 | ASC | Colorectum | ADJ | CDK2,COPS6,CDC26, etc. | 1.28e-01 |  |
| TFDP1 | AT2L | Lung | IAC | UHRF1,CEACAM5,PLAT, etc. | 5.00e-01 |  |
| TFDP1 | STM | Pancreas | Healthy | OLFM4,SNRK,TNFSF13, etc. | 9.89e-02 |  |
| TFDP1 | ICAF | Stomach | Healthy | RFWD3,VRK1,TYMS, etc. | 7.25e-01 |  |
| ∗The dot plots of a searched regulon are shown for all cell subpopulations in each disease state of each tissue based on the regulon specific score inferred using pySCENIC and by calculating the average expression. |
| Page: 1 |
Top |
Somatic mutation of malignant transformation related genes |
| Annotation of somatic variants for genes involved in malignant transformation |
| Hugo Symbol | Variant Class | Variant Classification | dbSNP RS | HGVSc | HGVSp | HGVSp Short | SWISSPROT | BIOTYPE | SIFT | PolyPhen | Tumor Sample Barcode | Tissue | Histology | Sex | Age | Stage | Therapy Types | Drugs | Outcome |
| TFDP1 | SNV | Missense_Mutation | c.204N>C | p.Gln68His | p.Q68H | Q14186 | protein_coding | deleterious(0.02) | probably_damaging(0.993) | TCGA-AC-A23H-01 | Breast | breast invasive carcinoma | Female | >=65 | I/II | Unknown | Unknown | PD | |
| TFDP1 | SNV | Missense_Mutation | c.1073N>T | p.Arg358Met | p.R358M | Q14186 | protein_coding | tolerated(0.27) | possibly_damaging(0.635) | TCGA-BH-A0RX-01 | Breast | breast invasive carcinoma | Female | <65 | I/II | Chemotherapy | fluorouracil | SD | |
| TFDP1 | SNV | Missense_Mutation | c.1073G>A | p.Arg358Lys | p.R358K | Q14186 | protein_coding | tolerated(0.31) | benign(0.077) | TCGA-BH-A203-01 | Breast | breast invasive carcinoma | Female | >=65 | I/II | Unknown | Unknown | PD | |
| TFDP1 | SNV | Missense_Mutation | c.69N>G | p.Ser23Arg | p.S23R | Q14186 | protein_coding | tolerated(0.09) | benign(0.198) | TCGA-D8-A1XQ-01 | Breast | breast invasive carcinoma | Female | >=65 | I/II | Unknown | Unknown | SD | |
| TFDP1 | insertion | Nonsense_Mutation | novel | c.68_69insGTTCTTGCTCCACGGCTCTTTTCCTTGATA | p.Ser23delinsArgPheLeuLeuHisGlySerPheProTerTyr | p.S23delinsRFLLHGSFP*Y | Q14186 | protein_coding | TCGA-B6-A0I6-01 | Breast | breast invasive carcinoma | Female | <65 | I/II | Unknown | Unknown | PD | ||
| TFDP1 | SNV | Missense_Mutation | rs763010822 | c.1066G>A | p.Gly356Ser | p.G356S | Q14186 | protein_coding | tolerated(0.15) | benign(0.03) | TCGA-2W-A8YY-01 | Cervix | cervical & endocervical cancer | Female | <65 | I/II | Chemotherapy | cisplatin | CR |
| TFDP1 | SNV | Missense_Mutation | novel | c.950A>C | p.Glu317Ala | p.E317A | Q14186 | protein_coding | tolerated(0.08) | possibly_damaging(0.887) | TCGA-DS-A1OC-01 | Cervix | cervical & endocervical cancer | Female | <65 | I/II | Chemotherapy | gemcitabine | SD |
| TFDP1 | SNV | Missense_Mutation | c.883N>T | p.Asp295Tyr | p.D295Y | Q14186 | protein_coding | deleterious(0) | probably_damaging(0.998) | TCGA-FU-A3HZ-01 | Cervix | cervical & endocervical cancer | Female | <65 | I/II | Chemotherapy | cisplatin | CR | |
| TFDP1 | SNV | Missense_Mutation | novel | c.509N>G | p.Tyr170Cys | p.Y170C | Q14186 | protein_coding | deleterious(0) | possibly_damaging(0.857) | TCGA-VS-A94Z-01 | Cervix | cervical & endocervical cancer | Female | <65 | I/II | Chemotherapy | cisplatin | CR |
| TFDP1 | SNV | Missense_Mutation | c.43N>C | p.Lys15Gln | p.K15Q | Q14186 | protein_coding | tolerated(0.06) | probably_damaging(0.994) | TCGA-AA-3492-01 | Colorectum | colon adenocarcinoma | Female | >=65 | I/II | Unknown | Unknown | SD |
| Page: 1 2 3 4 5 6 7 8 |
Top |
Related drugs of malignant transformation related genes |
| Identification of chemicals and drugs interact with genes involved in malignant transfromation |
| (DGIdb 4.0) |
| Entrez ID | Symbol | Category | Interaction Types | Drug Claim Name | Drug Name | PMIDs |
| Page: 1 |

Copyright 2023-Present -The University of Texas Health Science Center at Houston |