
|
|||||
|
 | |
| |
| |
| |
| |
| |
|
Gene: TAF6 |
Gene summary for TAF6 |
| Gene information | Species | Human | Gene symbol | TAF6 | Gene ID | 6878 |
| Gene name | TATA-box binding protein associated factor 6 | |
| Gene Alias | ALYUS | |
| Cytomap | 7q22.1 | |
| Gene Type | protein-coding | GO ID | GO:0006139 | UniProtAcc | P49848 |
Top |
Malignant transformation analysis |
| Identification of the aberrant gene expression in precancerous and cancerous lesions by comparing the gene expression of stem-like cells in diseased tissues with normal stem cells |
| Entrez ID | Symbol | Replicates | Species | Organ | Tissue | Adj P-value | Log2FC | Malignancy |
| 6878 | TAF6 | LZE4T | Human | Esophagus | ESCC | 3.39e-06 | 2.51e-01 | 0.0811 |
| 6878 | TAF6 | LZE7T | Human | Esophagus | ESCC | 7.34e-11 | 5.45e-01 | 0.0667 |
| 6878 | TAF6 | LZE8T | Human | Esophagus | ESCC | 2.82e-07 | 3.00e-01 | 0.067 |
| 6878 | TAF6 | LZE20T | Human | Esophagus | ESCC | 3.56e-05 | 2.75e-01 | 0.0662 |
| 6878 | TAF6 | LZE22T | Human | Esophagus | ESCC | 1.57e-05 | 4.67e-01 | 0.068 |
| 6878 | TAF6 | LZE24T | Human | Esophagus | ESCC | 2.66e-19 | 4.87e-01 | 0.0596 |
| 6878 | TAF6 | LZE21T | Human | Esophagus | ESCC | 2.62e-04 | 2.97e-01 | 0.0655 |
| 6878 | TAF6 | LZE6T | Human | Esophagus | ESCC | 4.30e-04 | 2.34e-01 | 0.0845 |
| 6878 | TAF6 | P1T-E | Human | Esophagus | ESCC | 4.86e-11 | 5.52e-01 | 0.0875 |
| 6878 | TAF6 | P2T-E | Human | Esophagus | ESCC | 1.61e-37 | 6.44e-01 | 0.1177 |
| 6878 | TAF6 | P4T-E | Human | Esophagus | ESCC | 2.22e-23 | 5.33e-01 | 0.1323 |
| 6878 | TAF6 | P5T-E | Human | Esophagus | ESCC | 5.66e-19 | 2.58e-01 | 0.1327 |
| 6878 | TAF6 | P8T-E | Human | Esophagus | ESCC | 2.01e-18 | 3.05e-01 | 0.0889 |
| 6878 | TAF6 | P9T-E | Human | Esophagus | ESCC | 3.42e-08 | 2.97e-01 | 0.1131 |
| 6878 | TAF6 | P10T-E | Human | Esophagus | ESCC | 2.58e-20 | 3.01e-01 | 0.116 |
| 6878 | TAF6 | P11T-E | Human | Esophagus | ESCC | 9.16e-20 | 6.48e-01 | 0.1426 |
| 6878 | TAF6 | P12T-E | Human | Esophagus | ESCC | 2.78e-30 | 5.98e-01 | 0.1122 |
| 6878 | TAF6 | P15T-E | Human | Esophagus | ESCC | 6.09e-42 | 9.27e-01 | 0.1149 |
| 6878 | TAF6 | P16T-E | Human | Esophagus | ESCC | 5.93e-73 | 1.12e+00 | 0.1153 |
| 6878 | TAF6 | P17T-E | Human | Esophagus | ESCC | 2.53e-14 | 7.97e-01 | 0.1278 |
| Page: 1 2 3 4 5 6 |
| Tissue | Expression Dynamics | Abbreviation |
| Esophagus | 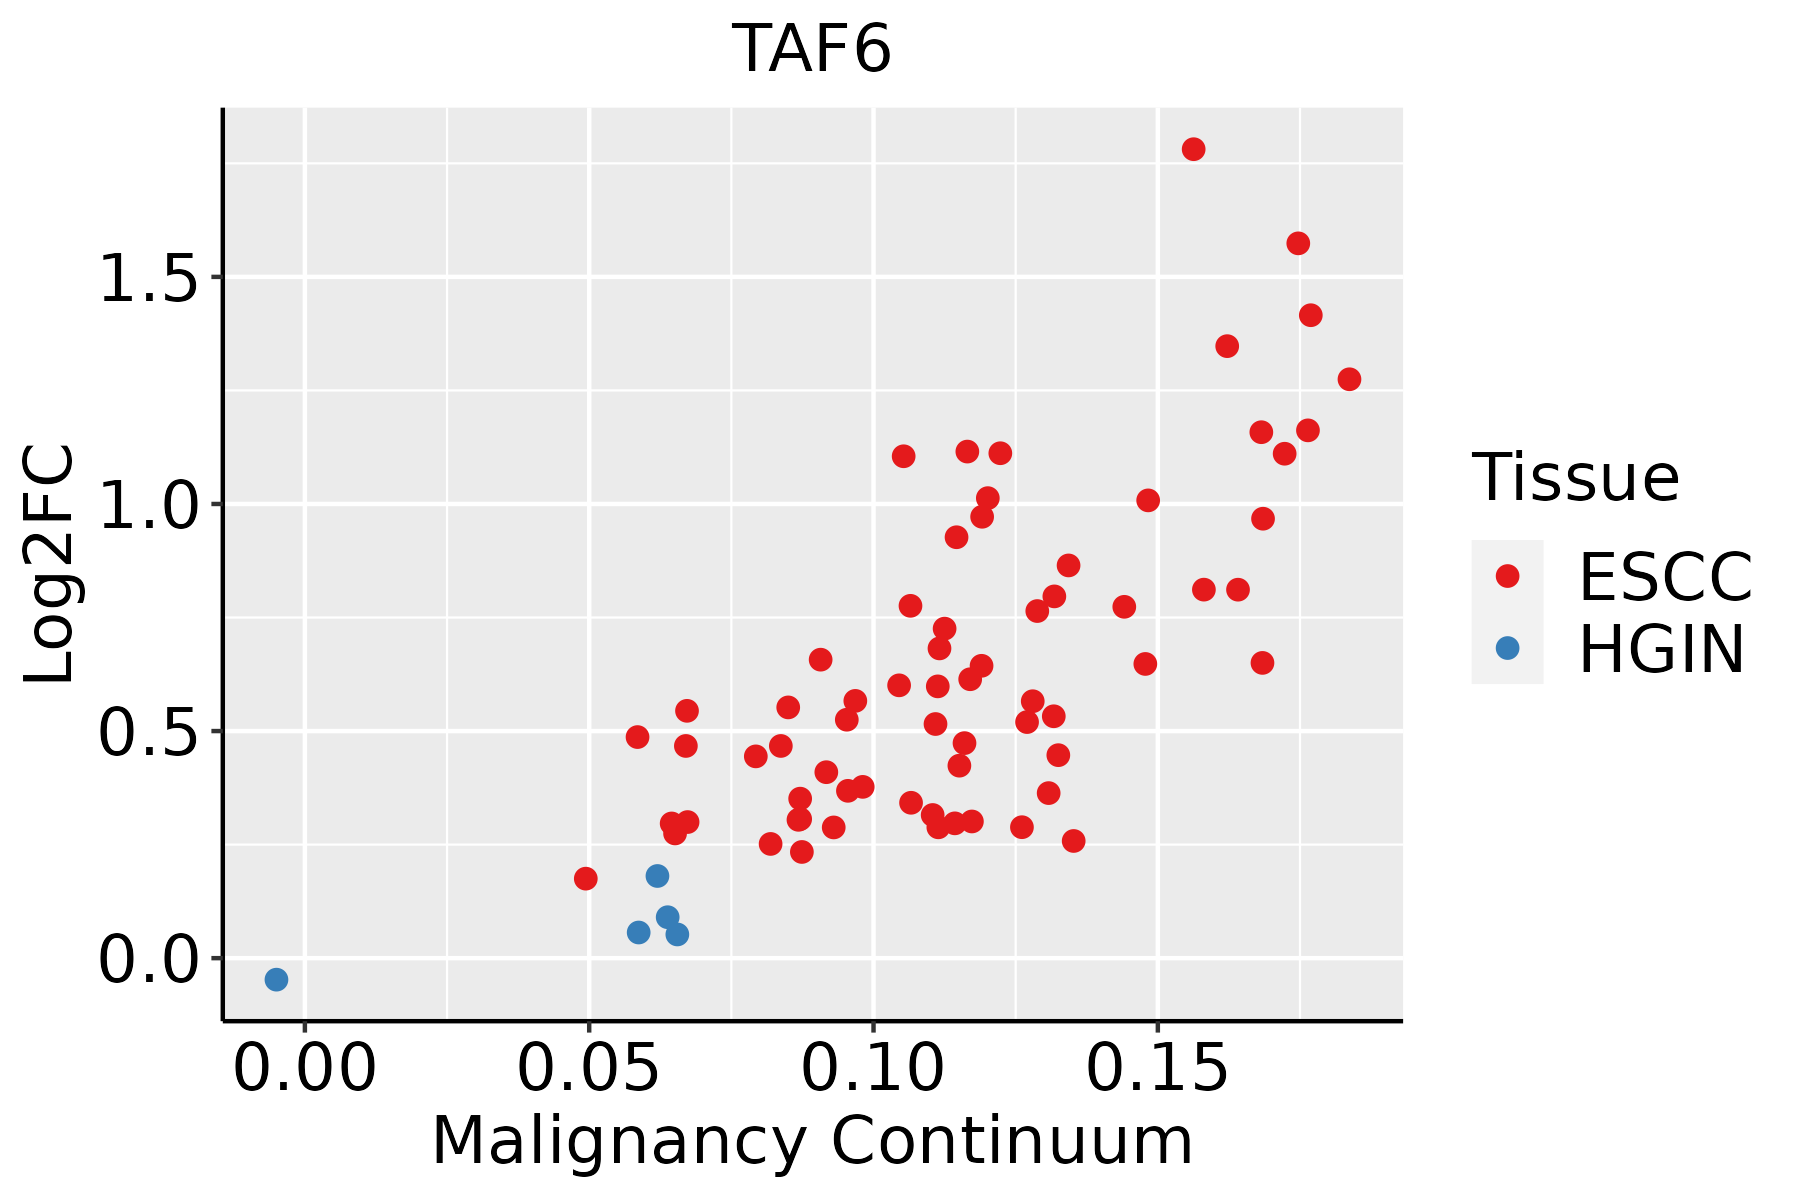 | ESCC: Esophageal squamous cell carcinoma |
| HGIN: High-grade intraepithelial neoplasias | ||
| LGIN: Low-grade intraepithelial neoplasias | ||
| Liver | 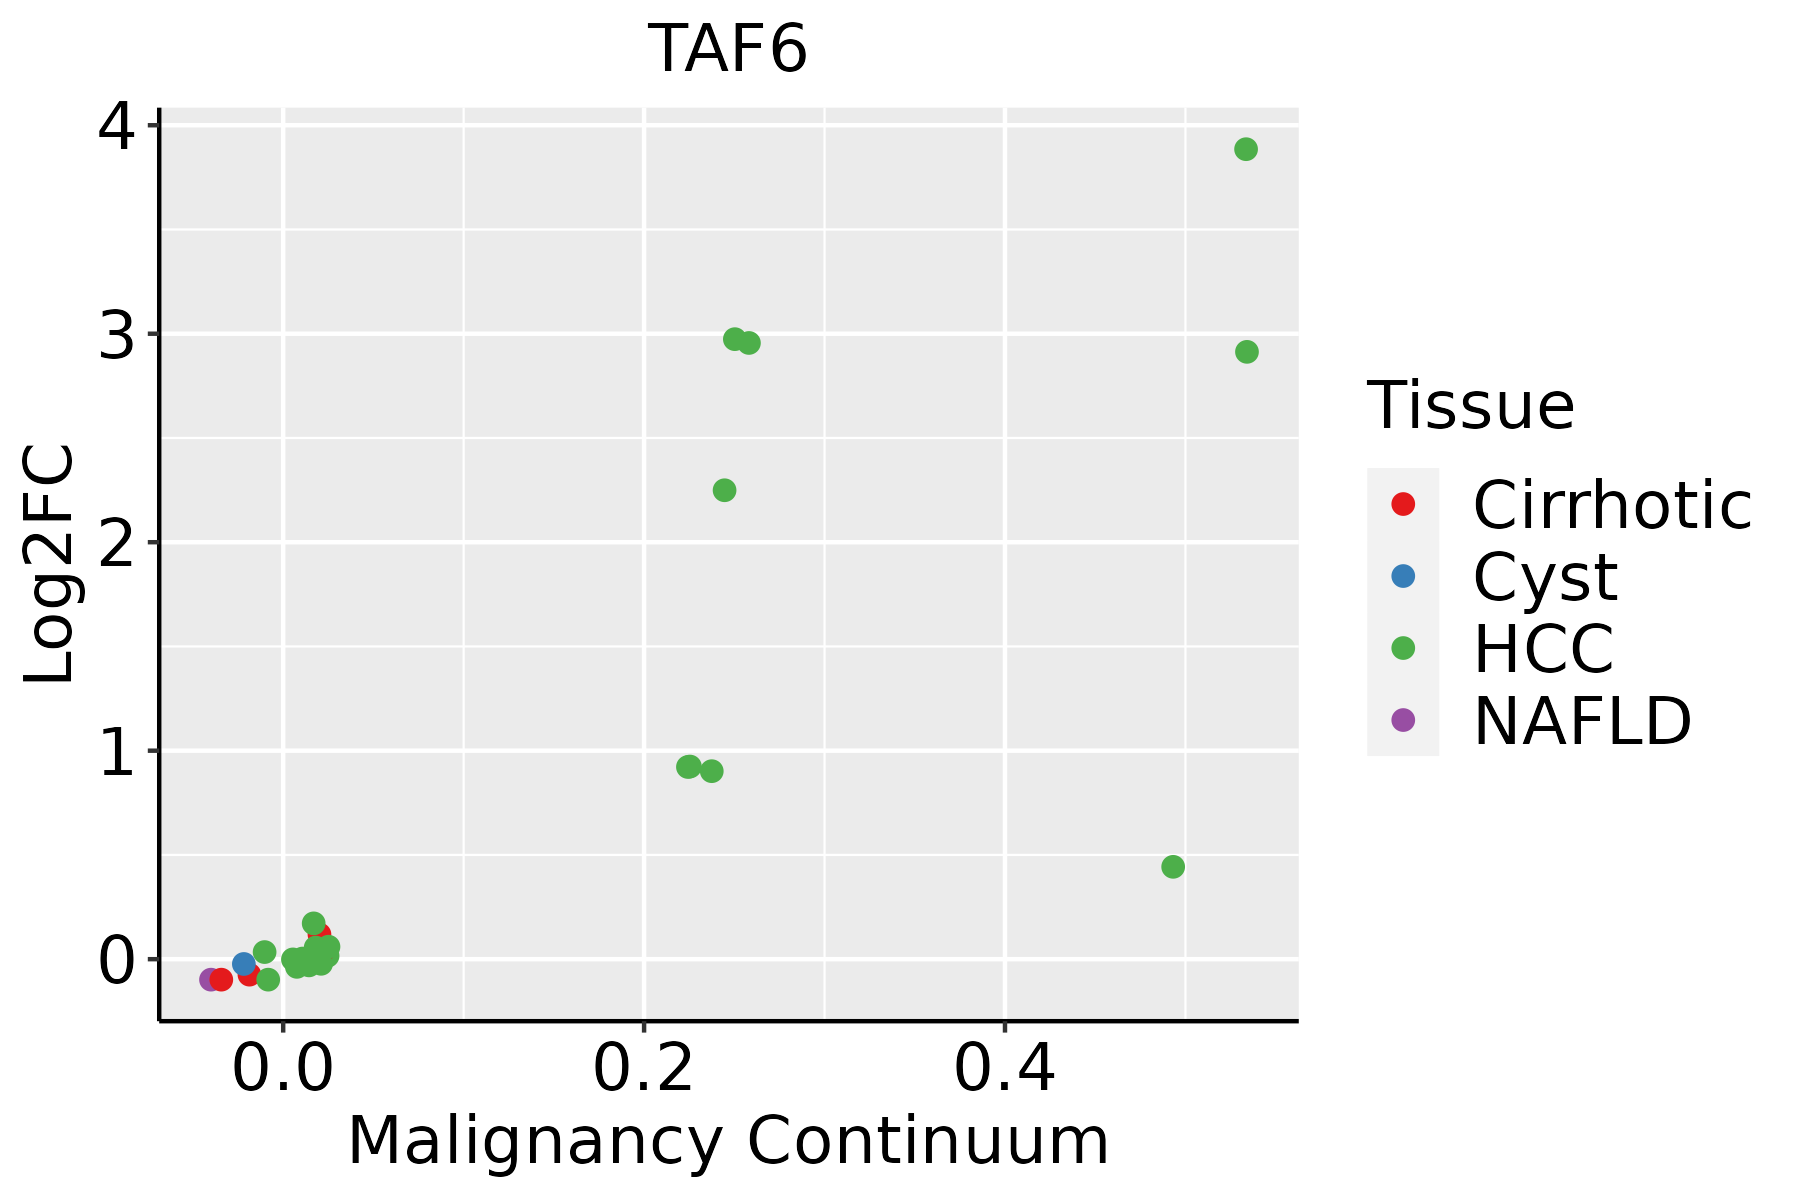 | HCC: Hepatocellular carcinoma |
| NAFLD: Non-alcoholic fatty liver disease | ||
| Oral Cavity | 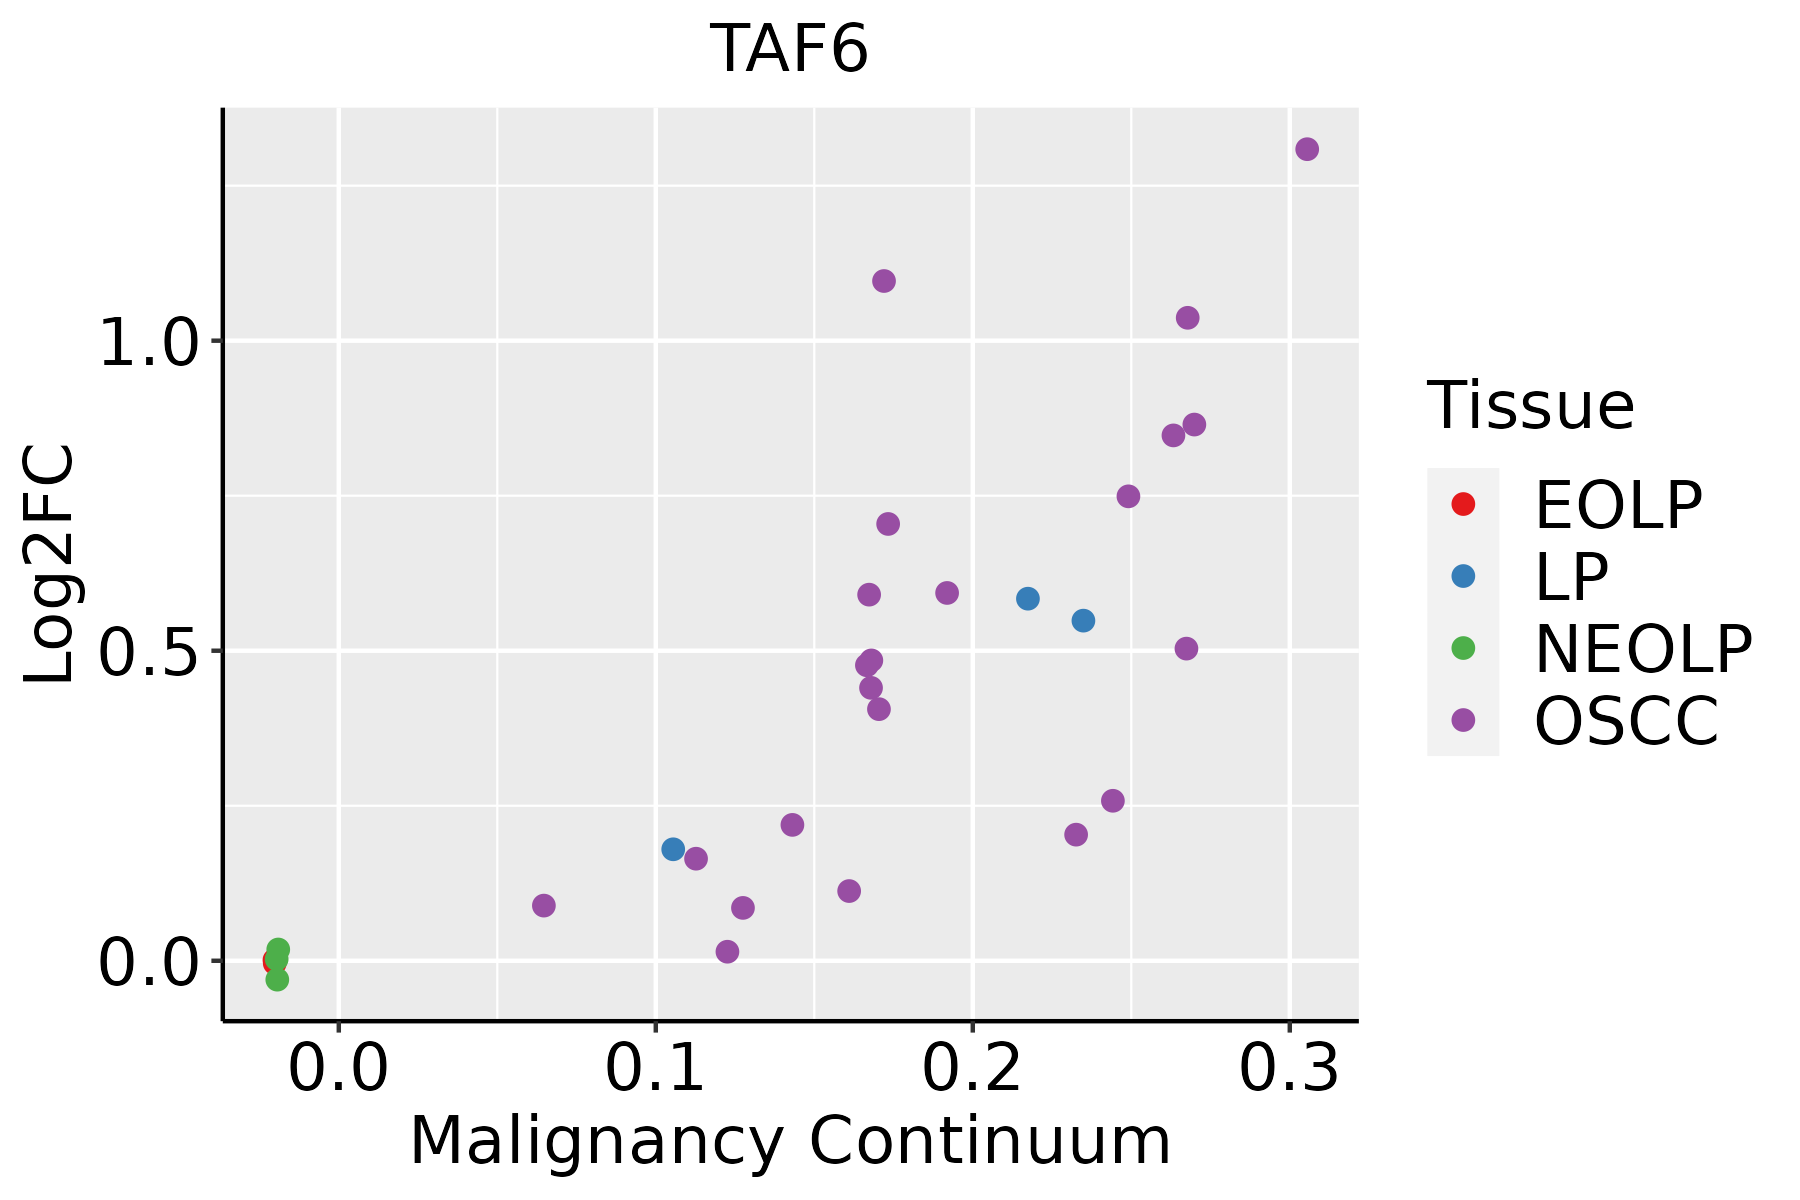 | EOLP: Erosive Oral lichen planus |
| LP: leukoplakia | ||
| NEOLP: Non-erosive oral lichen planus | ||
| OSCC: Oral squamous cell carcinoma | ||
| Skin | 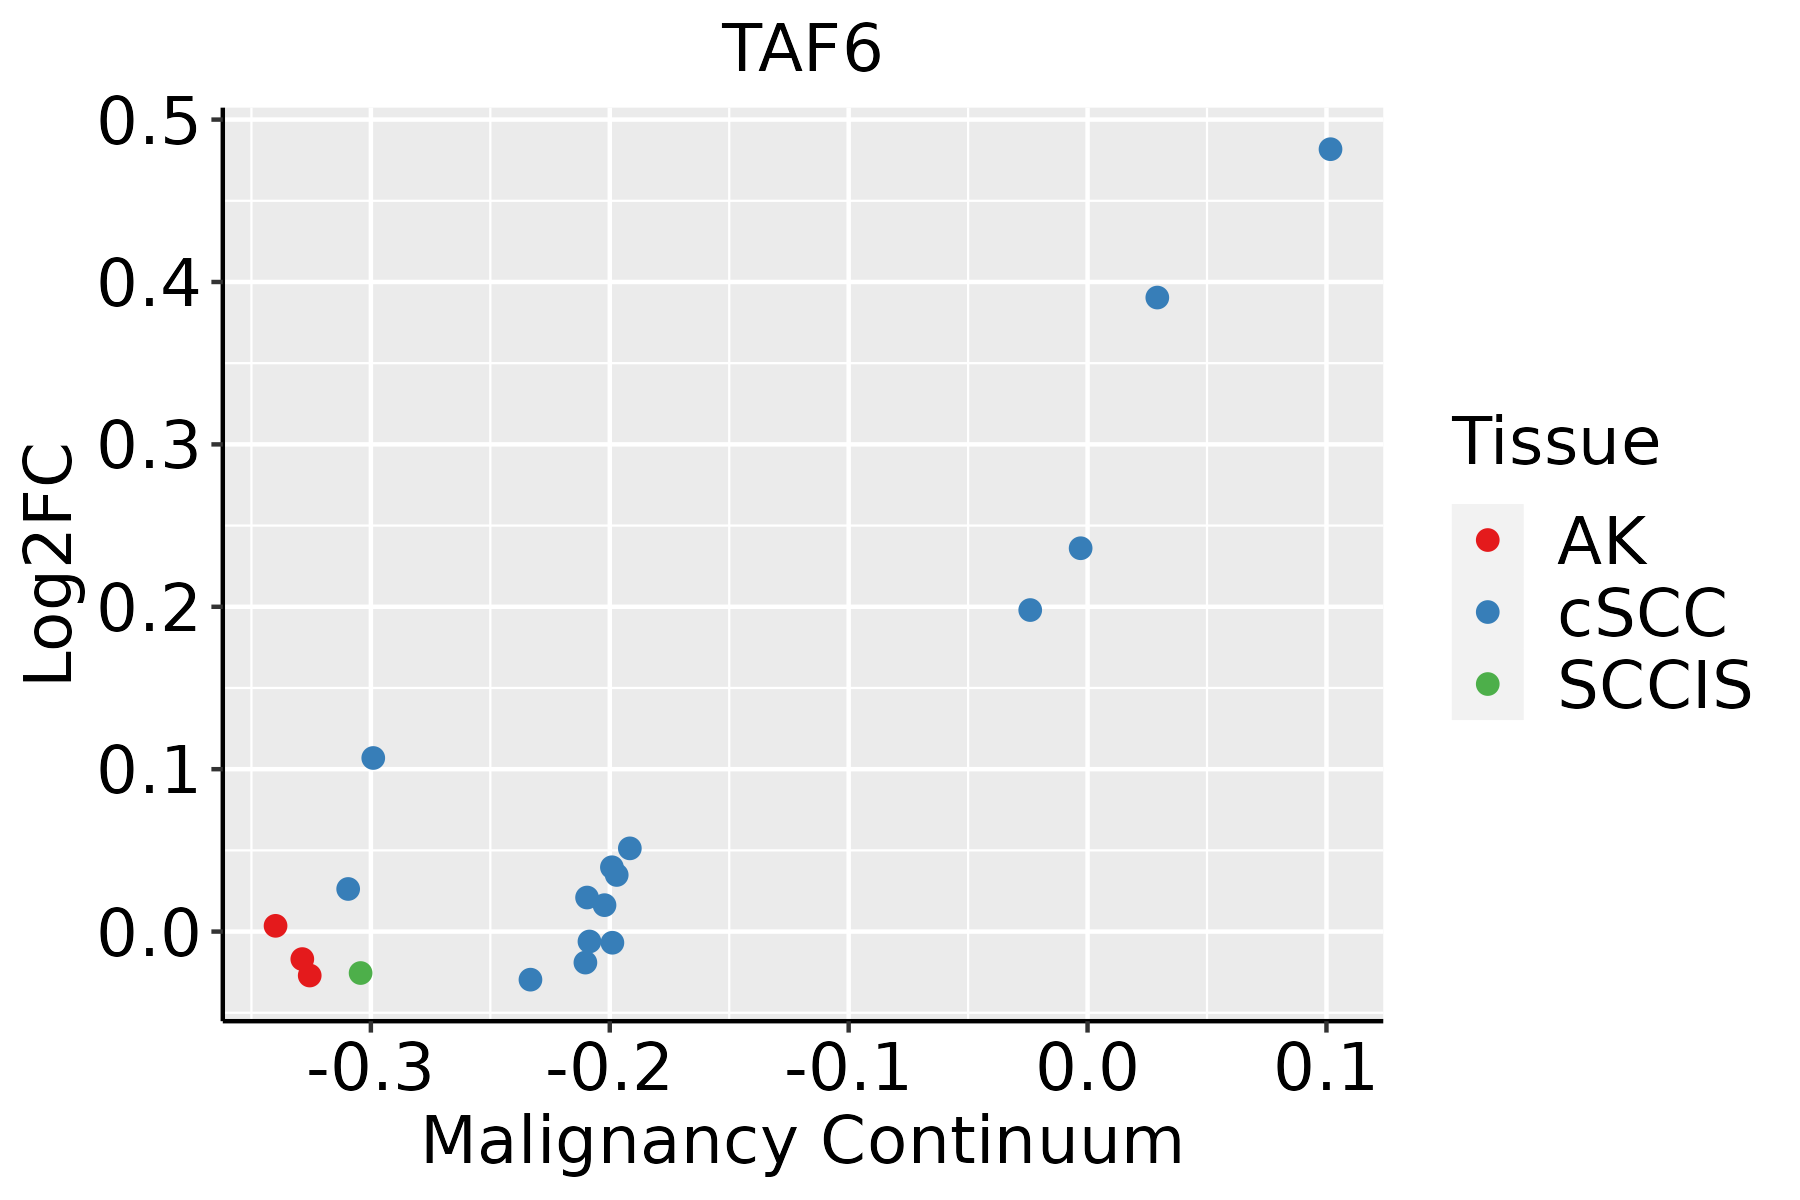 | AK: Actinic keratosis |
| cSCC: Cutaneous squamous cell carcinoma | ||
| SCCIS:squamous cell carcinoma in situ | ||
| Thyroid | 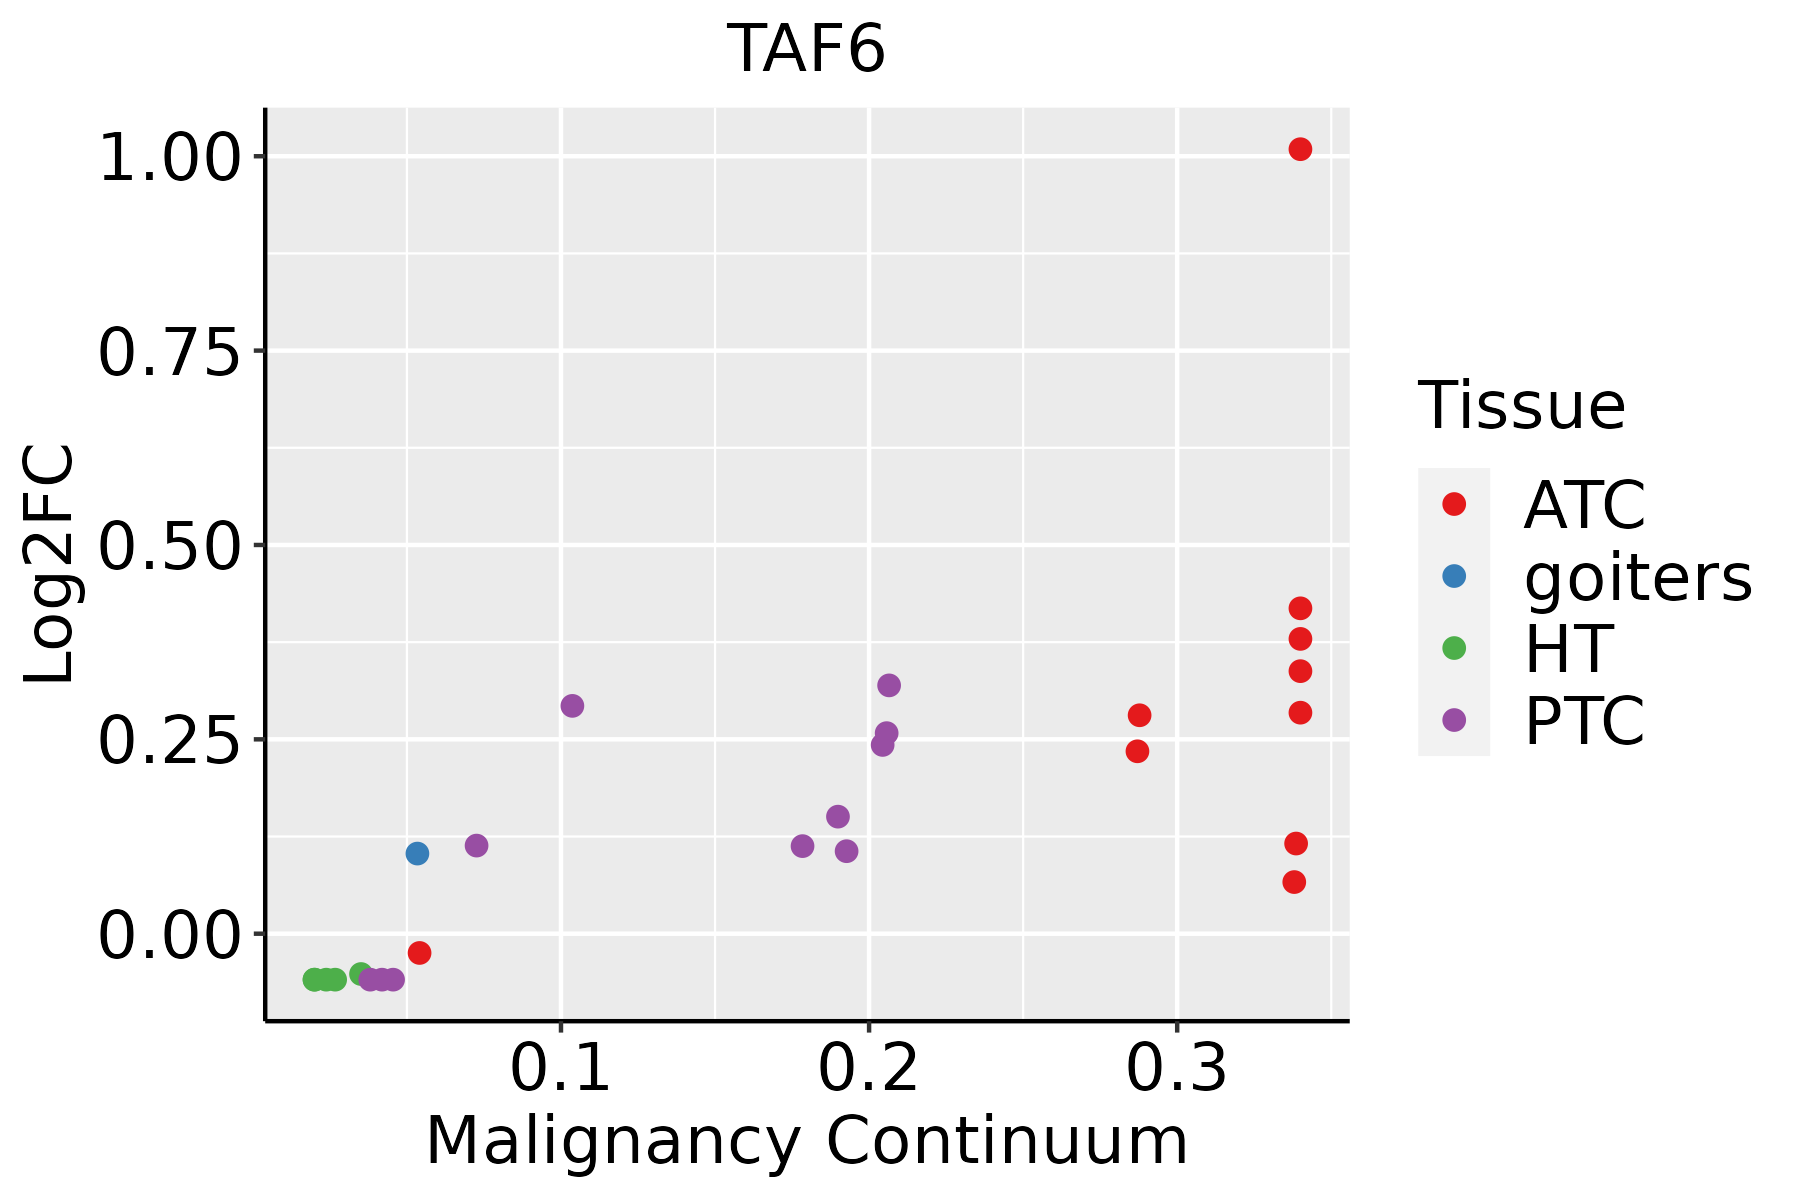 | ATC: Anaplastic thyroid cancer |
| HT: Hashimoto's thyroiditis | ||
| PTC: Papillary thyroid cancer |
| ∗log2FC in expression of this searched gene in stem-like cells from each diseased tissue sample relative to stem-like cells in normal samples in each tissue plotted against the malignancy continuum. Samples are colored based on if they are from different disease stage. |
Top |
Malignant transformation related pathway analysis |
| Find out the enriched GO biological processes and KEGG pathways involved in transition from healthy to precancer to cancer |
| Tissue | Disease Stage | Enriched GO biological Processes |
| Colorectum | AD |  |
| Colorectum | SER |  |
| Colorectum | MSS |  |
| Colorectum | MSI-H |  |
| Colorectum | FAP |  |
| ∗Top 15 enriched GO BP terms are showed in the bar plot of each disease state in each tissue. Each row represents a significant GO biological process which is colored according to the -log10(p.adjust). |
| Page: 1 2 3 4 5 6 7 8 9 |
| GO ID | Tissue | Disease Stage | Description | Gene Ratio | Bg Ratio | pvalue | p.adjust | Count |
| GO:00457867 | Thyroid | PTC | negative regulation of cell cycle | 166/5968 | 385/18723 | 1.93e-06 | 2.64e-05 | 166 |
| GO:00063675 | Thyroid | PTC | transcription initiation from RNA polymerase II promoter | 44/5968 | 77/18723 | 4.04e-06 | 5.05e-05 | 44 |
| GO:00063525 | Thyroid | PTC | DNA-templated transcription, initiation | 63/5968 | 130/18723 | 5.72e-05 | 5.05e-04 | 63 |
| GO:00708975 | Thyroid | PTC | transcription preinitiation complex assembly | 22/5968 | 36/18723 | 2.85e-04 | 2.02e-03 | 22 |
| GO:00511234 | Thyroid | PTC | RNA polymerase II preinitiation complex assembly | 15/5968 | 24/18723 | 1.95e-03 | 1.05e-02 | 15 |
| GO:004578614 | Thyroid | ATC | negative regulation of cell cycle | 181/6293 | 385/18723 | 2.64e-08 | 5.07e-07 | 181 |
| GO:000636712 | Thyroid | ATC | transcription initiation from RNA polymerase II promoter | 44/6293 | 77/18723 | 1.86e-05 | 1.70e-04 | 44 |
| GO:000635213 | Thyroid | ATC | DNA-templated transcription, initiation | 64/6293 | 130/18723 | 1.60e-04 | 1.10e-03 | 64 |
| GO:007089712 | Thyroid | ATC | transcription preinitiation complex assembly | 22/6293 | 36/18723 | 6.58e-04 | 3.73e-03 | 22 |
| GO:00718242 | Thyroid | ATC | protein-DNA complex subunit organization | 103/6293 | 241/18723 | 1.84e-03 | 9.03e-03 | 103 |
| GO:005112311 | Thyroid | ATC | RNA polymerase II preinitiation complex assembly | 15/6293 | 24/18723 | 3.52e-03 | 1.56e-02 | 15 |
| Page: 1 2 3 |
| Pathway ID | Tissue | Disease Stage | Description | Gene Ratio | Bg Ratio | pvalue | p.adjust | qvalue | Count |
| hsa030222 | Esophagus | ESCC | Basal transcription factors | 35/4205 | 45/8465 | 1.01e-04 | 4.06e-04 | 2.08e-04 | 35 |
| hsa0302211 | Esophagus | ESCC | Basal transcription factors | 35/4205 | 45/8465 | 1.01e-04 | 4.06e-04 | 2.08e-04 | 35 |
| hsa03022 | Oral cavity | OSCC | Basal transcription factors | 28/3704 | 45/8465 | 9.53e-03 | 2.11e-02 | 1.08e-02 | 28 |
| hsa030221 | Oral cavity | OSCC | Basal transcription factors | 28/3704 | 45/8465 | 9.53e-03 | 2.11e-02 | 1.08e-02 | 28 |
| Page: 1 |
Top |
Cell-cell communication analysis |
| Identification of potential cell-cell interactions between two cell types and their ligand-receptor pairs for different disease states |
| Ligand | Receptor | LRpair | Pathway | Tissue | Disease Stage |
| Page: 1 |
Top |
Single-cell gene regulatory network inference analysis |
| Find out the significant the regulons (TFs) and the target genes of each regulon across cell types for different disease states |
| TF | Cell Type | Tissue | Disease Stage | Target Gene | RSS | Regulon Activity |
| ∗The dot plots of a searched regulon are shown for all cell subpopulations in each disease state of each tissue based on the regulon specific score inferred using pySCENIC and by calculating the average expression. |
| Page: 1 |
Top |
Somatic mutation of malignant transformation related genes |
| Annotation of somatic variants for genes involved in malignant transformation |
| Hugo Symbol | Variant Class | Variant Classification | dbSNP RS | HGVSc | HGVSp | HGVSp Short | SWISSPROT | BIOTYPE | SIFT | PolyPhen | Tumor Sample Barcode | Tissue | Histology | Sex | Age | Stage | Therapy Types | Drugs | Outcome |
| TAF6 | SNV | Missense_Mutation | novel | c.2118C>A | p.Asn706Lys | p.N706K | P49848 | protein_coding | tolerated_low_confidence(0.3) | benign(0) | TCGA-3C-AALI-01 | Breast | breast invasive carcinoma | Female | <65 | I/II | Unspecific | Poly E | Complete Response |
| TAF6 | SNV | Missense_Mutation | c.1226N>T | p.Thr409Ile | p.T409I | P49848 | protein_coding | deleterious(0.02) | possibly_damaging(0.505) | TCGA-A7-A0DA-01 | Breast | breast invasive carcinoma | Female | <65 | I/II | Chemotherapy | adriamycin | SD | |
| TAF6 | SNV | Missense_Mutation | novel | c.960N>T | p.Met320Ile | p.M320I | P49848 | protein_coding | tolerated(0.05) | benign(0.177) | TCGA-A8-A092-01 | Breast | breast invasive carcinoma | Female | <65 | III/IV | Chemotherapy | paclitaxel | CR |
| TAF6 | SNV | Missense_Mutation | novel | c.593N>T | p.Ala198Val | p.A198V | P49848 | protein_coding | tolerated(0.15) | benign(0.035) | TCGA-A8-A09A-01 | Breast | breast invasive carcinoma | Female | <65 | I/II | Hormone Therapy | tamoxiphen | SD |
| TAF6 | insertion | Frame_Shift_Ins | novel | c.298_299insTACAAGGAGATCACCGAGGCCTGCGTGGGCT | p.Arg100LeufsTer18 | p.R100Lfs*18 | P49848 | protein_coding | TCGA-B6-A0IK-01 | Breast | breast invasive carcinoma | Female | <65 | III/IV | Unknown | Unknown | PD | ||
| TAF6 | SNV | Missense_Mutation | c.871N>G | p.Gln291Glu | p.Q291E | P49848 | protein_coding | tolerated(0.49) | benign(0.113) | TCGA-C5-A1BL-01 | Cervix | cervical & endocervical cancer | Female | <65 | I/II | Unknown | Unknown | SD | |
| TAF6 | SNV | Missense_Mutation | novel | c.1340N>A | p.Pro447His | p.P447H | P49848 | protein_coding | deleterious(0.01) | possibly_damaging(0.74) | TCGA-EA-A410-01 | Cervix | cervical & endocervical cancer | Female | <65 | I/II | Unknown | Unknown | SD |
| TAF6 | SNV | Missense_Mutation | rs766556536 | c.1427N>A | p.Arg476His | p.R476H | P49848 | protein_coding | tolerated(0.12) | benign(0.187) | TCGA-5M-AAT6-01 | Colorectum | colon adenocarcinoma | Female | <65 | III/IV | Unknown | Unknown | PD |
| TAF6 | SNV | Missense_Mutation | c.1038N>T | p.Met346Ile | p.M346I | P49848 | protein_coding | tolerated(0.79) | benign(0.023) | TCGA-AA-A00N-01 | Colorectum | colon adenocarcinoma | Male | >=65 | I/II | Unknown | Unknown | PD | |
| TAF6 | SNV | Missense_Mutation | c.557N>T | p.Pro186Leu | p.P186L | P49848 | protein_coding | deleterious(0.03) | probably_damaging(0.987) | TCGA-G4-6304-01 | Colorectum | colon adenocarcinoma | Female | >=65 | I/II | Chemotherapy | fluorouracil | PD |
| Page: 1 2 3 4 5 6 7 |
Top |
Related drugs of malignant transformation related genes |
| Identification of chemicals and drugs interact with genes involved in malignant transfromation |
| (DGIdb 4.0) |
| Entrez ID | Symbol | Category | Interaction Types | Drug Claim Name | Drug Name | PMIDs |
| Page: 1 |

Copyright 2023-Present -The University of Texas Health Science Center at Houston |