
|
|||||
|
 | |
| |
| |
| |
| |
| |
|
Gene: STAMBP |
Gene summary for STAMBP |
| Gene information | Species | Human | Gene symbol | STAMBP | Gene ID | 10617 |
| Gene name | STAM binding protein | |
| Gene Alias | AMSH | |
| Cytomap | 2p13.1 | |
| Gene Type | protein-coding | GO ID | GO:0000278 | UniProtAcc | A0A140VK54 |
Top |
Malignant transformation analysis |
| Identification of the aberrant gene expression in precancerous and cancerous lesions by comparing the gene expression of stem-like cells in diseased tissues with normal stem cells |
| Entrez ID | Symbol | Replicates | Species | Organ | Tissue | Adj P-value | Log2FC | Malignancy |
| 10617 | STAMBP | LZE2T | Human | Esophagus | ESCC | 9.85e-04 | 8.25e-01 | 0.082 |
| 10617 | STAMBP | LZE3D | Human | Esophagus | HGIN | 2.94e-03 | 7.43e-01 | 0.0668 |
| 10617 | STAMBP | LZE4T | Human | Esophagus | ESCC | 2.47e-21 | 6.59e-01 | 0.0811 |
| 10617 | STAMBP | LZE5T | Human | Esophagus | ESCC | 1.06e-03 | 3.10e-01 | 0.0514 |
| 10617 | STAMBP | LZE7T | Human | Esophagus | ESCC | 8.11e-06 | 4.73e-01 | 0.0667 |
| 10617 | STAMBP | LZE8T | Human | Esophagus | ESCC | 3.36e-04 | 1.07e-01 | 0.067 |
| 10617 | STAMBP | LZE20T | Human | Esophagus | ESCC | 4.28e-08 | 2.56e-01 | 0.0662 |
| 10617 | STAMBP | LZE22D1 | Human | Esophagus | HGIN | 5.92e-03 | 1.33e-01 | 0.0595 |
| 10617 | STAMBP | LZE22T | Human | Esophagus | ESCC | 7.27e-04 | 3.61e-01 | 0.068 |
| 10617 | STAMBP | LZE24T | Human | Esophagus | ESCC | 7.58e-22 | 4.98e-01 | 0.0596 |
| 10617 | STAMBP | LZE21T | Human | Esophagus | ESCC | 2.04e-02 | 4.99e-01 | 0.0655 |
| 10617 | STAMBP | LZE6T | Human | Esophagus | ESCC | 2.49e-12 | 6.03e-01 | 0.0845 |
| 10617 | STAMBP | P1T-E | Human | Esophagus | ESCC | 7.60e-15 | 7.46e-01 | 0.0875 |
| 10617 | STAMBP | P2T-E | Human | Esophagus | ESCC | 5.41e-49 | 9.60e-01 | 0.1177 |
| 10617 | STAMBP | P4T-E | Human | Esophagus | ESCC | 2.26e-36 | 8.88e-01 | 0.1323 |
| 10617 | STAMBP | P5T-E | Human | Esophagus | ESCC | 2.32e-39 | 7.12e-01 | 0.1327 |
| 10617 | STAMBP | P8T-E | Human | Esophagus | ESCC | 2.29e-23 | 4.39e-01 | 0.0889 |
| 10617 | STAMBP | P9T-E | Human | Esophagus | ESCC | 1.73e-14 | 3.69e-01 | 0.1131 |
| 10617 | STAMBP | P10T-E | Human | Esophagus | ESCC | 5.11e-32 | 6.43e-01 | 0.116 |
| 10617 | STAMBP | P11T-E | Human | Esophagus | ESCC | 2.33e-13 | 6.63e-01 | 0.1426 |
| Page: 1 2 3 4 5 6 7 |
| Tissue | Expression Dynamics | Abbreviation |
| Esophagus | 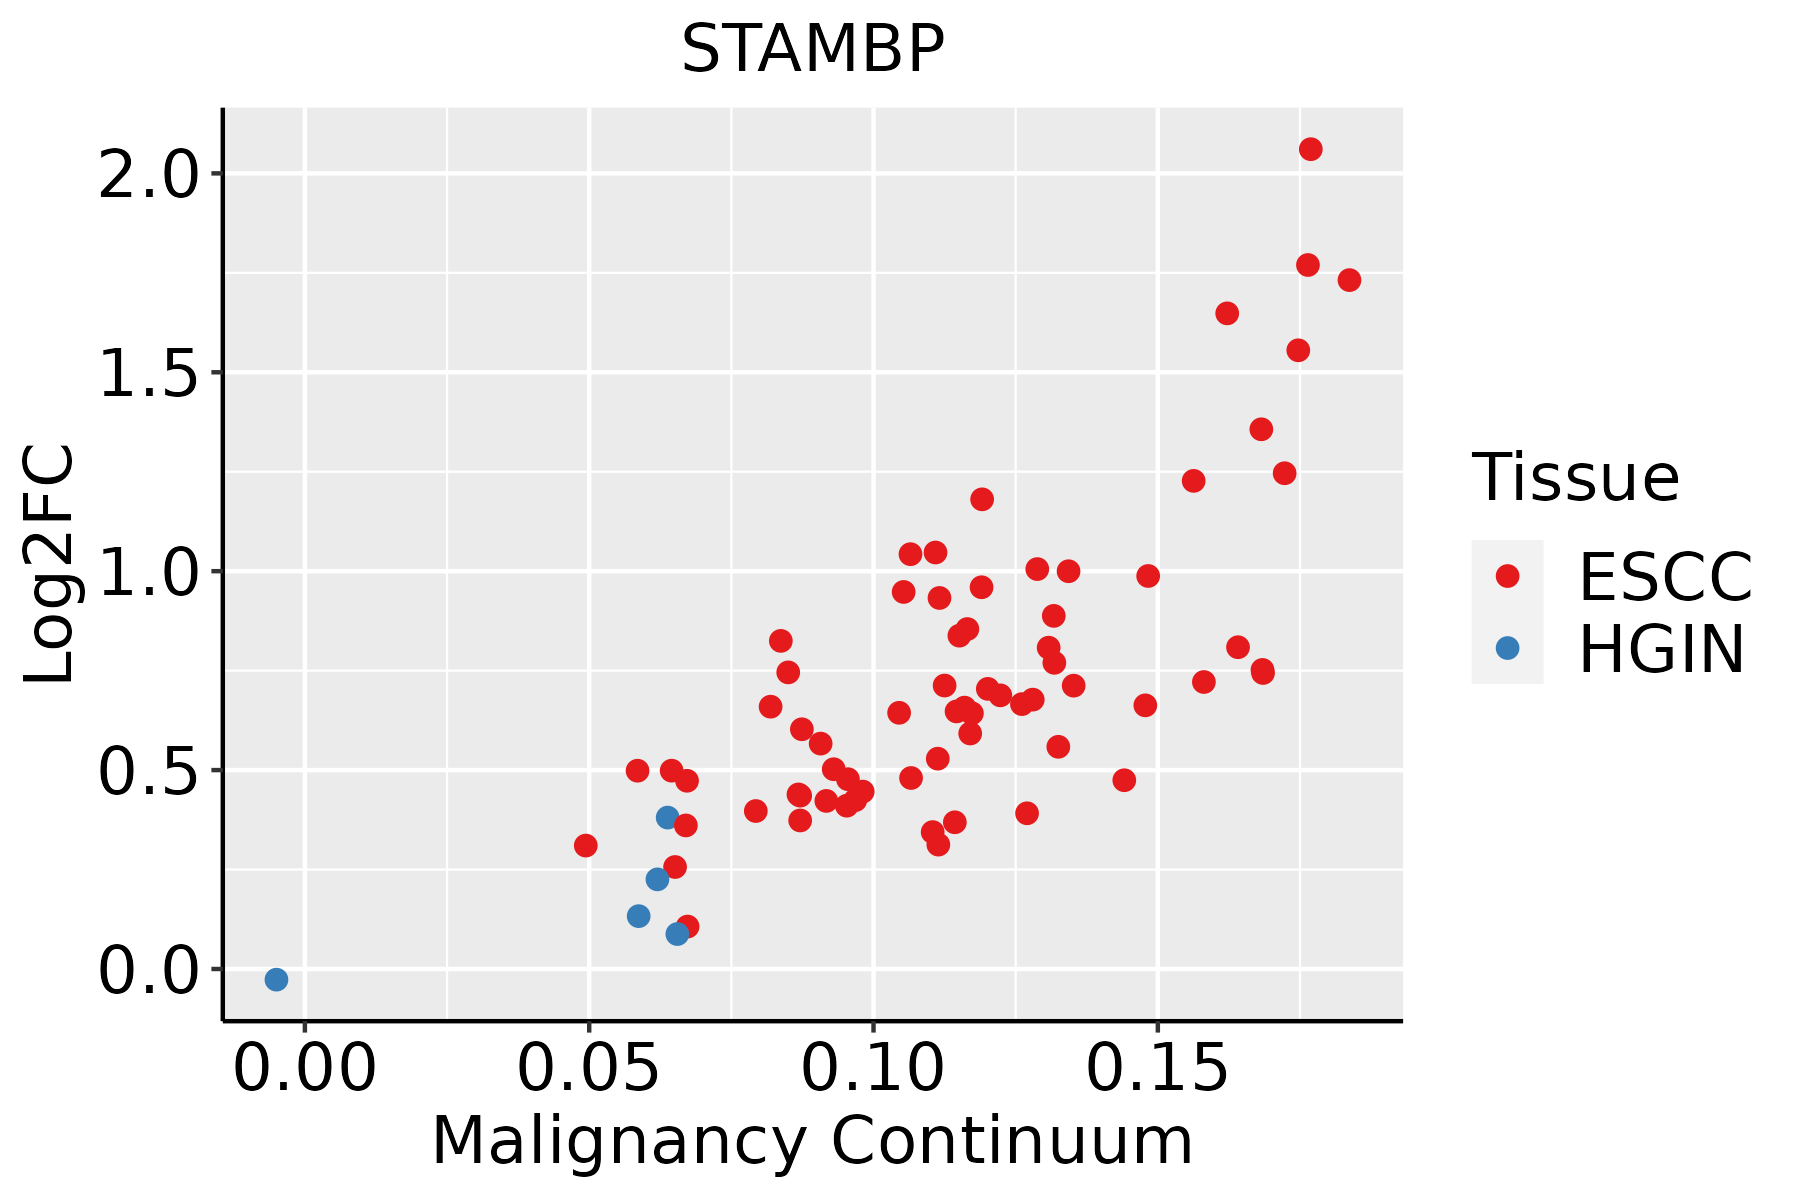 | ESCC: Esophageal squamous cell carcinoma |
| HGIN: High-grade intraepithelial neoplasias | ||
| LGIN: Low-grade intraepithelial neoplasias | ||
| Liver |  | HCC: Hepatocellular carcinoma |
| NAFLD: Non-alcoholic fatty liver disease | ||
| Oral Cavity |  | EOLP: Erosive Oral lichen planus |
| LP: leukoplakia | ||
| NEOLP: Non-erosive oral lichen planus | ||
| OSCC: Oral squamous cell carcinoma | ||
| Skin |  | AK: Actinic keratosis |
| cSCC: Cutaneous squamous cell carcinoma | ||
| SCCIS:squamous cell carcinoma in situ | ||
| Thyroid | 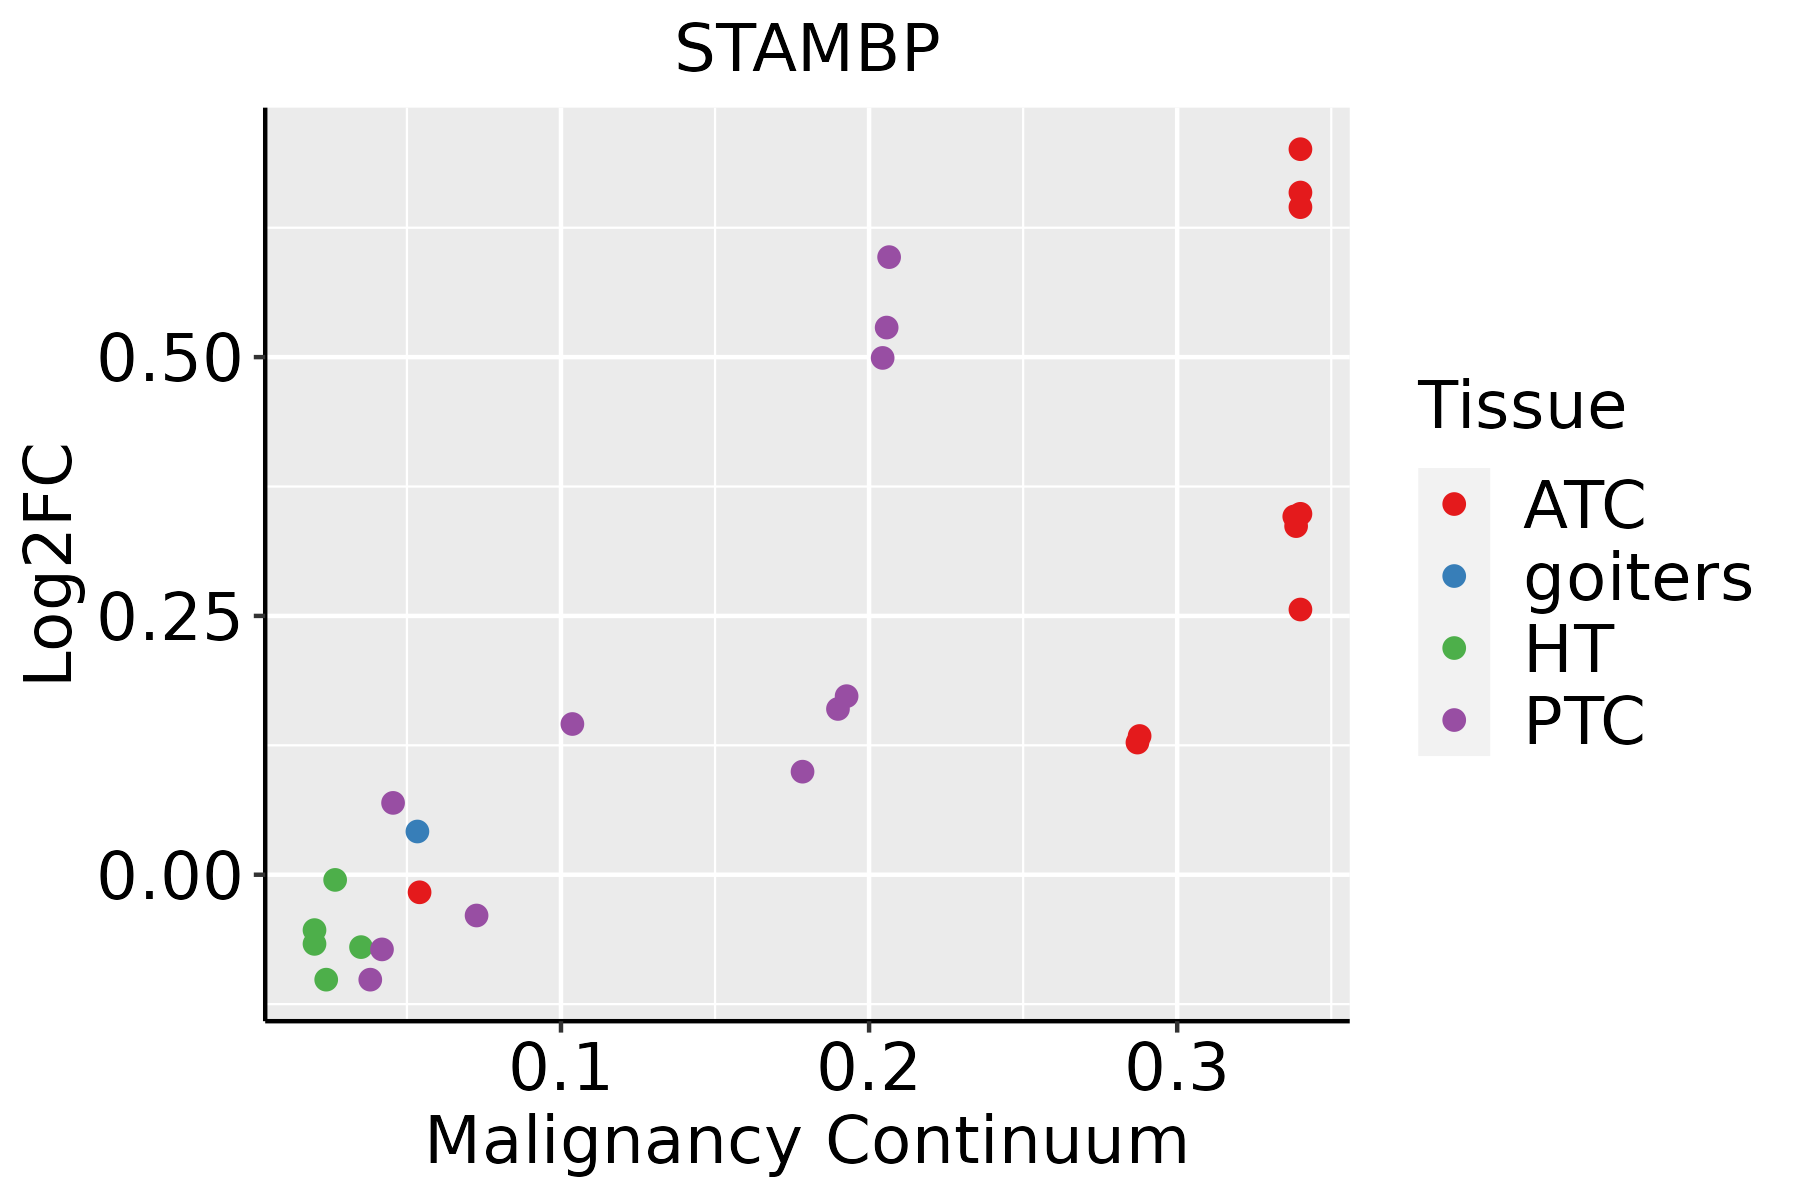 | ATC: Anaplastic thyroid cancer |
| HT: Hashimoto's thyroiditis | ||
| PTC: Papillary thyroid cancer |
| ∗log2FC in expression of this searched gene in stem-like cells from each diseased tissue sample relative to stem-like cells in normal samples in each tissue plotted against the malignancy continuum. Samples are colored based on if they are from different disease stage. |
Top |
Malignant transformation related pathway analysis |
| Find out the enriched GO biological processes and KEGG pathways involved in transition from healthy to precancer to cancer |
| Tissue | Disease Stage | Enriched GO biological Processes |
| Colorectum | AD |  |
| Colorectum | SER |  |
| Colorectum | MSS |  |
| Colorectum | MSI-H |  |
| Colorectum | FAP |  |
| ∗Top 15 enriched GO BP terms are showed in the bar plot of each disease state in each tissue. Each row represents a significant GO biological process which is colored according to the -log10(p.adjust). |
| Page: 1 2 3 4 5 6 7 8 9 |
| GO ID | Tissue | Disease Stage | Description | Gene Ratio | Bg Ratio | pvalue | p.adjust | Count |
| GO:00510586 | Thyroid | PTC | negative regulation of small GTPase mediated signal transduction | 31/5968 | 56/18723 | 2.32e-04 | 1.68e-03 | 31 |
| GO:00706465 | Thyroid | PTC | protein modification by small protein removal | 71/5968 | 157/18723 | 3.03e-04 | 2.12e-03 | 71 |
| GO:00465805 | Thyroid | PTC | negative regulation of Ras protein signal transduction | 27/5968 | 49/18723 | 6.38e-04 | 4.02e-03 | 27 |
| GO:00705363 | Thyroid | PTC | protein K63-linked deubiquitination | 20/5968 | 35/18723 | 1.75e-03 | 9.51e-03 | 20 |
| GO:00165794 | Thyroid | PTC | protein deubiquitination | 59/5968 | 139/18723 | 5.50e-03 | 2.50e-02 | 59 |
| GO:000726524 | Thyroid | ATC | Ras protein signal transduction | 172/6293 | 337/18723 | 2.25e-11 | 7.96e-10 | 172 |
| GO:000028117 | Thyroid | ATC | mitotic cytokinesis | 50/6293 | 71/18723 | 2.46e-10 | 7.10e-09 | 50 |
| GO:0000910110 | Thyroid | ATC | cytokinesis | 93/6293 | 173/18723 | 3.59e-08 | 6.67e-07 | 93 |
| GO:006164017 | Thyroid | ATC | cytoskeleton-dependent cytokinesis | 57/6293 | 100/18723 | 1.29e-06 | 1.65e-05 | 57 |
| GO:005105618 | Thyroid | ATC | regulation of small GTPase mediated signal transduction | 141/6293 | 302/18723 | 1.43e-06 | 1.77e-05 | 141 |
| GO:004657818 | Thyroid | ATC | regulation of Ras protein signal transduction | 94/6293 | 189/18723 | 3.12e-06 | 3.55e-05 | 94 |
| GO:005105812 | Thyroid | ATC | negative regulation of small GTPase mediated signal transduction | 31/6293 | 56/18723 | 6.60e-04 | 3.74e-03 | 31 |
| GO:004658012 | Thyroid | ATC | negative regulation of Ras protein signal transduction | 27/6293 | 49/18723 | 1.58e-03 | 7.99e-03 | 27 |
| GO:007064613 | Thyroid | ATC | protein modification by small protein removal | 71/6293 | 157/18723 | 1.59e-03 | 7.99e-03 | 71 |
| GO:007053611 | Thyroid | ATC | protein K63-linked deubiquitination | 20/6293 | 35/18723 | 3.56e-03 | 1.57e-02 | 20 |
| Page: 1 2 3 |
| Pathway ID | Tissue | Disease Stage | Description | Gene Ratio | Bg Ratio | pvalue | p.adjust | qvalue | Count |
| hsa0414429 | Esophagus | HGIN | Endocytosis | 76/1383 | 251/8465 | 1.74e-08 | 3.34e-07 | 2.65e-07 | 76 |
| hsa04144113 | Esophagus | HGIN | Endocytosis | 76/1383 | 251/8465 | 1.74e-08 | 3.34e-07 | 2.65e-07 | 76 |
| hsa04144210 | Esophagus | ESCC | Endocytosis | 186/4205 | 251/8465 | 9.74e-16 | 4.66e-14 | 2.39e-14 | 186 |
| hsa0414437 | Esophagus | ESCC | Endocytosis | 186/4205 | 251/8465 | 9.74e-16 | 4.66e-14 | 2.39e-14 | 186 |
| hsa0414422 | Liver | HCC | Endocytosis | 178/4020 | 251/8465 | 2.03e-14 | 5.22e-13 | 2.91e-13 | 178 |
| hsa0414432 | Liver | HCC | Endocytosis | 178/4020 | 251/8465 | 2.03e-14 | 5.22e-13 | 2.91e-13 | 178 |
| hsa0414427 | Oral cavity | OSCC | Endocytosis | 174/3704 | 251/8465 | 9.42e-17 | 4.51e-15 | 2.29e-15 | 174 |
| hsa04144112 | Oral cavity | OSCC | Endocytosis | 174/3704 | 251/8465 | 9.42e-17 | 4.51e-15 | 2.29e-15 | 174 |
| hsa0414428 | Oral cavity | LP | Endocytosis | 121/2418 | 251/8465 | 1.89e-11 | 3.70e-10 | 2.38e-10 | 121 |
| hsa0414436 | Oral cavity | LP | Endocytosis | 121/2418 | 251/8465 | 1.89e-11 | 3.70e-10 | 2.38e-10 | 121 |
| Page: 1 |
Top |
Cell-cell communication analysis |
| Identification of potential cell-cell interactions between two cell types and their ligand-receptor pairs for different disease states |
| Ligand | Receptor | LRpair | Pathway | Tissue | Disease Stage |
| Page: 1 |
Top |
Single-cell gene regulatory network inference analysis |
| Find out the significant the regulons (TFs) and the target genes of each regulon across cell types for different disease states |
| TF | Cell Type | Tissue | Disease Stage | Target Gene | RSS | Regulon Activity |
| ∗The dot plots of a searched regulon are shown for all cell subpopulations in each disease state of each tissue based on the regulon specific score inferred using pySCENIC and by calculating the average expression. |
| Page: 1 |
Top |
Somatic mutation of malignant transformation related genes |
| Annotation of somatic variants for genes involved in malignant transformation |
| Hugo Symbol | Variant Class | Variant Classification | dbSNP RS | HGVSc | HGVSp | HGVSp Short | SWISSPROT | BIOTYPE | SIFT | PolyPhen | Tumor Sample Barcode | Tissue | Histology | Sex | Age | Stage | Therapy Types | Drugs | Outcome |
| STAMBP | SNV | Missense_Mutation | c.103N>T | p.Arg35Trp | p.R35W | O95630 | protein_coding | deleterious(0.01) | benign(0.344) | TCGA-A8-A09Q-01 | Breast | breast invasive carcinoma | Female | >=65 | III/IV | Hormone Therapy | anastrozole | SD | |
| STAMBP | SNV | Missense_Mutation | novel | c.312A>C | p.Glu104Asp | p.E104D | O95630 | protein_coding | tolerated(0.53) | benign(0.019) | TCGA-E9-A3X8-01 | Breast | breast invasive carcinoma | Female | <65 | I/II | Chemotherapy | cyclophosphane | CR |
| STAMBP | deletion | Frame_Shift_Del | novel | c.239delA | p.Tyr80SerfsTer13 | p.Y80Sfs*13 | O95630 | protein_coding | TCGA-D8-A27V-01 | Breast | breast invasive carcinoma | Female | <65 | I/II | Hormone Therapy | tamoxiphen | SD | ||
| STAMBP | deletion | Frame_Shift_Del | novel | c.668delN | p.Thr223LysfsTer3 | p.T223Kfs*3 | O95630 | protein_coding | TCGA-OL-A5RU-01 | Breast | breast invasive carcinoma | Female | <65 | I/II | Chemotherapy | cyclophosphamide | CR | ||
| STAMBP | SNV | Missense_Mutation | c.1128N>A | p.Phe376Leu | p.F376L | O95630 | protein_coding | tolerated(0.09) | benign(0.025) | TCGA-AA-A010-01 | Colorectum | colon adenocarcinoma | Female | <65 | I/II | Chemotherapy | folinic | CR | |
| STAMBP | SNV | Missense_Mutation | rs766533447 | c.533N>A | p.Arg178Gln | p.R178Q | O95630 | protein_coding | tolerated(0.44) | benign(0.251) | TCGA-AA-A022-01 | Colorectum | colon adenocarcinoma | Female | >=65 | I/II | Unknown | Unknown | SD |
| STAMBP | SNV | Missense_Mutation | rs750544616 | c.488N>G | p.His163Arg | p.H163R | O95630 | protein_coding | tolerated(1) | benign(0.001) | TCGA-AD-6889-01 | Colorectum | colon adenocarcinoma | Male | >=65 | I/II | Chemotherapy | xeloda | PD |
| STAMBP | SNV | Missense_Mutation | novel | c.730A>C | p.Asn244His | p.N244H | O95630 | protein_coding | deleterious(0.01) | benign(0.001) | TCGA-AY-4070-01 | Colorectum | colon adenocarcinoma | Female | <65 | III/IV | Chemotherapy | 5-fu | PD |
| STAMBP | SNV | Missense_Mutation | c.794C>A | p.Pro265Gln | p.P265Q | O95630 | protein_coding | tolerated(0.44) | benign(0.007) | TCGA-CM-4750-01 | Colorectum | colon adenocarcinoma | Female | <65 | III/IV | Chemotherapy | fluorouracil | SD | |
| STAMBP | SNV | Missense_Mutation | c.1043A>G | p.Asp348Gly | p.D348G | O95630 | protein_coding | deleterious(0) | probably_damaging(1) | TCGA-G4-6586-01 | Colorectum | colon adenocarcinoma | Female | >=65 | I/II | Unknown | Unknown | SD |
| Page: 1 2 3 4 5 |
Top |
Related drugs of malignant transformation related genes |
| Identification of chemicals and drugs interact with genes involved in malignant transfromation |
| (DGIdb 4.0) |
| Entrez ID | Symbol | Category | Interaction Types | Drug Claim Name | Drug Name | PMIDs |
| Page: 1 |

Copyright 2023-Present -The University of Texas Health Science Center at Houston |