
|
|||||
|
 | |
| |
| |
| |
| |
| |
|
Gene: SNRPA |
Gene summary for SNRPA |
| Gene information | Species | Human | Gene symbol | SNRPA | Gene ID | 6626 |
| Gene name | small nuclear ribonucleoprotein polypeptide A | |
| Gene Alias | Mud1 | |
| Cytomap | 19q13.2 | |
| Gene Type | protein-coding | GO ID | GO:0000375 | UniProtAcc | P09012 |
Top |
Malignant transformation analysis |
| Identification of the aberrant gene expression in precancerous and cancerous lesions by comparing the gene expression of stem-like cells in diseased tissues with normal stem cells |
| Entrez ID | Symbol | Replicates | Species | Organ | Tissue | Adj P-value | Log2FC | Malignancy |
| 6626 | SNRPA | HTA11_3410_2000001011 | Human | Colorectum | AD | 2.68e-03 | 1.22e-01 | 0.0155 |
| 6626 | SNRPA | HTA11_3361_2000001011 | Human | Colorectum | AD | 2.37e-03 | 3.61e-01 | -0.1207 |
| 6626 | SNRPA | HTA11_696_2000001011 | Human | Colorectum | AD | 2.43e-11 | 4.19e-01 | -0.1464 |
| 6626 | SNRPA | HTA11_1391_2000001011 | Human | Colorectum | AD | 2.65e-07 | 5.73e-01 | -0.059 |
| 6626 | SNRPA | HTA11_866_3004761011 | Human | Colorectum | AD | 1.52e-02 | 2.79e-01 | 0.096 |
| 6626 | SNRPA | HTA11_4255_2000001011 | Human | Colorectum | SER | 3.01e-04 | 4.71e-01 | 0.0446 |
| 6626 | SNRPA | HTA11_7696_3000711011 | Human | Colorectum | AD | 2.89e-14 | 4.41e-01 | 0.0674 |
| 6626 | SNRPA | HTA11_99999970781_79442 | Human | Colorectum | MSS | 1.59e-02 | 2.65e-01 | 0.294 |
| 6626 | SNRPA | HTA11_99999971662_82457 | Human | Colorectum | MSS | 6.11e-08 | 4.65e-01 | 0.3859 |
| 6626 | SNRPA | HTA11_99999974143_84620 | Human | Colorectum | MSS | 3.90e-03 | 1.97e-01 | 0.3005 |
| 6626 | SNRPA | LZE4T | Human | Esophagus | ESCC | 1.67e-05 | 3.09e-01 | 0.0811 |
| 6626 | SNRPA | LZE7T | Human | Esophagus | ESCC | 5.37e-17 | 1.03e+00 | 0.0667 |
| 6626 | SNRPA | LZE8T | Human | Esophagus | ESCC | 3.34e-08 | 4.53e-01 | 0.067 |
| 6626 | SNRPA | LZE22T | Human | Esophagus | ESCC | 1.33e-03 | 8.12e-01 | 0.068 |
| 6626 | SNRPA | LZE24T | Human | Esophagus | ESCC | 4.35e-13 | 5.41e-01 | 0.0596 |
| 6626 | SNRPA | LZE6T | Human | Esophagus | ESCC | 1.51e-08 | 5.13e-01 | 0.0845 |
| 6626 | SNRPA | P1T-E | Human | Esophagus | ESCC | 5.07e-08 | 8.69e-01 | 0.0875 |
| 6626 | SNRPA | P2T-E | Human | Esophagus | ESCC | 3.03e-45 | 9.68e-01 | 0.1177 |
| 6626 | SNRPA | P4T-E | Human | Esophagus | ESCC | 2.34e-35 | 1.29e+00 | 0.1323 |
| 6626 | SNRPA | P5T-E | Human | Esophagus | ESCC | 1.56e-64 | 1.29e+00 | 0.1327 |
| Page: 1 2 3 4 5 6 7 |
| Tissue | Expression Dynamics | Abbreviation |
| Colorectum (GSE201348) |  | FAP: Familial adenomatous polyposis |
| CRC: Colorectal cancer | ||
| Colorectum (HTA11) |  | AD: Adenomas |
| SER: Sessile serrated lesions | ||
| MSI-H: Microsatellite-high colorectal cancer | ||
| MSS: Microsatellite stable colorectal cancer | ||
| Esophagus | 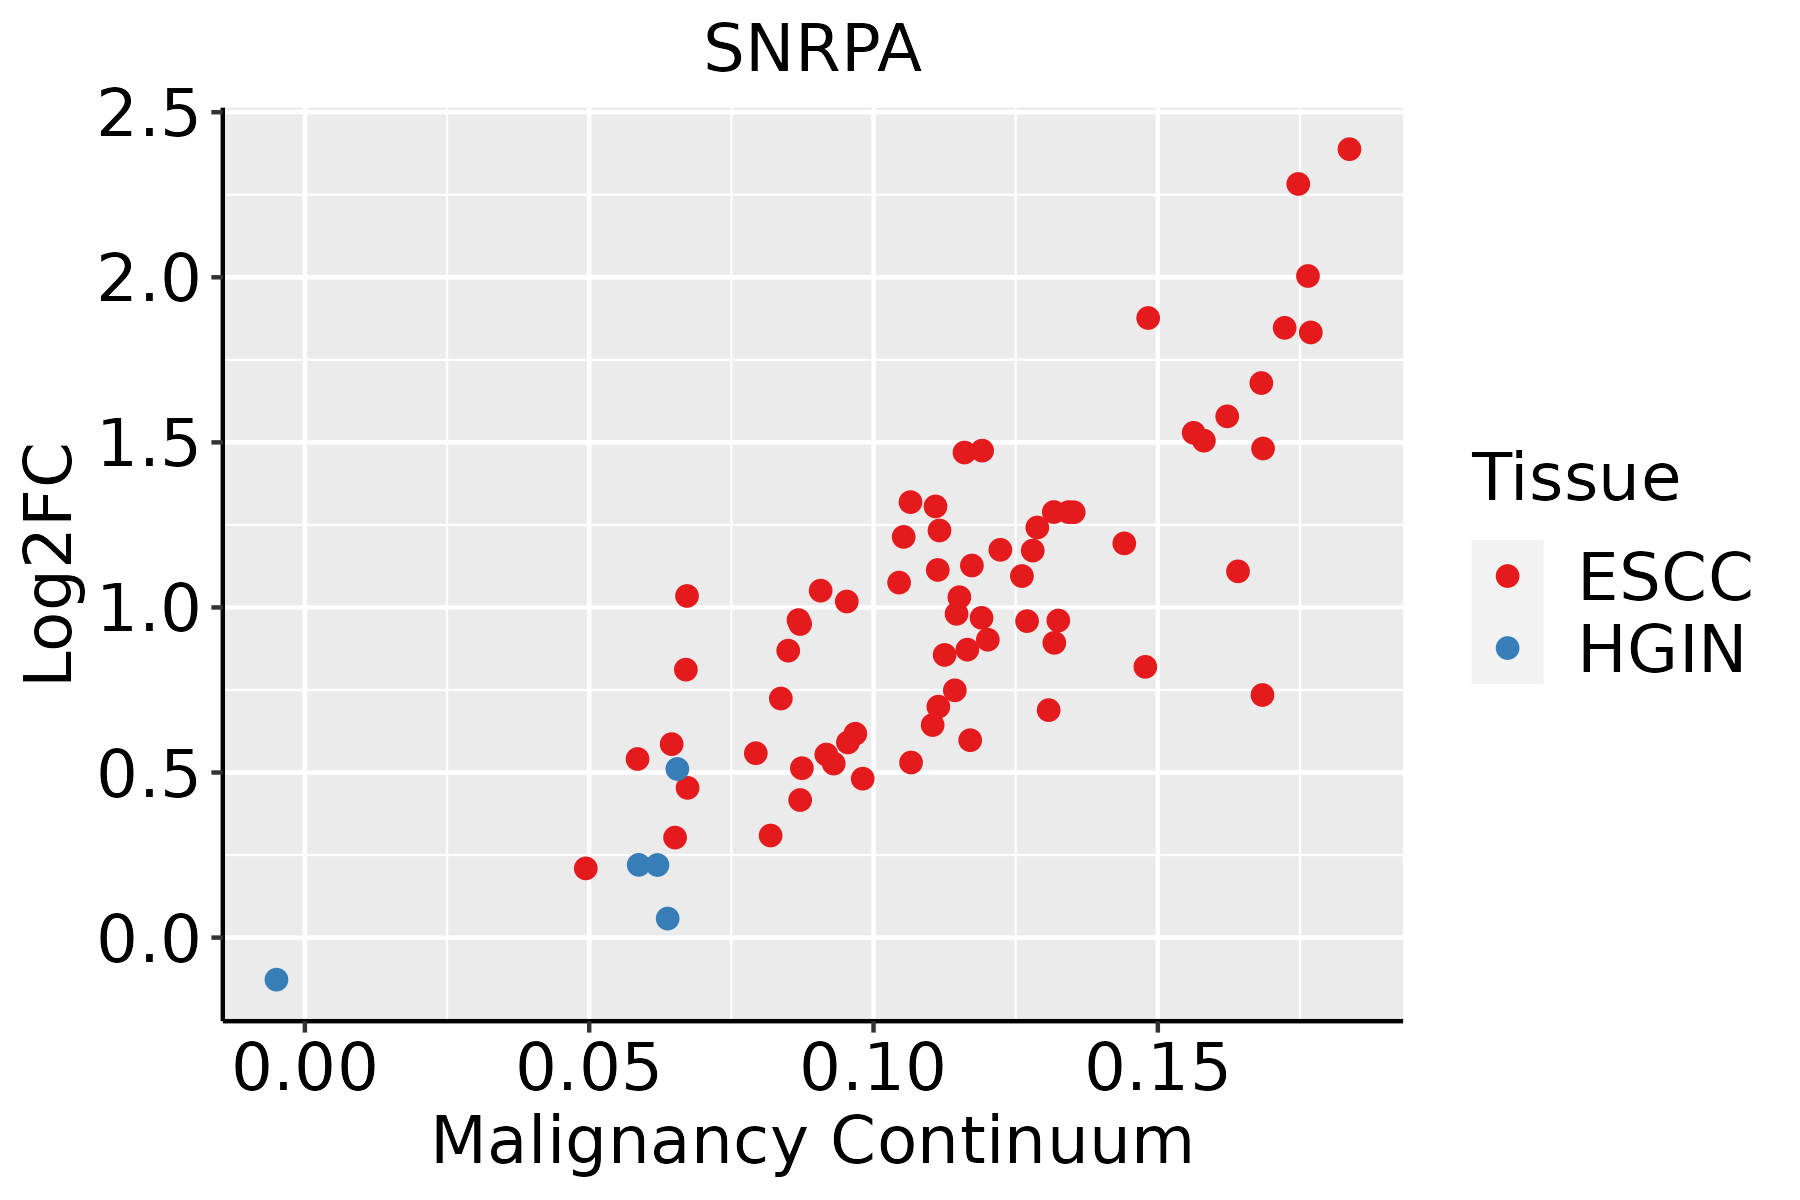 | ESCC: Esophageal squamous cell carcinoma |
| HGIN: High-grade intraepithelial neoplasias | ||
| LGIN: Low-grade intraepithelial neoplasias | ||
| Liver | 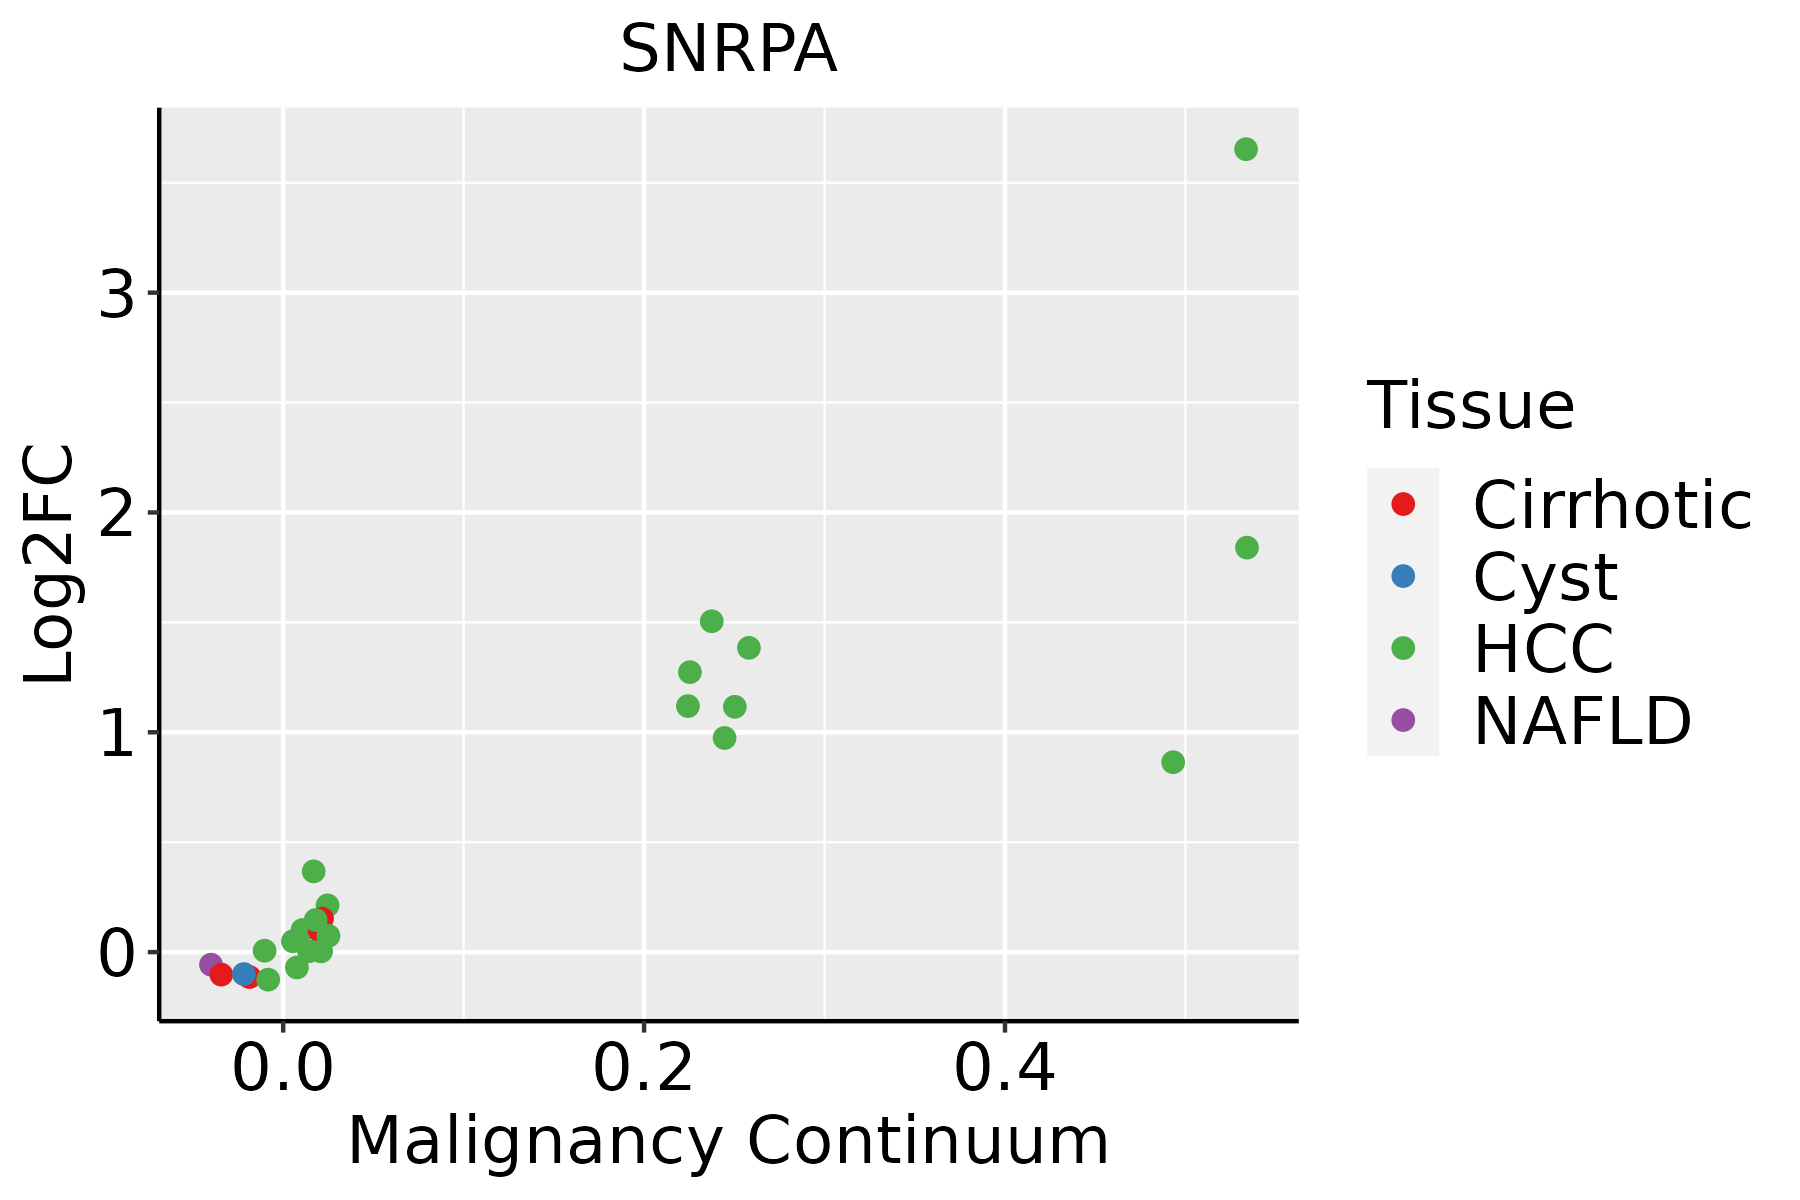 | HCC: Hepatocellular carcinoma |
| NAFLD: Non-alcoholic fatty liver disease | ||
| Oral Cavity | 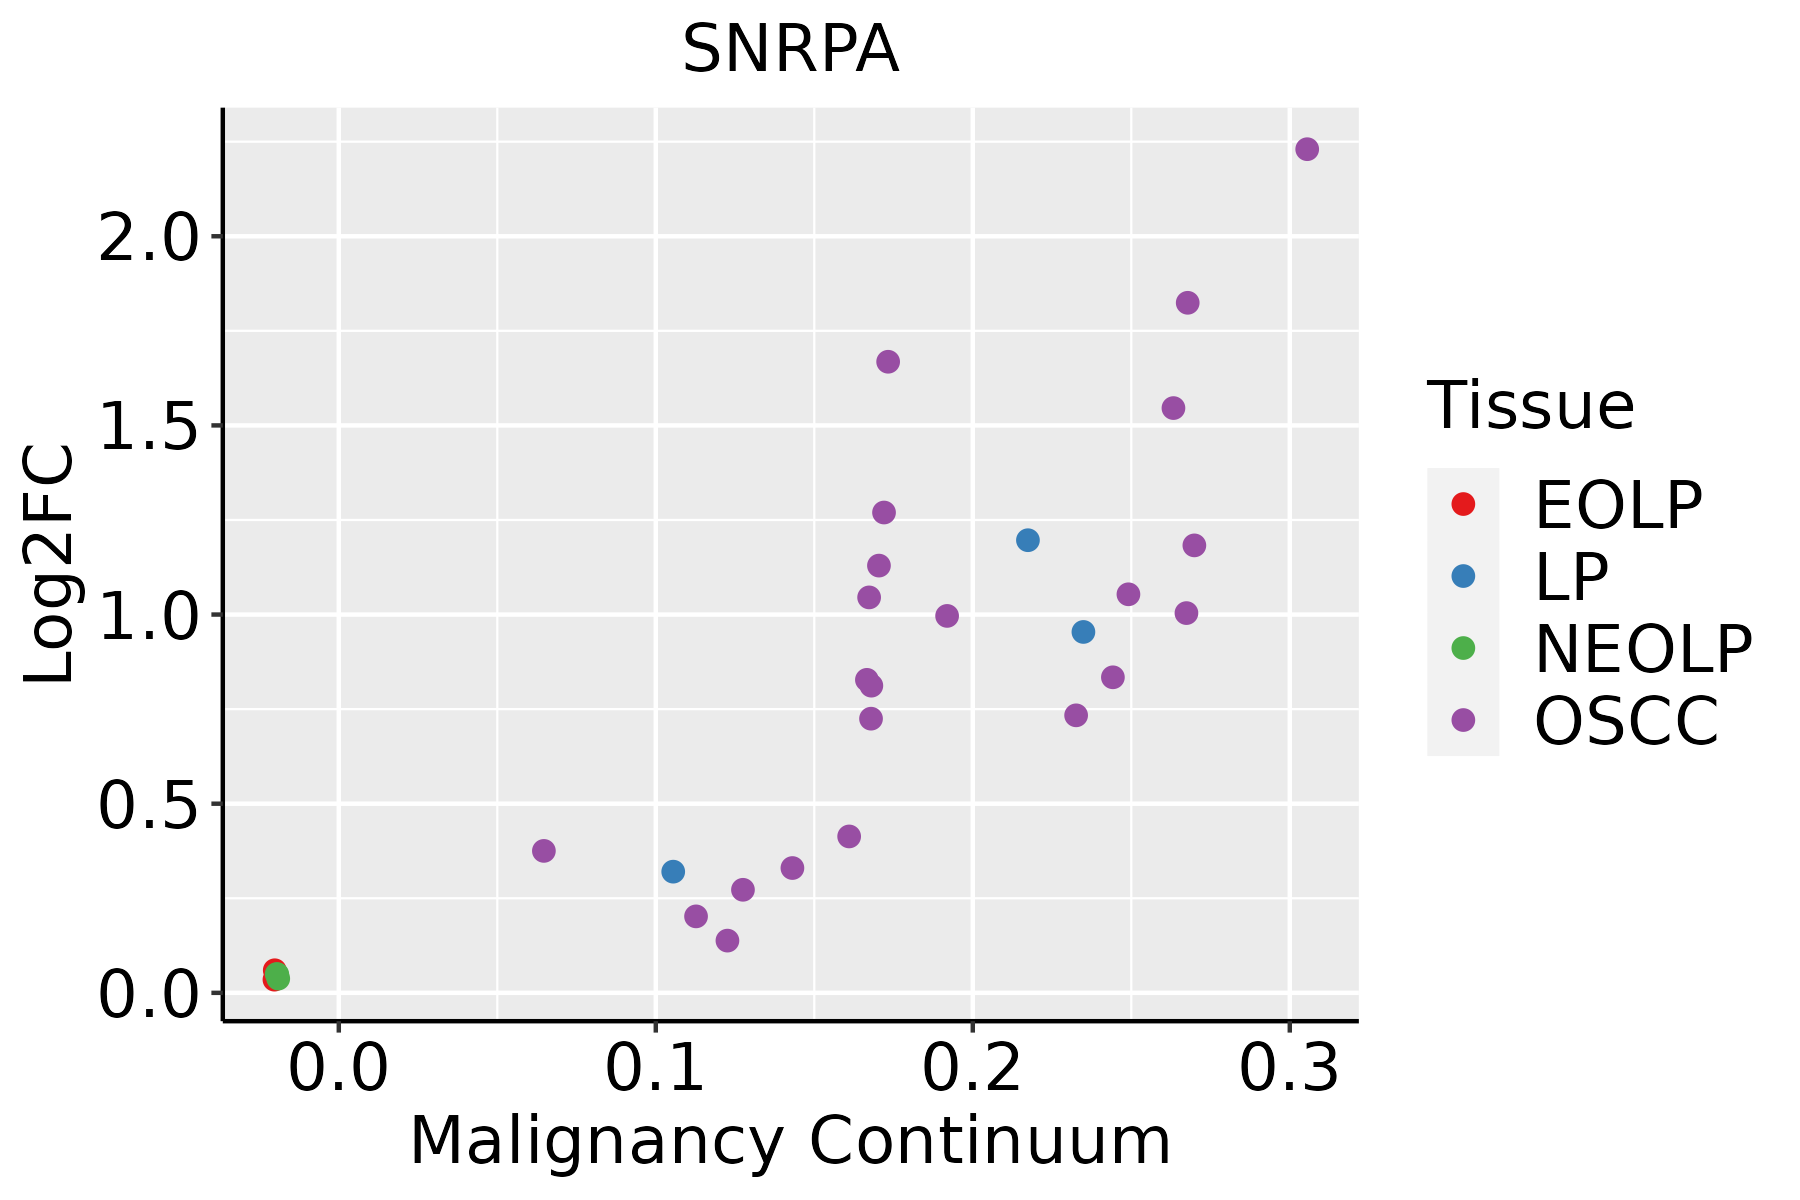 | EOLP: Erosive Oral lichen planus |
| LP: leukoplakia | ||
| NEOLP: Non-erosive oral lichen planus | ||
| OSCC: Oral squamous cell carcinoma | ||
| Skin | 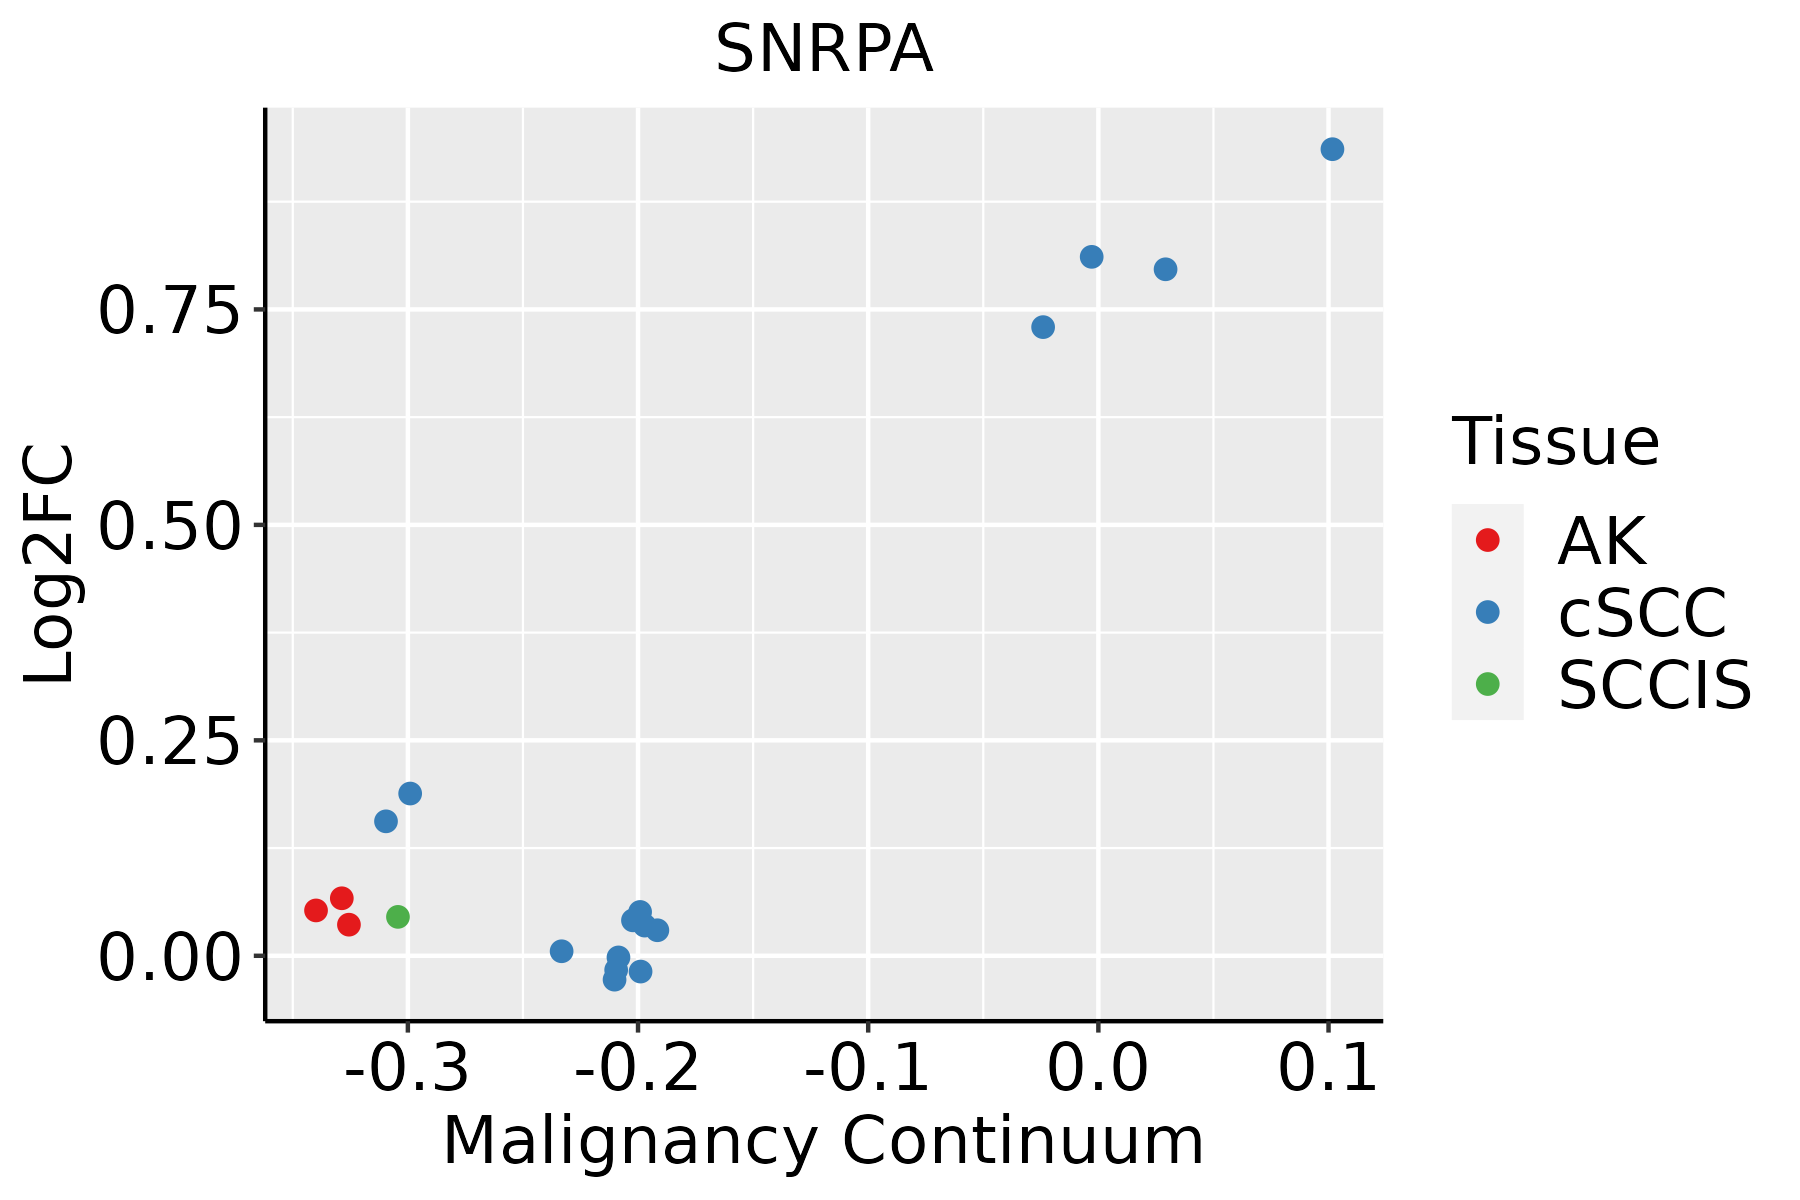 | AK: Actinic keratosis |
| cSCC: Cutaneous squamous cell carcinoma | ||
| SCCIS:squamous cell carcinoma in situ | ||
| Thyroid | 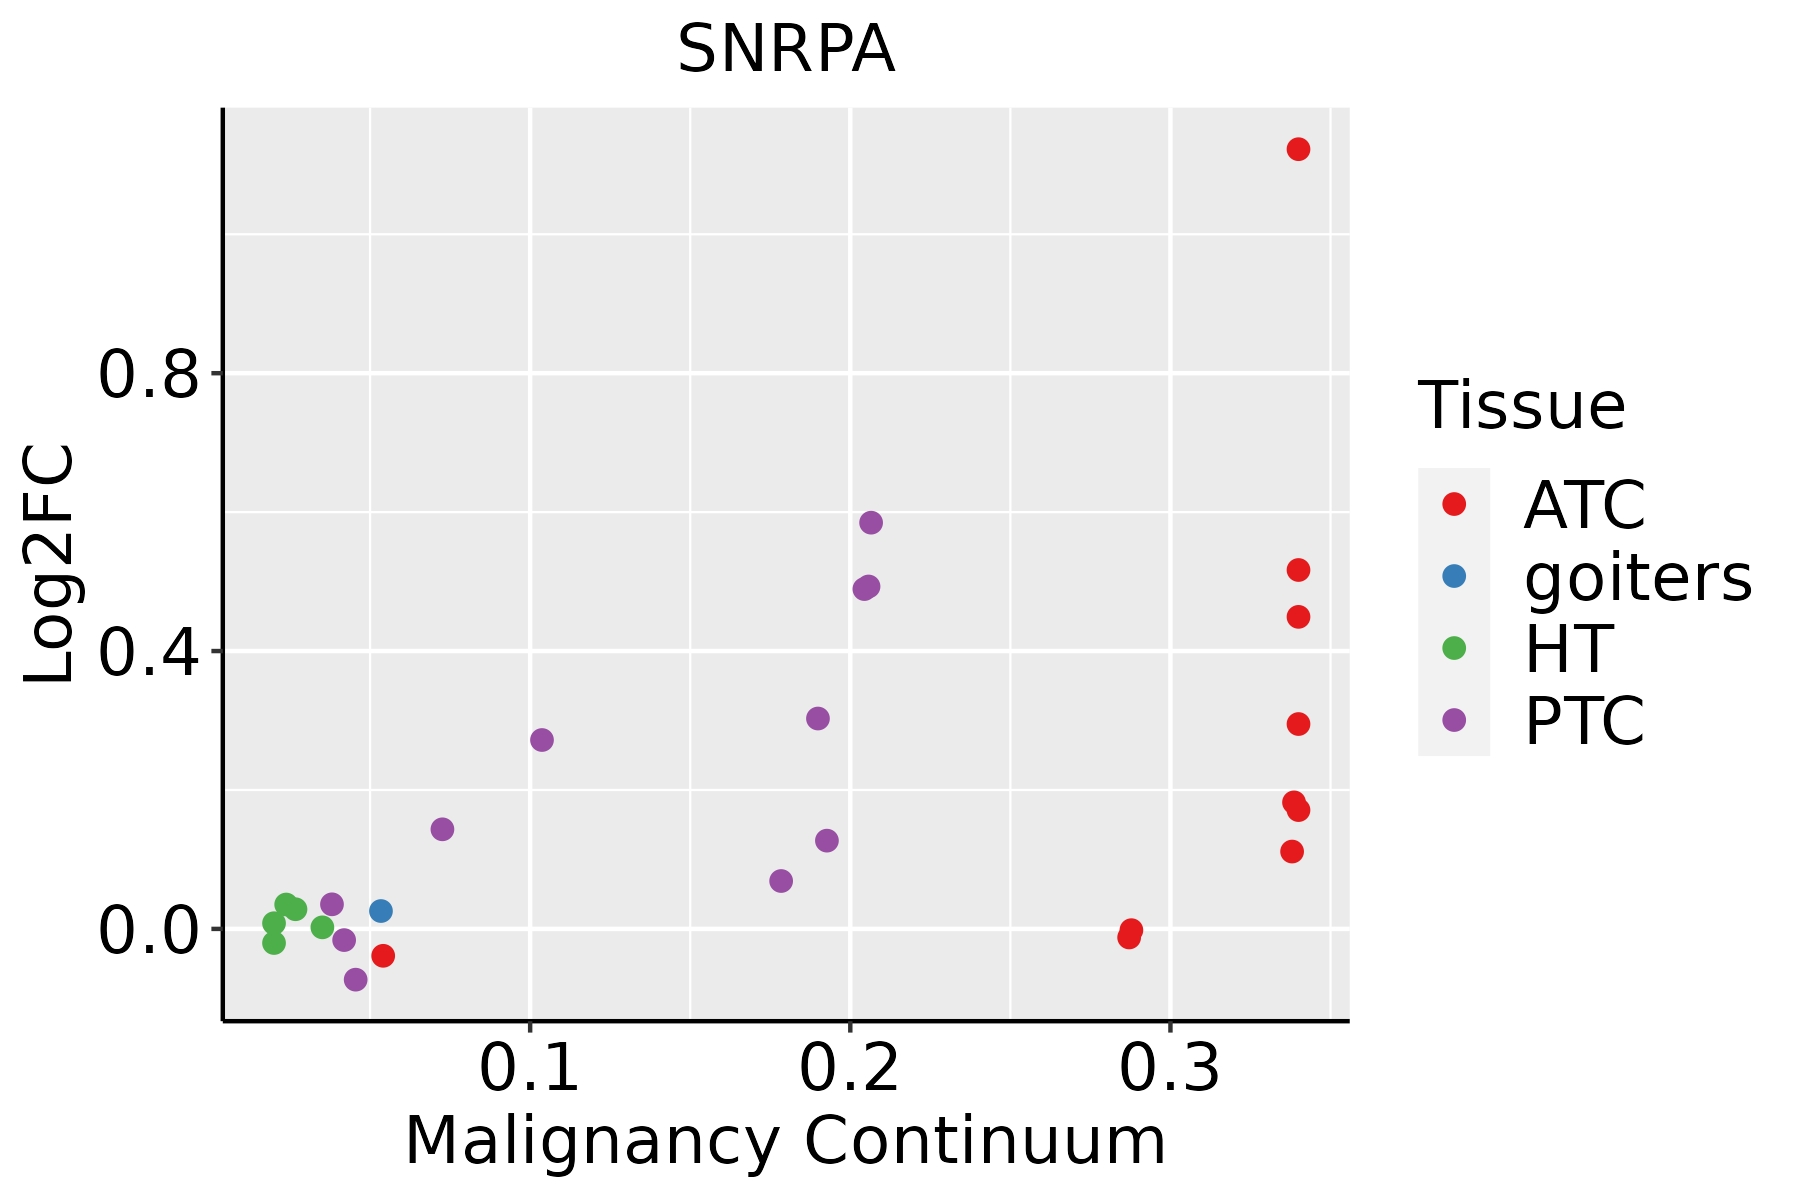 | ATC: Anaplastic thyroid cancer |
| HT: Hashimoto's thyroiditis | ||
| PTC: Papillary thyroid cancer |
| ∗log2FC in expression of this searched gene in stem-like cells from each diseased tissue sample relative to stem-like cells in normal samples in each tissue plotted against the malignancy continuum. Samples are colored based on if they are from different disease stage. |
Top |
Malignant transformation related pathway analysis |
| Find out the enriched GO biological processes and KEGG pathways involved in transition from healthy to precancer to cancer |
| Tissue | Disease Stage | Enriched GO biological Processes |
| Colorectum | AD |  |
| Colorectum | SER |  |
| Colorectum | MSS |  |
| Colorectum | MSI-H |  |
| Colorectum | FAP |  |
| ∗Top 15 enriched GO BP terms are showed in the bar plot of each disease state in each tissue. Each row represents a significant GO biological process which is colored according to the -log10(p.adjust). |
| Page: 1 2 3 4 5 6 7 8 9 |
| GO ID | Tissue | Disease Stage | Description | Gene Ratio | Bg Ratio | pvalue | p.adjust | Count |
| GO:0008380112 | Skin | cSCC | RNA splicing | 263/4864 | 434/18723 | 2.45e-53 | 5.13e-50 | 263 |
| GO:0000375112 | Skin | cSCC | RNA splicing, via transesterification reactions | 201/4864 | 324/18723 | 4.07e-43 | 5.10e-40 | 201 |
| GO:0000377112 | Skin | cSCC | RNA splicing, via transesterification reactions with bulged adenosine as nucleophile | 197/4864 | 320/18723 | 1.45e-41 | 1.14e-38 | 197 |
| GO:0000398112 | Skin | cSCC | mRNA splicing, via spliceosome | 197/4864 | 320/18723 | 1.45e-41 | 1.14e-38 | 197 |
| GO:0008380113 | Thyroid | PTC | RNA splicing | 273/5968 | 434/18723 | 4.44e-41 | 1.40e-37 | 273 |
| GO:0000375113 | Thyroid | PTC | RNA splicing, via transesterification reactions | 202/5968 | 324/18723 | 6.81e-30 | 3.91e-27 | 202 |
| GO:0000377113 | Thyroid | PTC | RNA splicing, via transesterification reactions with bulged adenosine as nucleophile | 199/5968 | 320/18723 | 2.96e-29 | 1.44e-26 | 199 |
| GO:0000398113 | Thyroid | PTC | mRNA splicing, via spliceosome | 199/5968 | 320/18723 | 2.96e-29 | 1.44e-26 | 199 |
| GO:000838034 | Thyroid | ATC | RNA splicing | 270/6293 | 434/18723 | 7.50e-35 | 1.19e-31 | 270 |
| GO:000037534 | Thyroid | ATC | RNA splicing, via transesterification reactions | 200/6293 | 324/18723 | 1.75e-25 | 7.39e-23 | 200 |
| GO:000037734 | Thyroid | ATC | RNA splicing, via transesterification reactions with bulged adenosine as nucleophile | 197/6293 | 320/18723 | 6.54e-25 | 2.18e-22 | 197 |
| GO:000039834 | Thyroid | ATC | mRNA splicing, via spliceosome | 197/6293 | 320/18723 | 6.54e-25 | 2.18e-22 | 197 |
| Page: 1 2 3 |
| Pathway ID | Tissue | Disease Stage | Description | Gene Ratio | Bg Ratio | pvalue | p.adjust | qvalue | Count |
| hsa03040 | Colorectum | AD | Spliceosome | 73/2092 | 217/8465 | 1.73e-03 | 9.68e-03 | 6.18e-03 | 73 |
| hsa030401 | Colorectum | AD | Spliceosome | 73/2092 | 217/8465 | 1.73e-03 | 9.68e-03 | 6.18e-03 | 73 |
| hsa030402 | Colorectum | MSS | Spliceosome | 66/1875 | 217/8465 | 2.58e-03 | 1.27e-02 | 7.81e-03 | 66 |
| hsa030403 | Colorectum | MSS | Spliceosome | 66/1875 | 217/8465 | 2.58e-03 | 1.27e-02 | 7.81e-03 | 66 |
| hsa0304027 | Esophagus | ESCC | Spliceosome | 128/4205 | 217/8465 | 3.31e-03 | 8.79e-03 | 4.50e-03 | 128 |
| hsa0304037 | Esophagus | ESCC | Spliceosome | 128/4205 | 217/8465 | 3.31e-03 | 8.79e-03 | 4.50e-03 | 128 |
| hsa0304022 | Liver | HCC | Spliceosome | 122/4020 | 217/8465 | 5.55e-03 | 1.60e-02 | 8.91e-03 | 122 |
| hsa0304032 | Liver | HCC | Spliceosome | 122/4020 | 217/8465 | 5.55e-03 | 1.60e-02 | 8.91e-03 | 122 |
| hsa0304016 | Oral cavity | OSCC | Spliceosome | 123/3704 | 217/8465 | 7.21e-05 | 2.74e-04 | 1.40e-04 | 123 |
| hsa0304017 | Oral cavity | OSCC | Spliceosome | 123/3704 | 217/8465 | 7.21e-05 | 2.74e-04 | 1.40e-04 | 123 |
| hsa0304026 | Oral cavity | LP | Spliceosome | 106/2418 | 217/8465 | 1.30e-10 | 2.40e-09 | 1.55e-09 | 106 |
| hsa0304036 | Oral cavity | LP | Spliceosome | 106/2418 | 217/8465 | 1.30e-10 | 2.40e-09 | 1.55e-09 | 106 |
| Page: 1 |
Top |
Cell-cell communication analysis |
| Identification of potential cell-cell interactions between two cell types and their ligand-receptor pairs for different disease states |
| Ligand | Receptor | LRpair | Pathway | Tissue | Disease Stage |
| Page: 1 |
Top |
Single-cell gene regulatory network inference analysis |
| Find out the significant the regulons (TFs) and the target genes of each regulon across cell types for different disease states |
| TF | Cell Type | Tissue | Disease Stage | Target Gene | RSS | Regulon Activity |
| ∗The dot plots of a searched regulon are shown for all cell subpopulations in each disease state of each tissue based on the regulon specific score inferred using pySCENIC and by calculating the average expression. |
| Page: 1 |
Top |
Somatic mutation of malignant transformation related genes |
| Annotation of somatic variants for genes involved in malignant transformation |
| Hugo Symbol | Variant Class | Variant Classification | dbSNP RS | HGVSc | HGVSp | HGVSp Short | SWISSPROT | BIOTYPE | SIFT | PolyPhen | Tumor Sample Barcode | Tissue | Histology | Sex | Age | Stage | Therapy Types | Drugs | Outcome |
| SNRPA | SNV | Missense_Mutation | c.146N>C | p.Leu49Pro | p.L49P | P09012 | protein_coding | tolerated(0.24) | benign(0.015) | TCGA-A8-A09Z-01 | Breast | breast invasive carcinoma | Female | >=65 | I/II | Unknown | Unknown | SD | |
| SNRPA | SNV | Missense_Mutation | novel | c.60N>C | p.Lys20Asn | p.K20N | P09012 | protein_coding | deleterious(0) | probably_damaging(0.996) | TCGA-AN-A0AR-01 | Breast | breast invasive carcinoma | Female | <65 | I/II | Unknown | Unknown | SD |
| SNRPA | SNV | Missense_Mutation | rs775040575 | c.455N>A | p.Arg152His | p.R152H | P09012 | protein_coding | tolerated(0.06) | benign(0.382) | TCGA-2W-A8YY-01 | Cervix | cervical & endocervical cancer | Female | <65 | I/II | Chemotherapy | cisplatin | CR |
| SNRPA | SNV | Missense_Mutation | c.358N>A | p.Ala120Thr | p.A120T | P09012 | protein_coding | tolerated(0.41) | benign(0.007) | TCGA-A6-2686-01 | Colorectum | colon adenocarcinoma | Female | >=65 | I/II | Unknown | Unknown | SD | |
| SNRPA | SNV | Missense_Mutation | c.769N>A | p.Ala257Thr | p.A257T | P09012 | protein_coding | deleterious(0) | probably_damaging(0.994) | TCGA-AA-3488-01 | Colorectum | colon adenocarcinoma | Male | <65 | III/IV | Unknown | Unknown | PD | |
| SNRPA | SNV | Missense_Mutation | rs775580802 | c.425N>T | p.Pro142Leu | p.P142L | P09012 | protein_coding | tolerated(0.16) | benign(0.073) | TCGA-CM-4743-01 | Colorectum | colon adenocarcinoma | Male | >=65 | I/II | Chemotherapy | capecitabine | SD |
| SNRPA | SNV | Missense_Mutation | rs368973112 | c.139N>T | p.Arg47Trp | p.R47W | P09012 | protein_coding | deleterious(0) | possibly_damaging(0.884) | TCGA-D5-6928-01 | Colorectum | colon adenocarcinoma | Male | >=65 | I/II | Unknown | Unknown | SD |
| SNRPA | SNV | Missense_Mutation | rs750727750 | c.193N>A | p.Ala65Thr | p.A65T | P09012 | protein_coding | deleterious(0.02) | benign(0.116) | TCGA-AG-A02N-01 | Colorectum | rectum adenocarcinoma | Male | >=65 | I/II | Chemotherapy | folinic | CR |
| SNRPA | SNV | Missense_Mutation | rs773157493 | c.248N>A | p.Arg83His | p.R83H | P09012 | protein_coding | deleterious(0.03) | benign(0.014) | TCGA-AX-A2HC-01 | Endometrium | uterine corpus endometrioid carcinoma | Female | <65 | III/IV | Chemotherapy | paclitaxel | PD |
| SNRPA | SNV | Missense_Mutation | c.551C>T | p.Ala184Val | p.A184V | P09012 | protein_coding | tolerated(0.22) | benign(0.077) | TCGA-B5-A11E-01 | Endometrium | uterine corpus endometrioid carcinoma | Female | <65 | I/II | Unknown | Unknown | SD |
| Page: 1 2 3 4 |
Top |
Related drugs of malignant transformation related genes |
| Identification of chemicals and drugs interact with genes involved in malignant transfromation |
| (DGIdb 4.0) |
| Entrez ID | Symbol | Category | Interaction Types | Drug Claim Name | Drug Name | PMIDs |
| Page: 1 |

Copyright 2023-Present -The University of Texas Health Science Center at Houston |