| Tissue | Expression Dynamics | Abbreviation |
| Cervix | 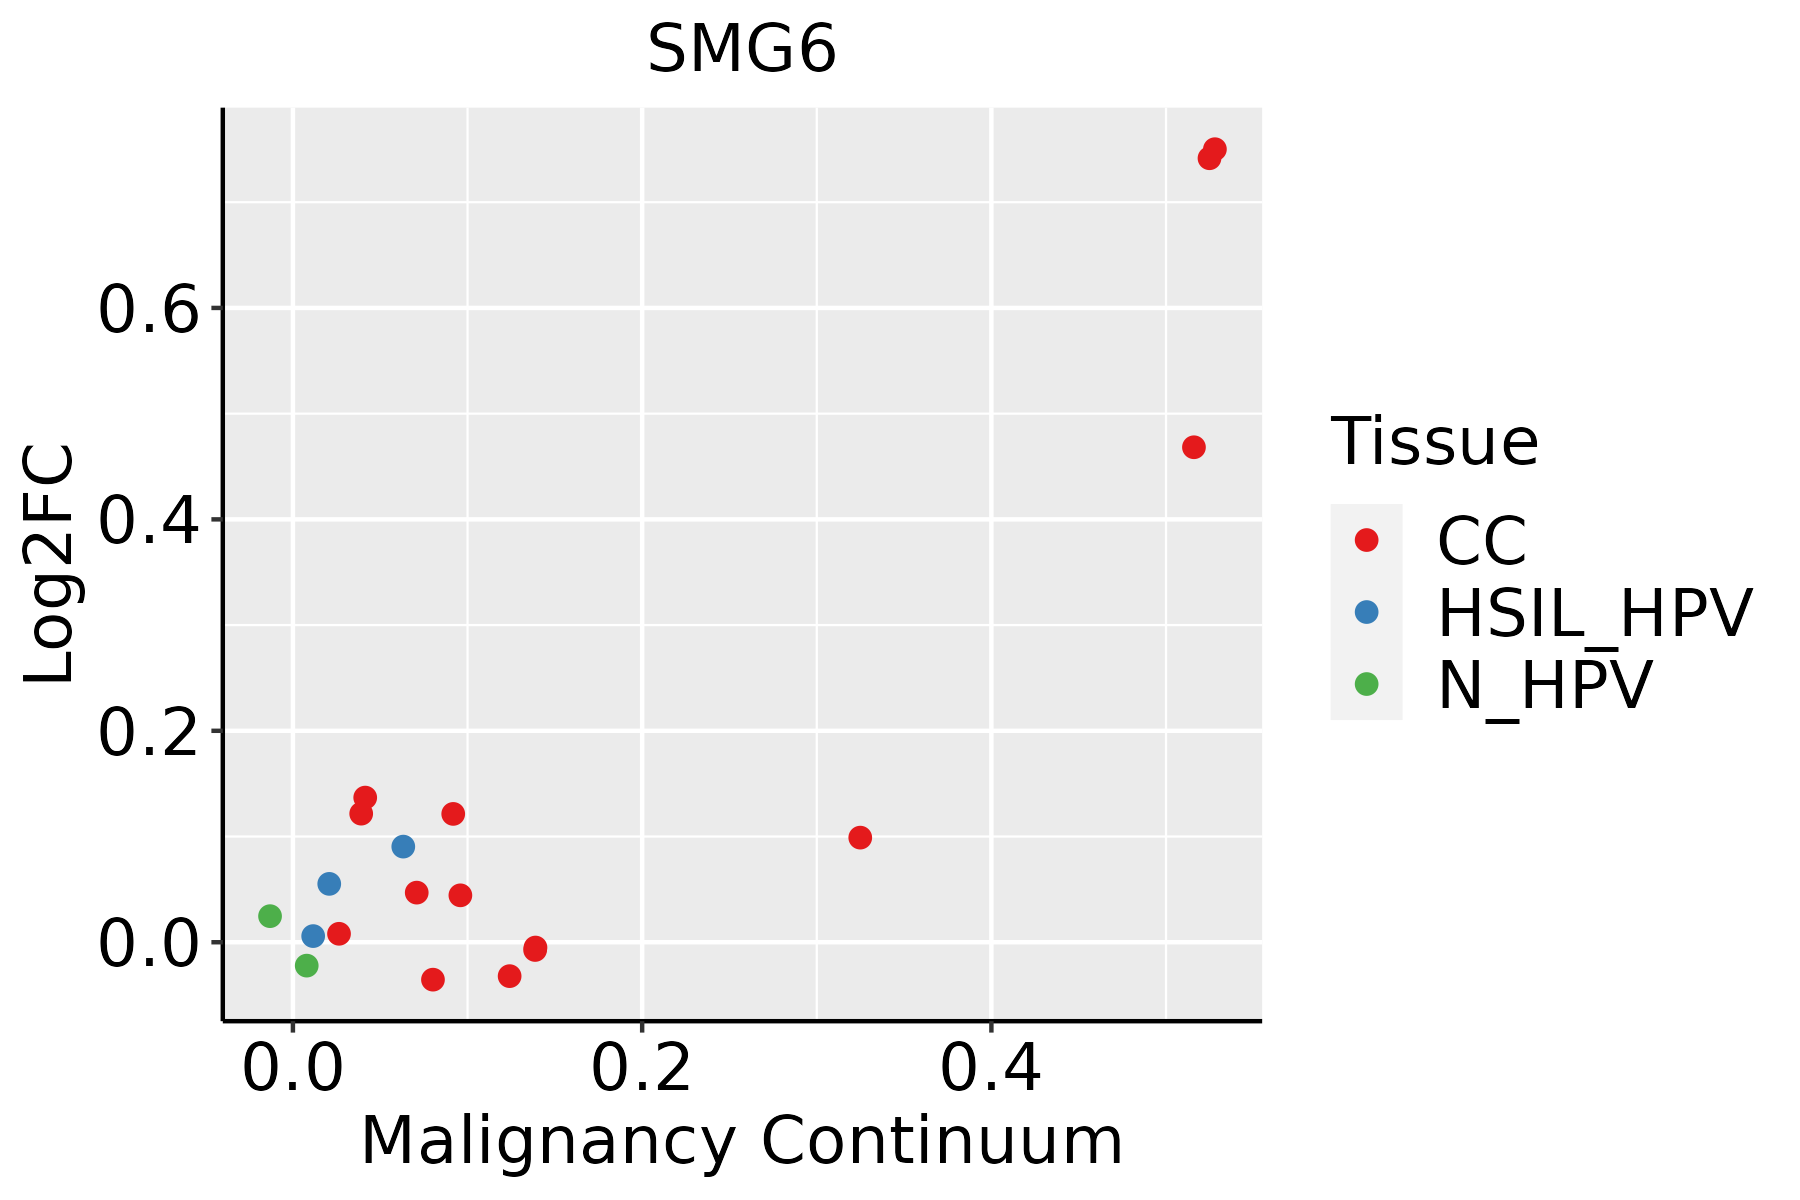 | CC: Cervix cancer |
| HSIL_HPV: HPV-infected high-grade squamous intraepithelial lesions |
| N_HPV: HPV-infected normal cervix |
| Colorectum (GSE201348) |  | FAP: Familial adenomatous polyposis |
| CRC: Colorectal cancer |
| Colorectum (HTA11) |  | AD: Adenomas |
| SER: Sessile serrated lesions |
| MSI-H: Microsatellite-high colorectal cancer |
| MSS: Microsatellite stable colorectal cancer |
| Endometrium | 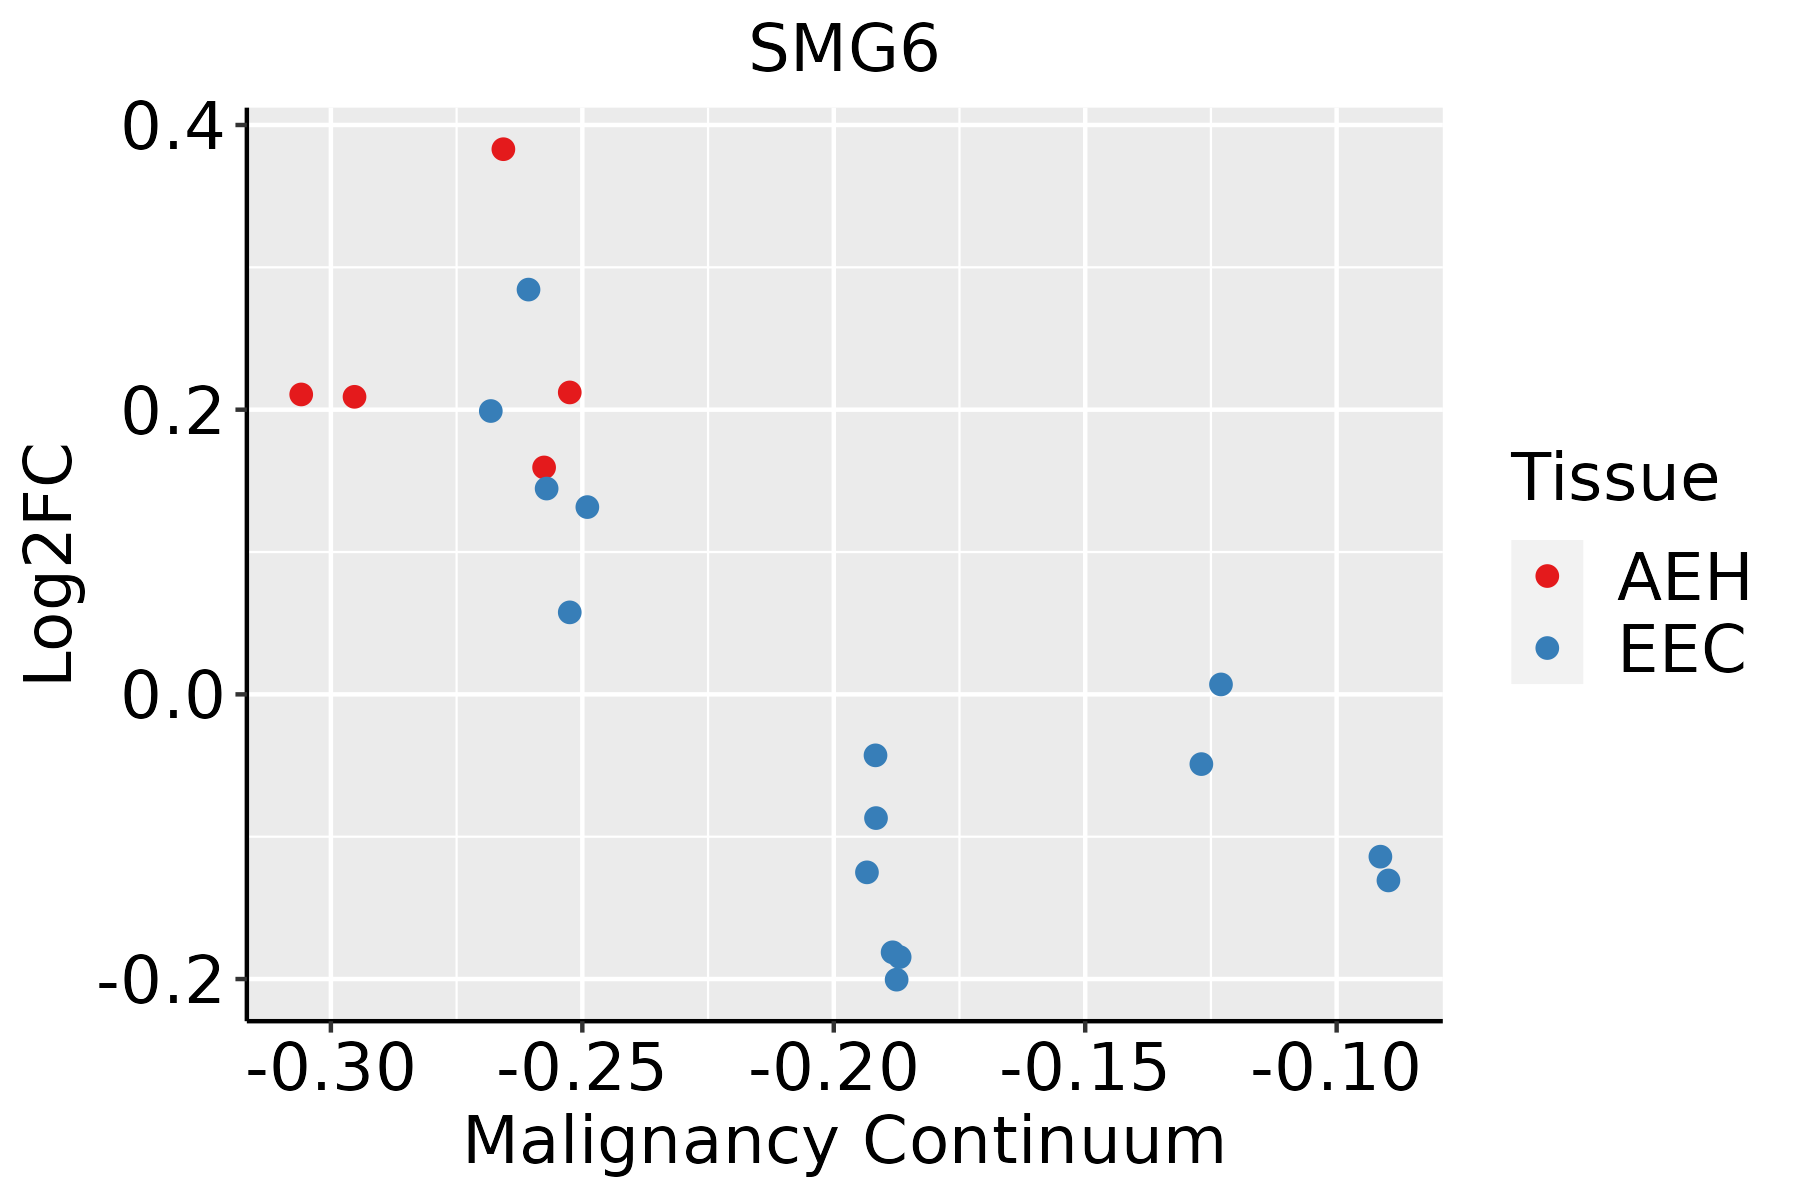 | AEH: Atypical endometrial hyperplasia |
| EEC: Endometrioid Cancer |
| Esophagus | 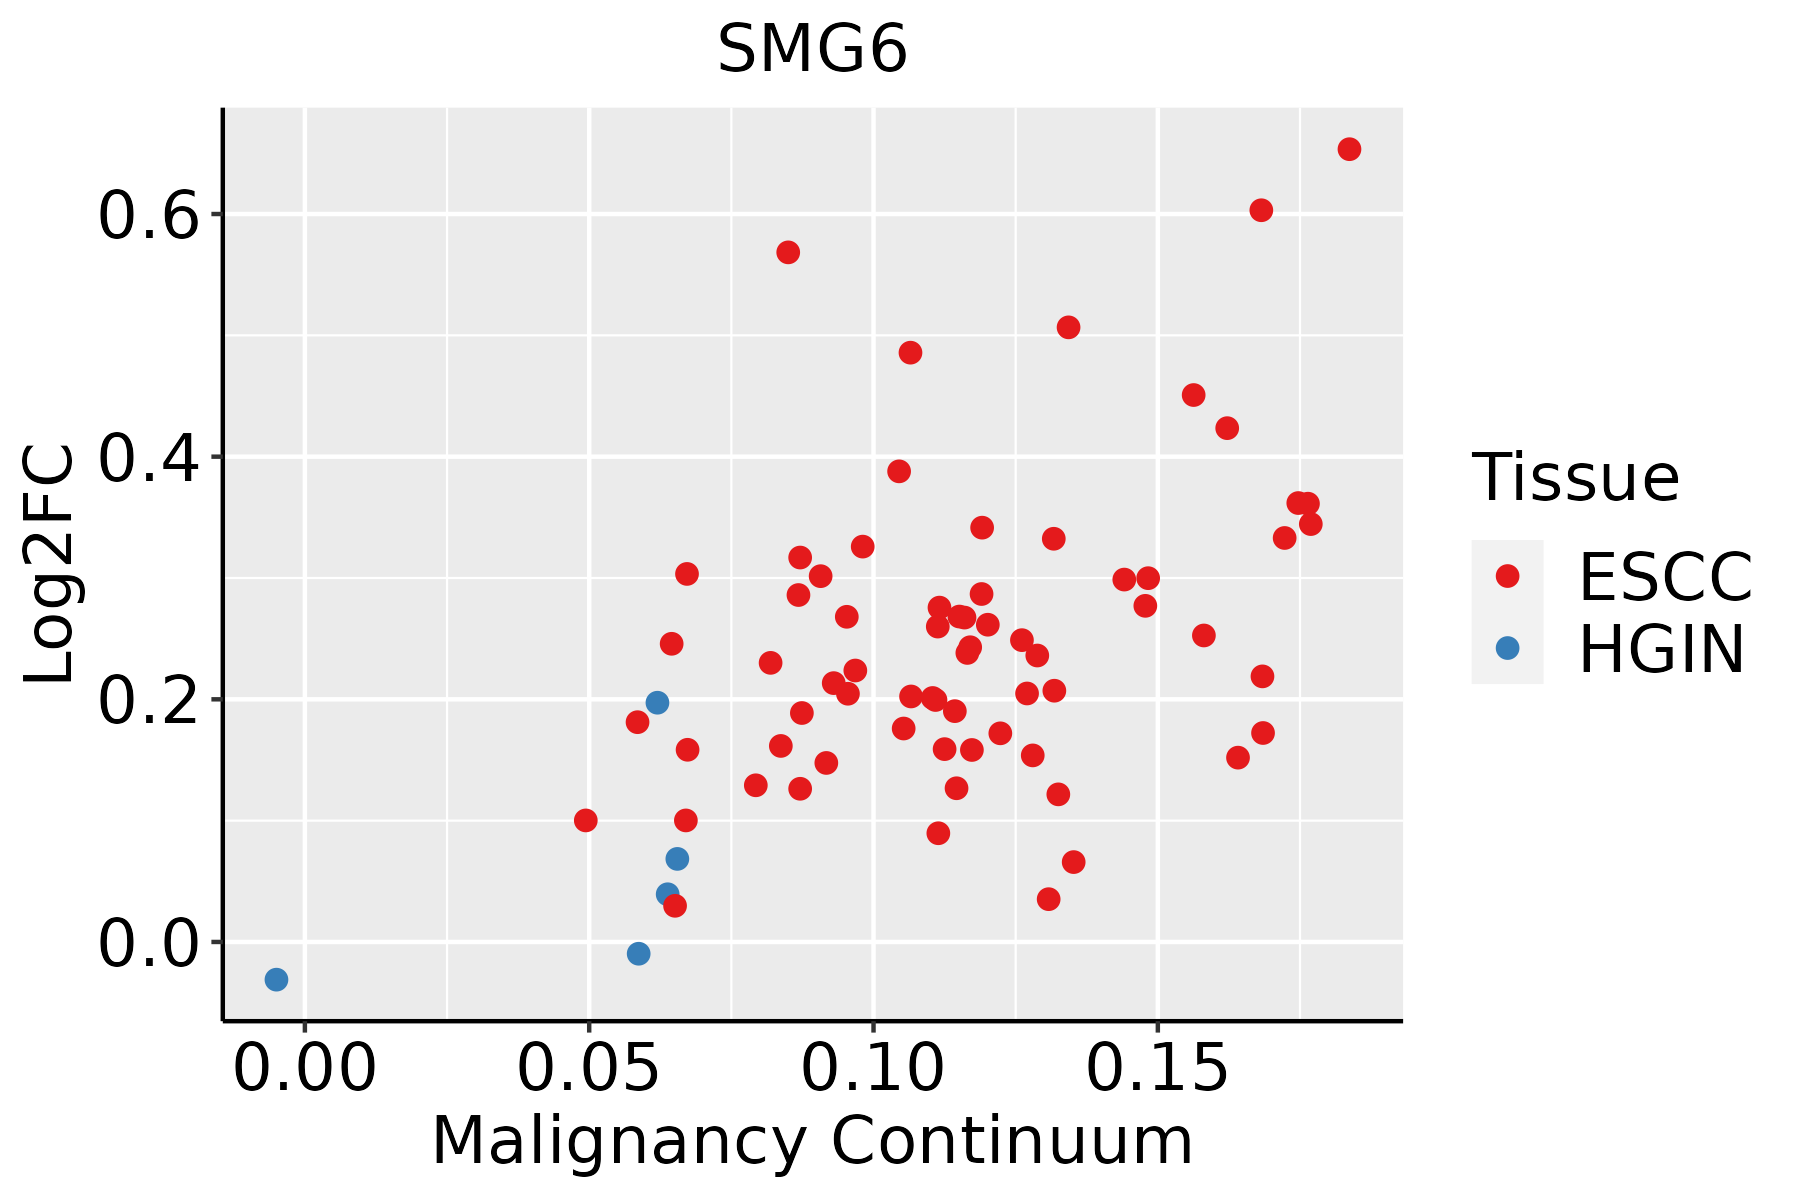 | ESCC: Esophageal squamous cell carcinoma |
| HGIN: High-grade intraepithelial neoplasias |
| LGIN: Low-grade intraepithelial neoplasias |
| Lung | 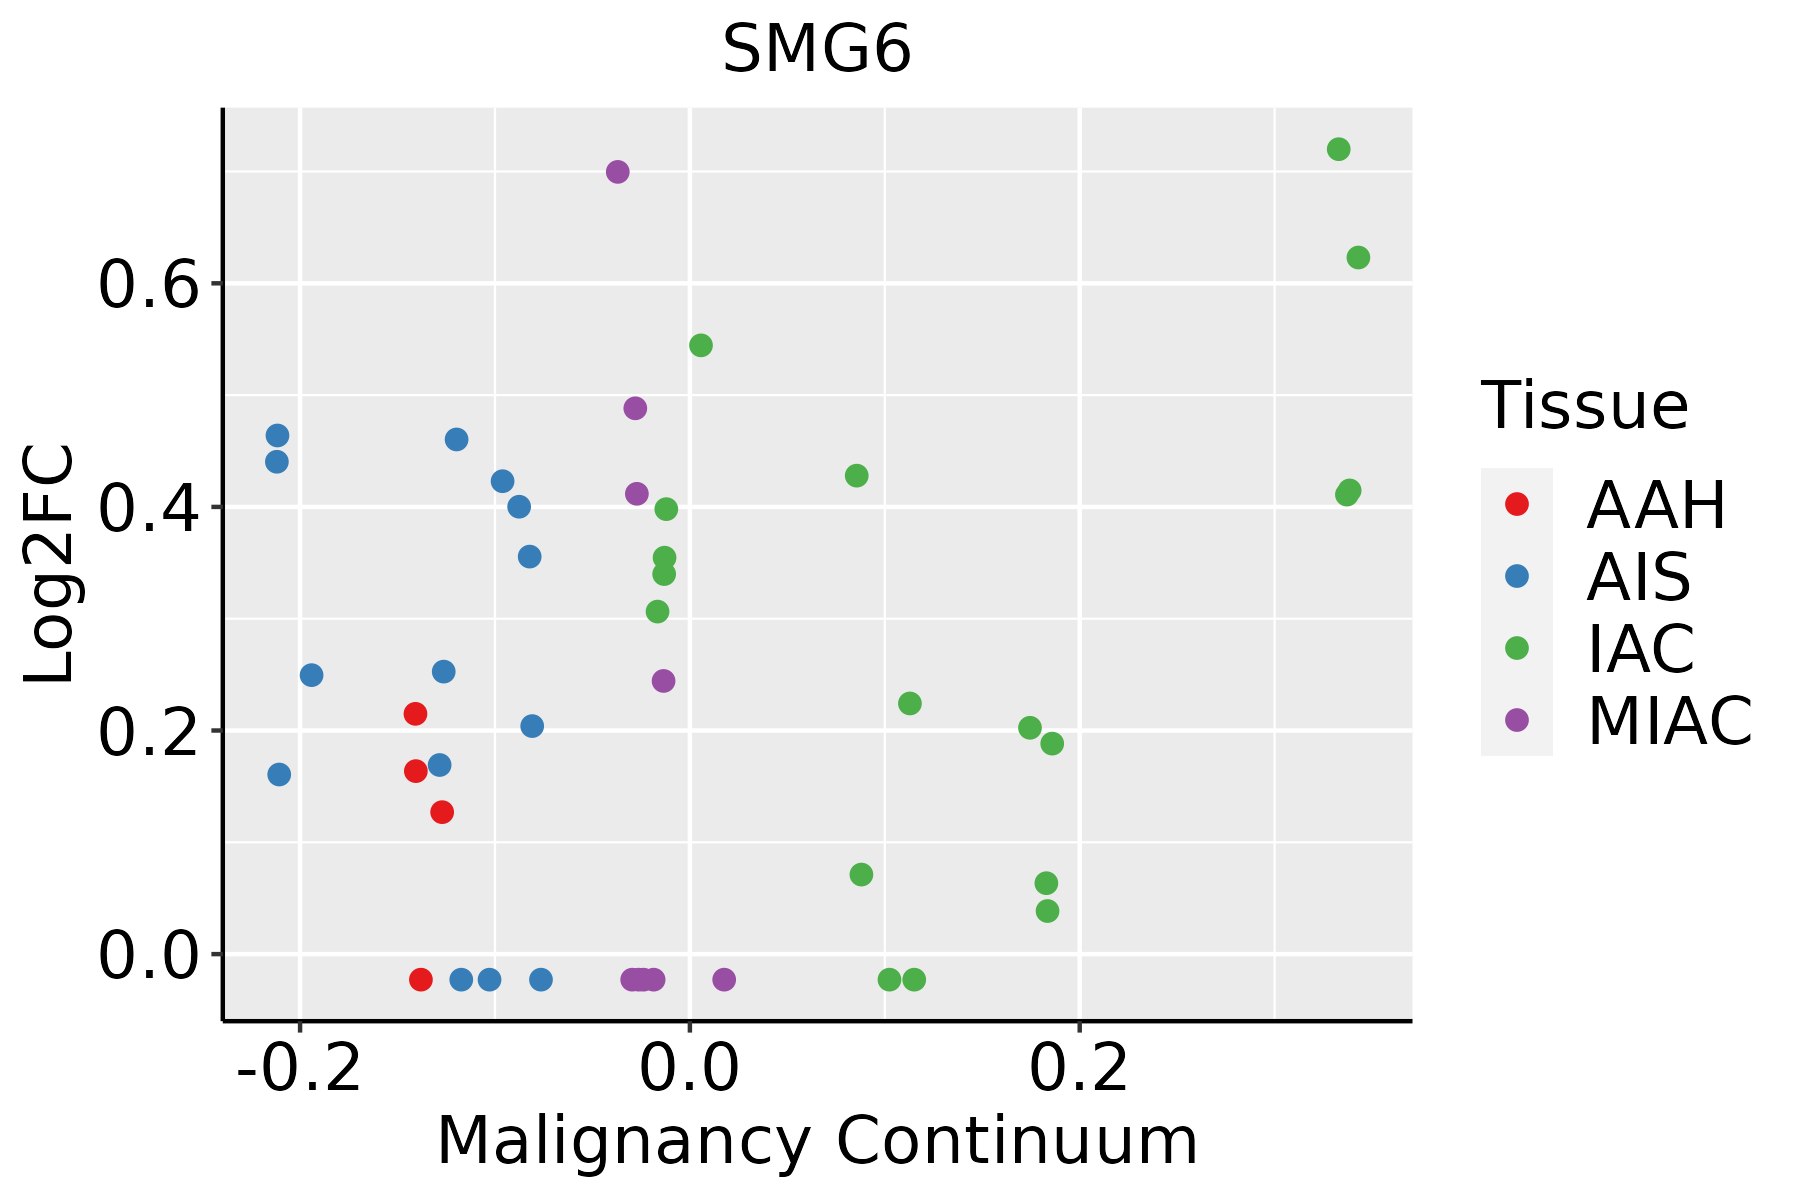 | AAH: Atypical adenomatous hyperplasia |
| AIS: Adenocarcinoma in situ |
| IAC: Invasive lung adenocarcinoma |
| MIA: Minimally invasive adenocarcinoma |
| Oral Cavity | 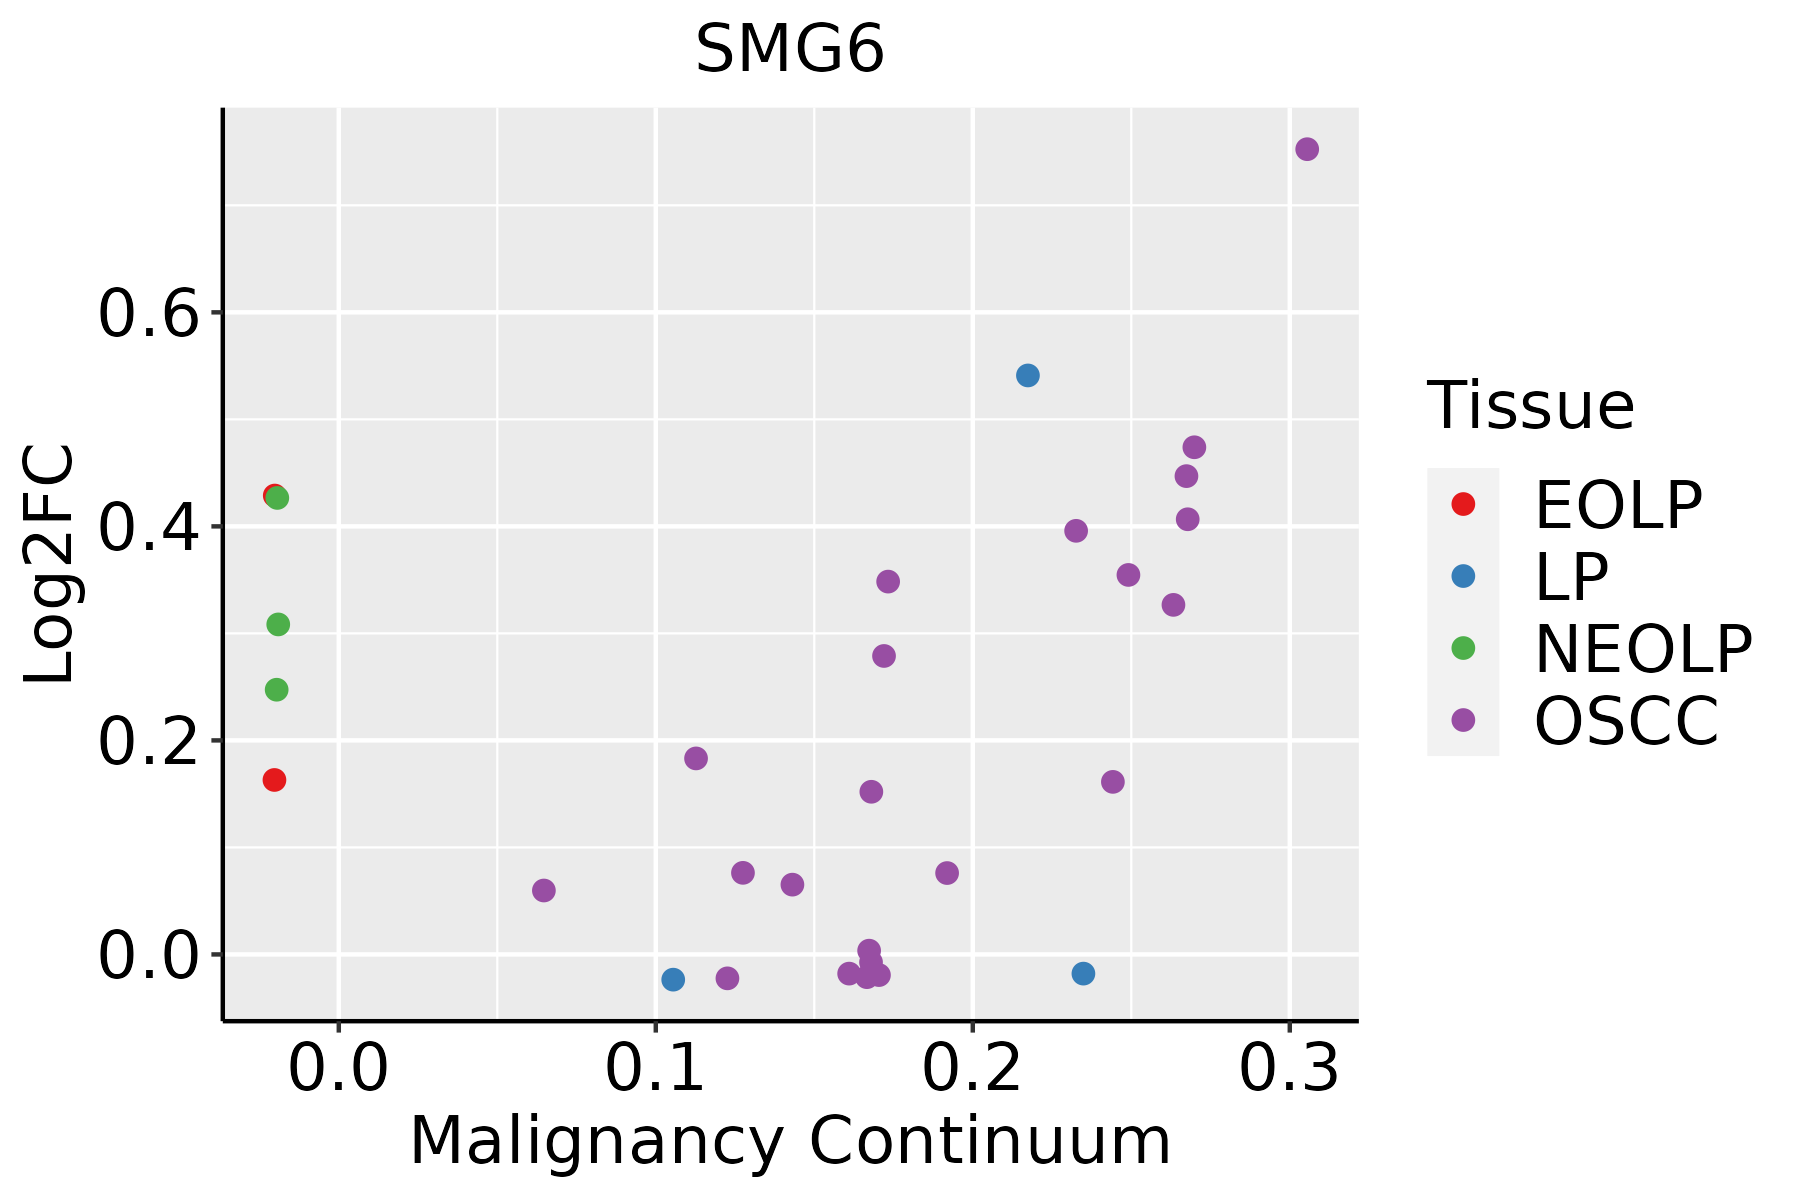 | EOLP: Erosive Oral lichen planus |
| LP: leukoplakia |
| NEOLP: Non-erosive oral lichen planus |
| OSCC: Oral squamous cell carcinoma |
| Thyroid | 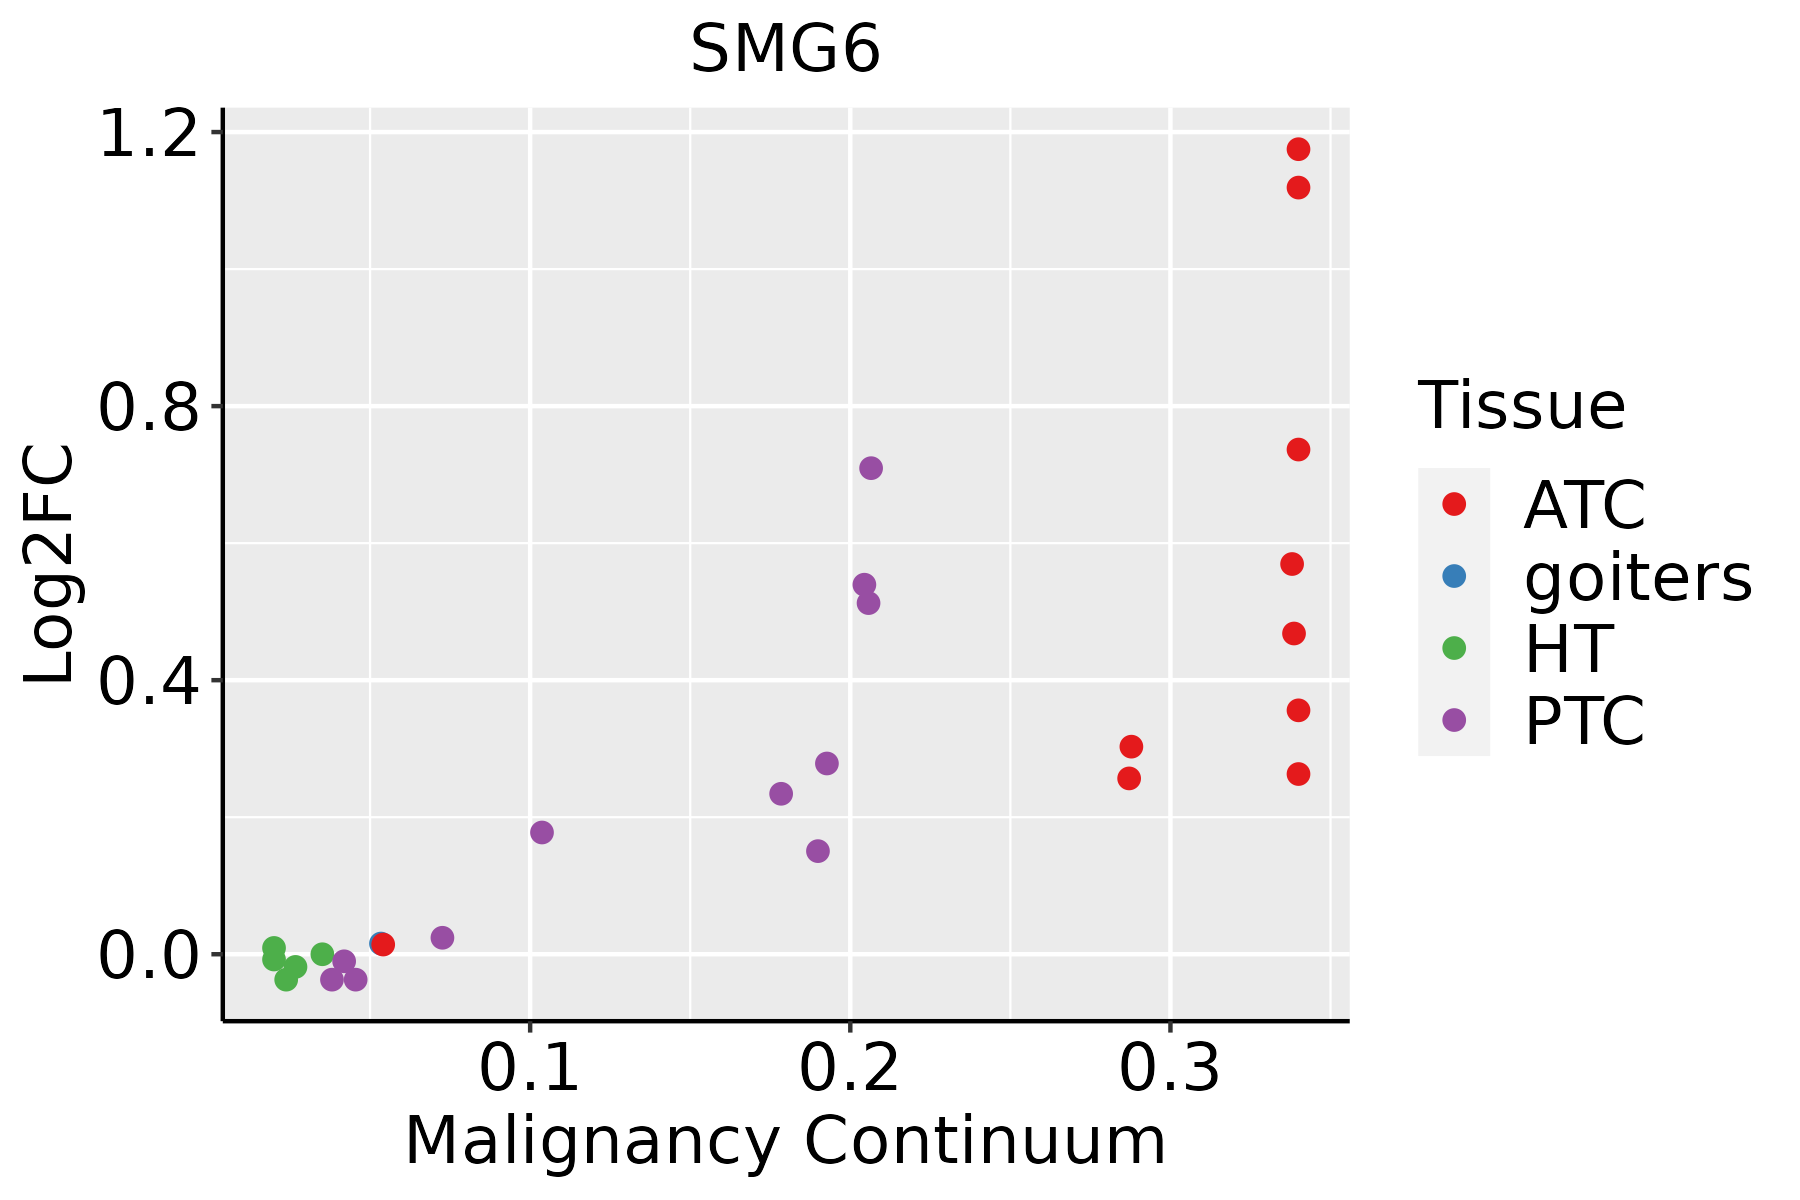 | ATC: Anaplastic thyroid cancer |
| HT: Hashimoto's thyroiditis |
| PTC: Papillary thyroid cancer |
| GO ID | Tissue | Disease Stage | Description | Gene Ratio | Bg Ratio | pvalue | p.adjust | Count |
| GO:0015931 | Colorectum | AD | nucleobase-containing compound transport | 73/3918 | 222/18723 | 2.02e-05 | 4.10e-04 | 73 |
| GO:2000278 | Colorectum | AD | regulation of DNA biosynthetic process | 41/3918 | 106/18723 | 2.17e-05 | 4.33e-04 | 41 |
| GO:0050657 | Colorectum | AD | nucleic acid transport | 57/3918 | 163/18723 | 2.22e-05 | 4.39e-04 | 57 |
| GO:0050658 | Colorectum | AD | RNA transport | 57/3918 | 163/18723 | 2.22e-05 | 4.39e-04 | 57 |
| GO:0035303 | Colorectum | AD | regulation of dephosphorylation | 46/3918 | 128/18723 | 6.20e-05 | 1.04e-03 | 46 |
| GO:0051972 | Colorectum | AD | regulation of telomerase activity | 22/3918 | 47/18723 | 6.45e-05 | 1.07e-03 | 22 |
| GO:0051168 | Colorectum | AD | nuclear export | 53/3918 | 154/18723 | 6.89e-05 | 1.11e-03 | 53 |
| GO:0032204 | Colorectum | AD | regulation of telomere maintenance | 31/3918 | 80/18723 | 2.01e-04 | 2.67e-03 | 31 |
| GO:0000956 | Colorectum | AD | nuclear-transcribed mRNA catabolic process | 40/3918 | 112/18723 | 2.11e-04 | 2.79e-03 | 40 |
| GO:0033044 | Colorectum | AD | regulation of chromosome organization | 60/3918 | 187/18723 | 2.25e-04 | 2.94e-03 | 60 |
| GO:0000723 | Colorectum | AD | telomere maintenance | 43/3918 | 131/18723 | 9.77e-04 | 9.20e-03 | 43 |
| GO:0010833 | Colorectum | AD | telomere maintenance via telomere lengthening | 29/3918 | 81/18723 | 1.42e-03 | 1.22e-02 | 29 |
| GO:0071897 | Colorectum | AD | DNA biosynthetic process | 55/3918 | 180/18723 | 1.46e-03 | 1.24e-02 | 55 |
| GO:0051028 | Colorectum | AD | mRNA transport | 42/3918 | 130/18723 | 1.57e-03 | 1.32e-02 | 42 |
| GO:1904356 | Colorectum | AD | regulation of telomere maintenance via telomere lengthening | 23/3918 | 61/18723 | 1.96e-03 | 1.58e-02 | 23 |
| GO:0007004 | Colorectum | AD | telomere maintenance via telomerase | 25/3918 | 69/18723 | 2.43e-03 | 1.88e-02 | 25 |
| GO:0006278 | Colorectum | AD | RNA-dependent DNA biosynthetic process | 25/3918 | 75/18723 | 8.36e-03 | 4.89e-02 | 25 |
| GO:00064012 | Colorectum | MSS | RNA catabolic process | 102/3467 | 278/18723 | 5.07e-13 | 1.02e-10 | 102 |
| GO:00064022 | Colorectum | MSS | mRNA catabolic process | 89/3467 | 232/18723 | 8.70e-13 | 1.60e-10 | 89 |
| GO:00442702 | Colorectum | MSS | cellular nitrogen compound catabolic process | 141/3467 | 451/18723 | 2.95e-11 | 3.83e-09 | 141 |
| Pathway ID | Tissue | Disease Stage | Description | Gene Ratio | Bg Ratio | pvalue | p.adjust | qvalue | Count |
| hsa03015 | Colorectum | AD | mRNA surveillance pathway | 35/2092 | 97/8465 | 7.95e-03 | 3.13e-02 | 2.00e-02 | 35 |
| hsa030151 | Colorectum | AD | mRNA surveillance pathway | 35/2092 | 97/8465 | 7.95e-03 | 3.13e-02 | 2.00e-02 | 35 |
| hsa030152 | Colorectum | FAP | mRNA surveillance pathway | 26/1404 | 97/8465 | 7.11e-03 | 2.64e-02 | 1.60e-02 | 26 |
| hsa030153 | Colorectum | FAP | mRNA surveillance pathway | 26/1404 | 97/8465 | 7.11e-03 | 2.64e-02 | 1.60e-02 | 26 |
| hsa0301524 | Esophagus | ESCC | mRNA surveillance pathway | 72/4205 | 97/8465 | 6.12e-07 | 4.10e-06 | 2.10e-06 | 72 |
| hsa0301534 | Esophagus | ESCC | mRNA surveillance pathway | 72/4205 | 97/8465 | 6.12e-07 | 4.10e-06 | 2.10e-06 | 72 |
| hsa030158 | Oral cavity | OSCC | mRNA surveillance pathway | 75/3704 | 97/8465 | 1.30e-11 | 2.01e-10 | 1.02e-10 | 75 |
| hsa0301513 | Oral cavity | OSCC | mRNA surveillance pathway | 75/3704 | 97/8465 | 1.30e-11 | 2.01e-10 | 1.02e-10 | 75 |
| hsa0301523 | Oral cavity | LP | mRNA surveillance pathway | 50/2418 | 97/8465 | 1.39e-06 | 1.50e-05 | 9.66e-06 | 50 |
| hsa0301533 | Oral cavity | LP | mRNA surveillance pathway | 50/2418 | 97/8465 | 1.39e-06 | 1.50e-05 | 9.66e-06 | 50 |
| hsa0301541 | Oral cavity | EOLP | mRNA surveillance pathway | 30/1218 | 97/8465 | 2.26e-05 | 1.20e-04 | 7.07e-05 | 30 |
| hsa0301551 | Oral cavity | EOLP | mRNA surveillance pathway | 30/1218 | 97/8465 | 2.26e-05 | 1.20e-04 | 7.07e-05 | 30 |
| hsa030156 | Oral cavity | NEOLP | mRNA surveillance pathway | 25/1112 | 97/8465 | 5.70e-04 | 3.18e-03 | 2.00e-03 | 25 |
| hsa030157 | Oral cavity | NEOLP | mRNA surveillance pathway | 25/1112 | 97/8465 | 5.70e-04 | 3.18e-03 | 2.00e-03 | 25 |
| Hugo Symbol | Variant Class | Variant Classification | dbSNP RS | HGVSc | HGVSp | HGVSp Short | SWISSPROT | BIOTYPE | SIFT | PolyPhen | Tumor Sample Barcode | Tissue | Histology | Sex | Age | Stage | Therapy Types | Drugs | Outcome |
| SMG6 | SNV | Missense_Mutation | | c.1631N>G | p.Tyr544Cys | p.Y544C | Q86US8 | protein_coding | tolerated(0.09) | possibly_damaging(0.894) | TCGA-A8-A08H-01 | Breast | breast invasive carcinoma | Female | >=65 | I/II | Unknown | Unknown | SD |
| SMG6 | SNV | Missense_Mutation | | c.3957N>C | p.Glu1319Asp | p.E1319D | Q86US8 | protein_coding | tolerated(0.07) | probably_damaging(0.985) | TCGA-AC-A23H-01 | Breast | breast invasive carcinoma | Female | >=65 | I/II | Unknown | Unknown | PD |
| SMG6 | SNV | Missense_Mutation | novel | c.812N>T | p.Ala271Val | p.A271V | Q86US8 | protein_coding | tolerated_low_confidence(1) | benign(0.014) | TCGA-BH-A0HF-01 | Breast | breast invasive carcinoma | Female | >=65 | I/II | Hormone Therapy | arimidex | SD |
| SMG6 | SNV | Missense_Mutation | | c.93N>A | p.Asn31Lys | p.N31K | Q86US8 | protein_coding | tolerated_low_confidence(0.05) | benign(0.115) | TCGA-C8-A1HM-01 | Breast | breast invasive carcinoma | Female | >=65 | I/II | Chemotherapy | doxorubicin | CR |
| SMG6 | SNV | Missense_Mutation | novel | c.3606N>G | p.Ile1202Met | p.I1202M | Q86US8 | protein_coding | deleterious(0) | probably_damaging(0.942) | TCGA-OL-A5RW-01 | Breast | breast invasive carcinoma | Female | <65 | I/II | Chemotherapy | adriamycin | CR |
| SMG6 | SNV | Missense_Mutation | novel | c.1133C>T | p.Pro378Leu | p.P378L | Q86US8 | protein_coding | tolerated_low_confidence(0.25) | benign(0) | TCGA-OL-A5RZ-01 | Breast | breast invasive carcinoma | Female | <65 | I/II | Chemotherapy | doxorubicin | CR |
| SMG6 | SNV | Missense_Mutation | novel | c.1132C>A | p.Pro378Thr | p.P378T | Q86US8 | protein_coding | tolerated_low_confidence(0.24) | benign(0) | TCGA-OL-A5RZ-01 | Breast | breast invasive carcinoma | Female | <65 | I/II | Chemotherapy | doxorubicin | CR |
| SMG6 | SNV | Missense_Mutation | novel | c.995C>T | p.Ser332Phe | p.S332F | Q86US8 | protein_coding | deleterious_low_confidence(0.02) | benign(0.135) | TCGA-OL-A5RZ-01 | Breast | breast invasive carcinoma | Female | <65 | I/II | Chemotherapy | doxorubicin | CR |
| SMG6 | insertion | Nonsense_Mutation | novel | c.1062_1063insTTATAGTAA | p.Phe354_Asp355insLeuTerTer | p.F354_D355insL** | Q86US8 | protein_coding | | | TCGA-A8-A096-01 | Breast | breast invasive carcinoma | Female | >=65 | I/II | Unknown | Unknown | SD |
| SMG6 | insertion | Frame_Shift_Ins | novel | c.1061_1062insGAAA | p.Phe354LeufsTer20 | p.F354Lfs*20 | Q86US8 | protein_coding | | | TCGA-A8-A096-01 | Breast | breast invasive carcinoma | Female | >=65 | I/II | Unknown | Unknown | SD |


