| GO ID | Tissue | Disease Stage | Description | Gene Ratio | Bg Ratio | pvalue | p.adjust | Count |
| GO:0015701 | Colorectum | CRC | bicarbonate transport | 9/2078 | 29/18723 | 3.18e-03 | 2.78e-02 | 9 |
| GO:00300044 | Colorectum | CRC | cellular monovalent inorganic cation homeostasis | 21/2078 | 103/18723 | 4.15e-03 | 3.40e-02 | 21 |
| GO:00352642 | Colorectum | CRC | multicellular organism growth | 25/2078 | 132/18723 | 5.21e-03 | 3.97e-02 | 25 |
| GO:0021953 | Colorectum | CRC | central nervous system neuron differentiation | 29/2078 | 162/18723 | 6.36e-03 | 4.62e-02 | 29 |
| GO:00306414 | Colorectum | CRC | regulation of cellular pH | 17/2078 | 81/18723 | 6.93e-03 | 4.85e-02 | 17 |
| GO:0006979111 | Esophagus | ESCC | response to oxidative stress | 303/8552 | 446/18723 | 7.15e-22 | 1.30e-19 | 303 |
| GO:0062197111 | Esophagus | ESCC | cellular response to chemical stress | 234/8552 | 337/18723 | 5.37e-19 | 5.97e-17 | 234 |
| GO:0034599111 | Esophagus | ESCC | cellular response to oxidative stress | 197/8552 | 288/18723 | 3.76e-15 | 2.15e-13 | 197 |
| GO:007121419 | Esophagus | ESCC | cellular response to abiotic stimulus | 206/8552 | 331/18723 | 7.52e-10 | 1.88e-08 | 206 |
| GO:010400419 | Esophagus | ESCC | cellular response to environmental stimulus | 206/8552 | 331/18723 | 7.52e-10 | 1.88e-08 | 206 |
| GO:00069707 | Esophagus | ESCC | response to osmotic stress | 57/8552 | 84/18723 | 3.26e-05 | 2.70e-04 | 57 |
| GO:005188110 | Esophagus | ESCC | regulation of mitochondrial membrane potential | 51/8552 | 74/18723 | 4.42e-05 | 3.51e-04 | 51 |
| GO:00488638 | Esophagus | ESCC | stem cell differentiation | 122/8552 | 206/18723 | 5.95e-05 | 4.59e-04 | 122 |
| GO:00714707 | Esophagus | ESCC | cellular response to osmotic stress | 31/8552 | 41/18723 | 9.32e-05 | 6.68e-04 | 31 |
| GO:200073614 | Esophagus | ESCC | regulation of stem cell differentiation | 39/8552 | 58/18723 | 7.43e-04 | 3.86e-03 | 39 |
| GO:0006971 | Esophagus | ESCC | hypotonic response | 10/8552 | 11/18723 | 2.54e-03 | 1.08e-02 | 10 |
| GO:190260018 | Esophagus | ESCC | proton transmembrane transport | 88/8552 | 157/18723 | 5.62e-03 | 2.10e-02 | 88 |
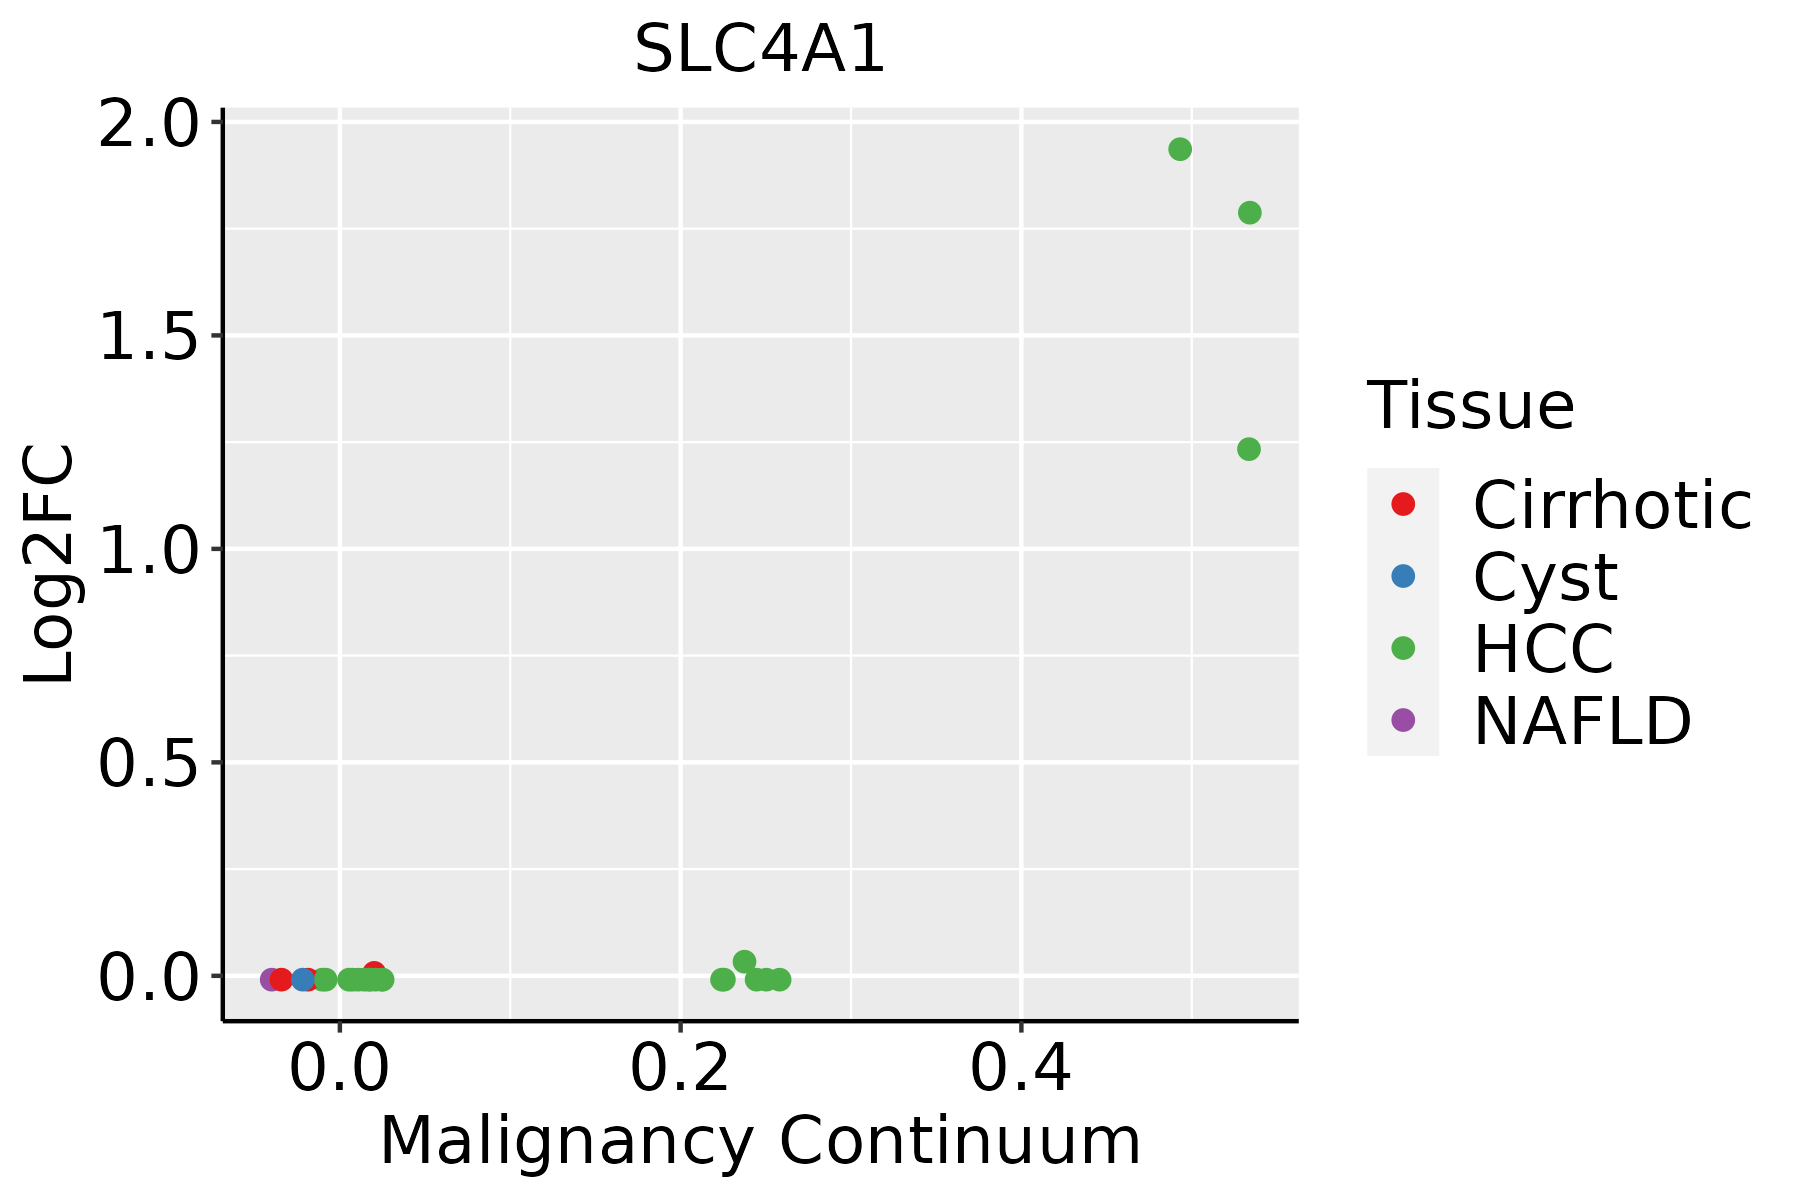
| GO:000609122 | Liver | HCC | generation of precursor metabolites and energy | 340/7958 | 490/18723 | 4.04e-34 | 2.85e-31 | 340 |
| GO:004603422 | Liver | HCC | ATP metabolic process | 198/7958 | 277/18723 | 8.30e-23 | 1.55e-20 | 198 |
| GO:000911722 | Liver | HCC | nucleotide metabolic process | 300/7958 | 489/18723 | 1.61e-17 | 1.71e-15 | 300 |
| Hugo Symbol | Variant Class | Variant Classification | dbSNP RS | HGVSc | HGVSp | HGVSp Short | SWISSPROT | BIOTYPE | SIFT | PolyPhen | Tumor Sample Barcode | Tissue | Histology | Sex | Age | Stage | Therapy Types | Drugs | Outcome |
| SLC4A1 | SNV | Missense_Mutation | rs28931585 | c.2608N>T | p.Arg870Trp | p.R870W | P02730 | protein_coding | deleterious(0) | probably_damaging(0.998) | TCGA-A2-A3KC-01 | Breast | breast invasive carcinoma | Female | <65 | I/II | Chemotherapy | adriamycin | SD |
| SLC4A1 | SNV | Missense_Mutation | | c.2722N>A | p.Ala908Thr | p.A908T | P02730 | protein_coding | tolerated(0.63) | benign(0) | TCGA-AN-A0AK-01 | Breast | breast invasive carcinoma | Female | >=65 | I/II | Unknown | Unknown | SD |
| SLC4A1 | SNV | Missense_Mutation | rs775748758 | c.2185G>A | p.Val729Met | p.V729M | P02730 | protein_coding | deleterious(0) | probably_damaging(1) | TCGA-C8-A12L-01 | Breast | breast invasive carcinoma | Female | >=65 | I/II | Unknown | Unknown | SD |
| SLC4A1 | SNV | Missense_Mutation | | c.2147N>A | p.Ala716Asp | p.A716D | P02730 | protein_coding | deleterious(0.01) | possibly_damaging(0.454) | TCGA-E2-A15R-01 | Breast | breast invasive carcinoma | Female | <65 | I/II | Chemotherapy | cyclophosphamide | SD |
| SLC4A1 | SNV | Missense_Mutation | | c.1232N>C | p.Phe411Ser | p.F411S | P02730 | protein_coding | deleterious(0.01) | probably_damaging(0.996) | TCGA-E2-A1L7-01 | Breast | breast invasive carcinoma | Female | <65 | III/IV | Chemotherapy | cyclophosphamide | PD |
| SLC4A1 | SNV | Missense_Mutation | | c.1778N>G | p.Asn593Ser | p.N593S | P02730 | protein_coding | deleterious(0.02) | possibly_damaging(0.733) | TCGA-GM-A2DK-01 | Breast | breast invasive carcinoma | Female | <65 | I/II | Hormone Therapy | arimidex | CR |
| SLC4A1 | insertion | Frame_Shift_Ins | novel | c.2536_2537insGGGGAAATGA | p.Val846GlyfsTer47 | p.V846Gfs*47 | P02730 | protein_coding | | | TCGA-AO-A0J5-01 | Breast | breast invasive carcinoma | Female | <65 | III/IV | Other, specify in notesBisphosphonate | zoledronic | PD |
| SLC4A1 | insertion | Frame_Shift_Ins | novel | c.2534_2535insTGTGTCTTCATTTTGCTCACCTGTAA | p.Leu847SerfsTer13 | p.L847Sfs*13 | P02730 | protein_coding | | | TCGA-AO-A0J5-01 | Breast | breast invasive carcinoma | Female | <65 | III/IV | Other, specify in notesBisphosphonate | zoledronic | PD |
| SLC4A1 | SNV | Missense_Mutation | novel | c.1735N>A | p.Ala579Thr | p.A579T | P02730 | protein_coding | tolerated(0.09) | benign(0.103) | TCGA-2W-A8YY-01 | Cervix | cervical & endocervical cancer | Female | <65 | I/II | Chemotherapy | cisplatin | CR |
| SLC4A1 | SNV | Missense_Mutation | novel | c.856N>T | p.Ala286Ser | p.A286S | P02730 | protein_coding | tolerated(1) | possibly_damaging(0.469) | TCGA-C5-A1ME-01 | Cervix | cervical & endocervical cancer | Female | <65 | I/II | Unknown | Unknown | SD |