
|
|||||
|
 | |
| |
| |
| |
| |
| |
|
Gene: SLC25A37 |
Gene summary for SLC25A37 |
| Gene information | Species | Human | Gene symbol | SLC25A37 | Gene ID | 51312 |
| Gene name | solute carrier family 25 member 37 | |
| Gene Alias | HT015 | |
| Cytomap | 8p21.2 | |
| Gene Type | protein-coding | GO ID | GO:0000041 | UniProtAcc | Q71JB2 |
Top |
Malignant transformation analysis |
| Identification of the aberrant gene expression in precancerous and cancerous lesions by comparing the gene expression of stem-like cells in diseased tissues with normal stem cells |
| Entrez ID | Symbol | Replicates | Species | Organ | Tissue | Adj P-value | Log2FC | Malignancy |
| 51312 | SLC25A37 | GSM4909282 | Human | Breast | IDC | 9.39e-21 | 5.77e-01 | -0.0288 |
| 51312 | SLC25A37 | GSM4909285 | Human | Breast | IDC | 1.02e-11 | 2.89e-01 | 0.21 |
| 51312 | SLC25A37 | GSM4909286 | Human | Breast | IDC | 3.56e-11 | -2.81e-01 | 0.1081 |
| 51312 | SLC25A37 | GSM4909290 | Human | Breast | IDC | 3.63e-07 | -4.77e-01 | 0.2096 |
| 51312 | SLC25A37 | GSM4909291 | Human | Breast | IDC | 1.80e-10 | -5.81e-01 | 0.1753 |
| 51312 | SLC25A37 | GSM4909293 | Human | Breast | IDC | 2.02e-05 | -4.61e-01 | 0.1581 |
| 51312 | SLC25A37 | GSM4909294 | Human | Breast | IDC | 4.97e-18 | -6.06e-01 | 0.2022 |
| 51312 | SLC25A37 | GSM4909296 | Human | Breast | IDC | 2.44e-18 | -5.94e-01 | 0.1524 |
| 51312 | SLC25A37 | GSM4909297 | Human | Breast | IDC | 5.49e-27 | -6.13e-01 | 0.1517 |
| 51312 | SLC25A37 | GSM4909298 | Human | Breast | IDC | 4.56e-05 | -3.27e-01 | 0.1551 |
| 51312 | SLC25A37 | GSM4909301 | Human | Breast | IDC | 2.64e-09 | -5.36e-01 | 0.1577 |
| 51312 | SLC25A37 | GSM4909303 | Human | Breast | IDC | 4.00e-05 | -5.99e-01 | 0.0438 |
| 51312 | SLC25A37 | GSM4909304 | Human | Breast | IDC | 5.15e-13 | -5.34e-01 | 0.1636 |
| 51312 | SLC25A37 | GSM4909306 | Human | Breast | IDC | 4.78e-09 | -5.07e-01 | 0.1564 |
| 51312 | SLC25A37 | GSM4909308 | Human | Breast | IDC | 1.47e-11 | -4.76e-01 | 0.158 |
| 51312 | SLC25A37 | GSM4909311 | Human | Breast | IDC | 2.24e-21 | -5.41e-01 | 0.1534 |
| 51312 | SLC25A37 | GSM4909312 | Human | Breast | IDC | 7.54e-25 | -6.40e-01 | 0.1552 |
| 51312 | SLC25A37 | GSM4909315 | Human | Breast | IDC | 1.74e-12 | -5.34e-01 | 0.21 |
| 51312 | SLC25A37 | GSM4909316 | Human | Breast | IDC | 1.03e-07 | -6.61e-01 | 0.21 |
| 51312 | SLC25A37 | GSM4909318 | Human | Breast | IDC | 7.63e-04 | -6.72e-01 | 0.2031 |
| Page: 1 2 3 4 5 6 7 8 9 10 11 |
| Tissue | Expression Dynamics | Abbreviation |
| Breast |  | IDC: Invasive ductal carcinoma |
| DCIS: Ductal carcinoma in situ | ||
| Precancer(BRCA1-mut): Precancerous lesion from BRCA1 mutation carriers | ||
| Endometrium | 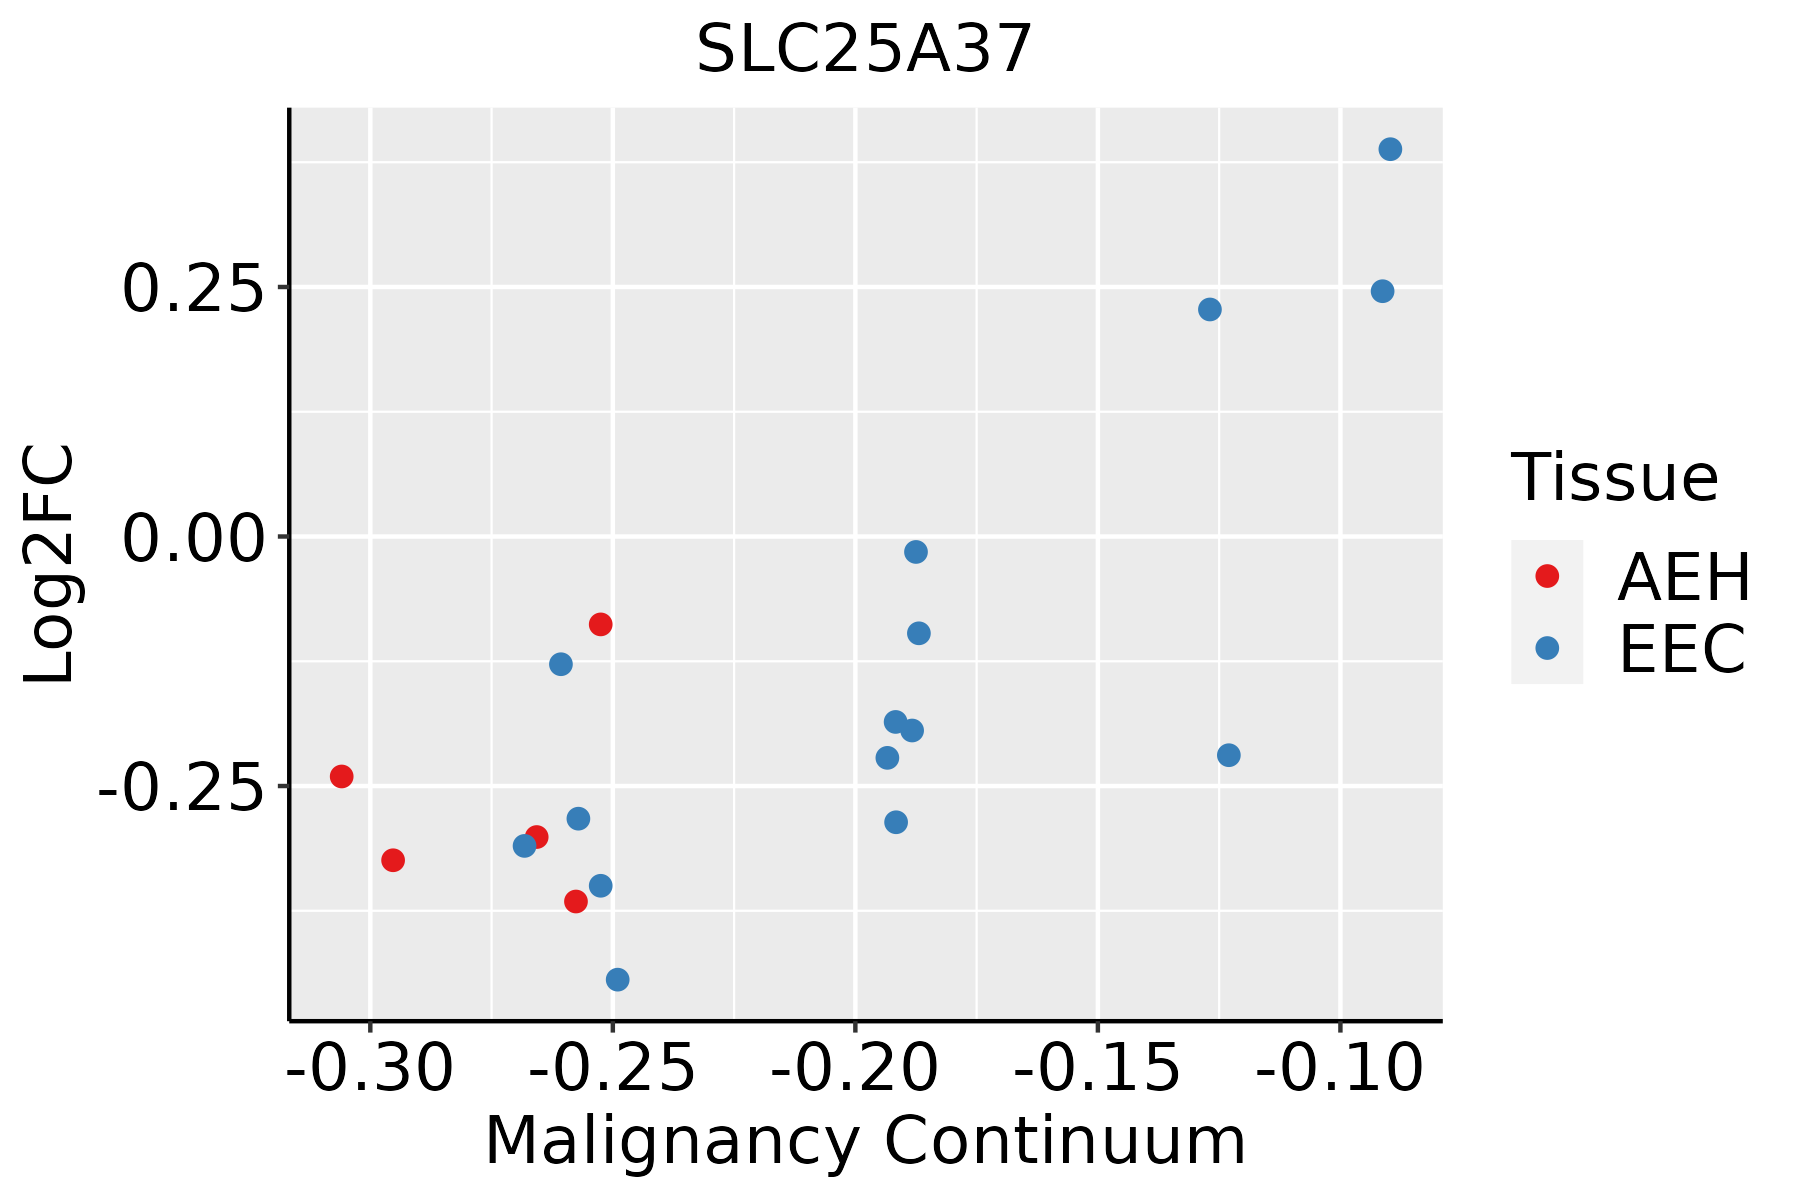 | AEH: Atypical endometrial hyperplasia |
| EEC: Endometrioid Cancer | ||
| Esophagus | 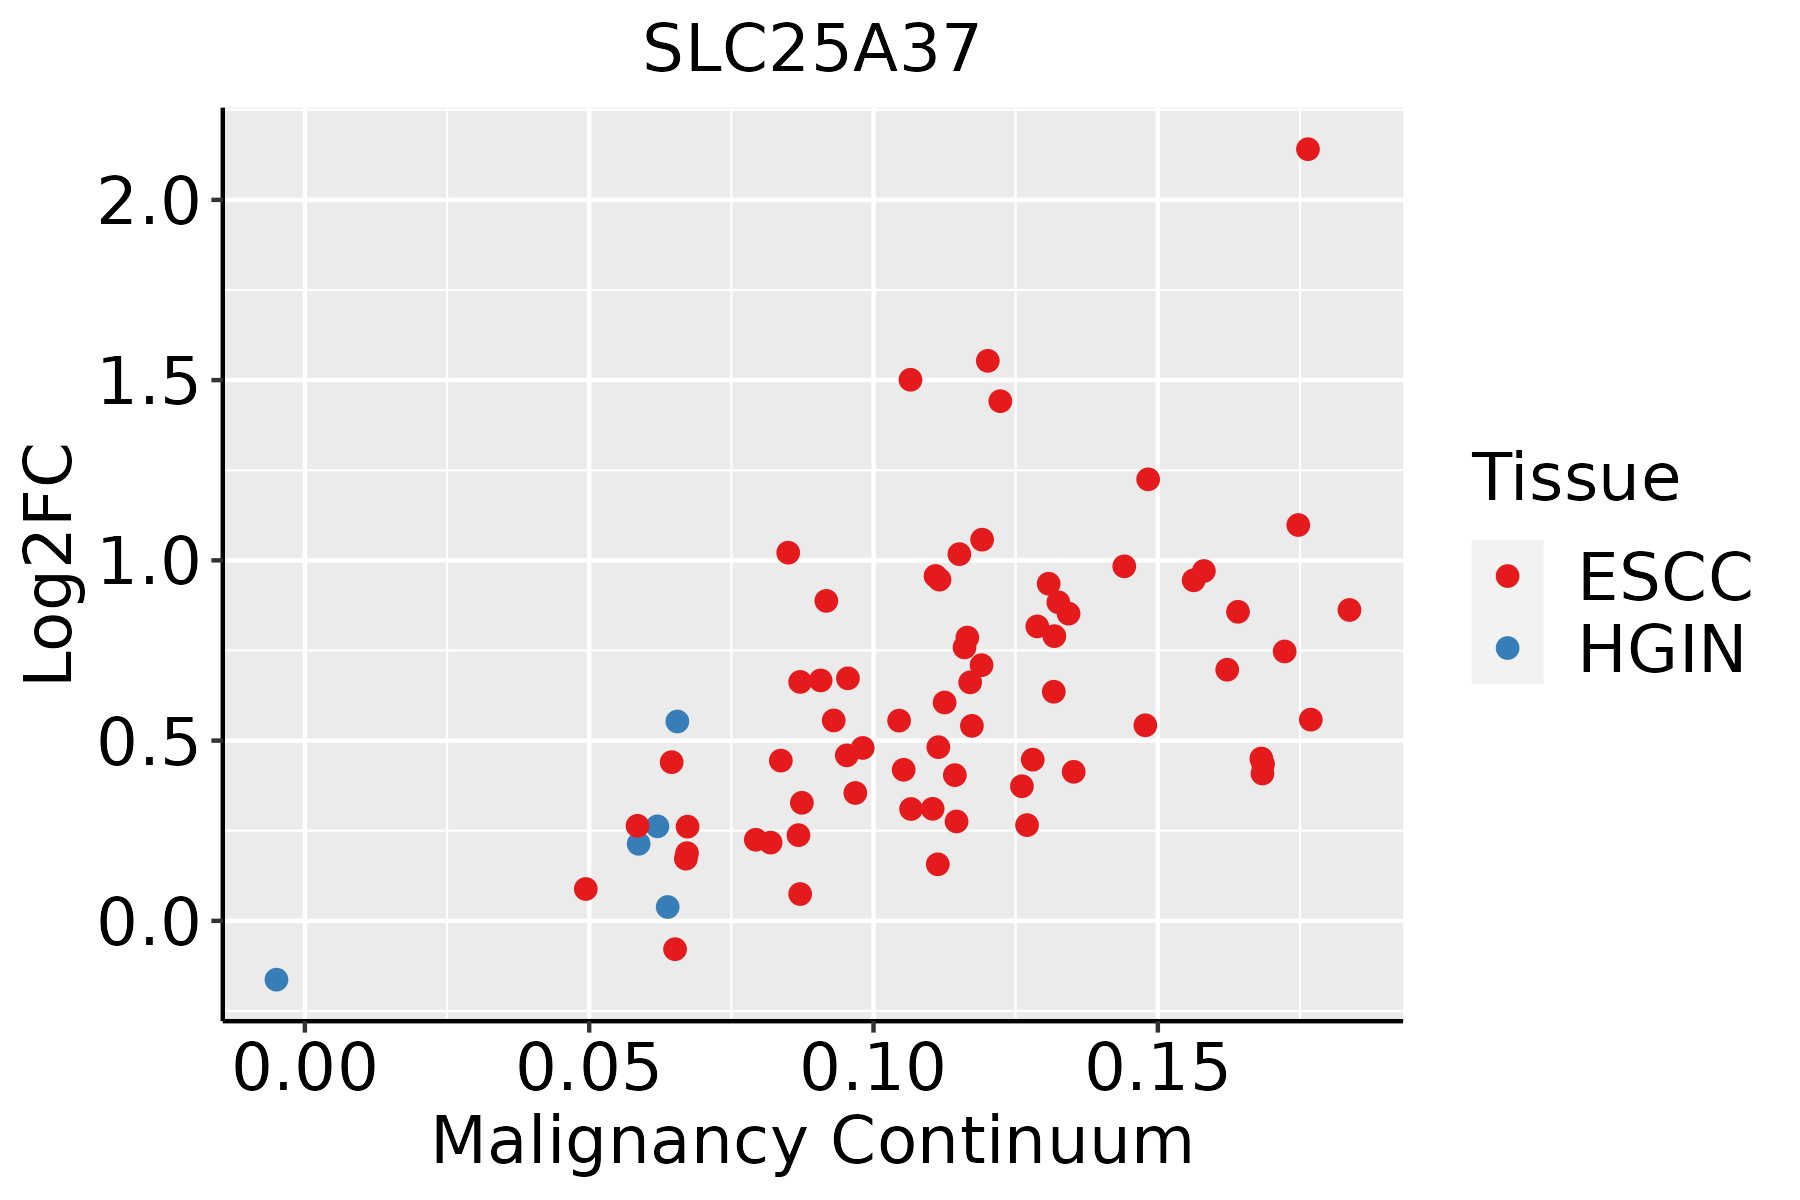 | ESCC: Esophageal squamous cell carcinoma |
| HGIN: High-grade intraepithelial neoplasias | ||
| LGIN: Low-grade intraepithelial neoplasias | ||
| GC | 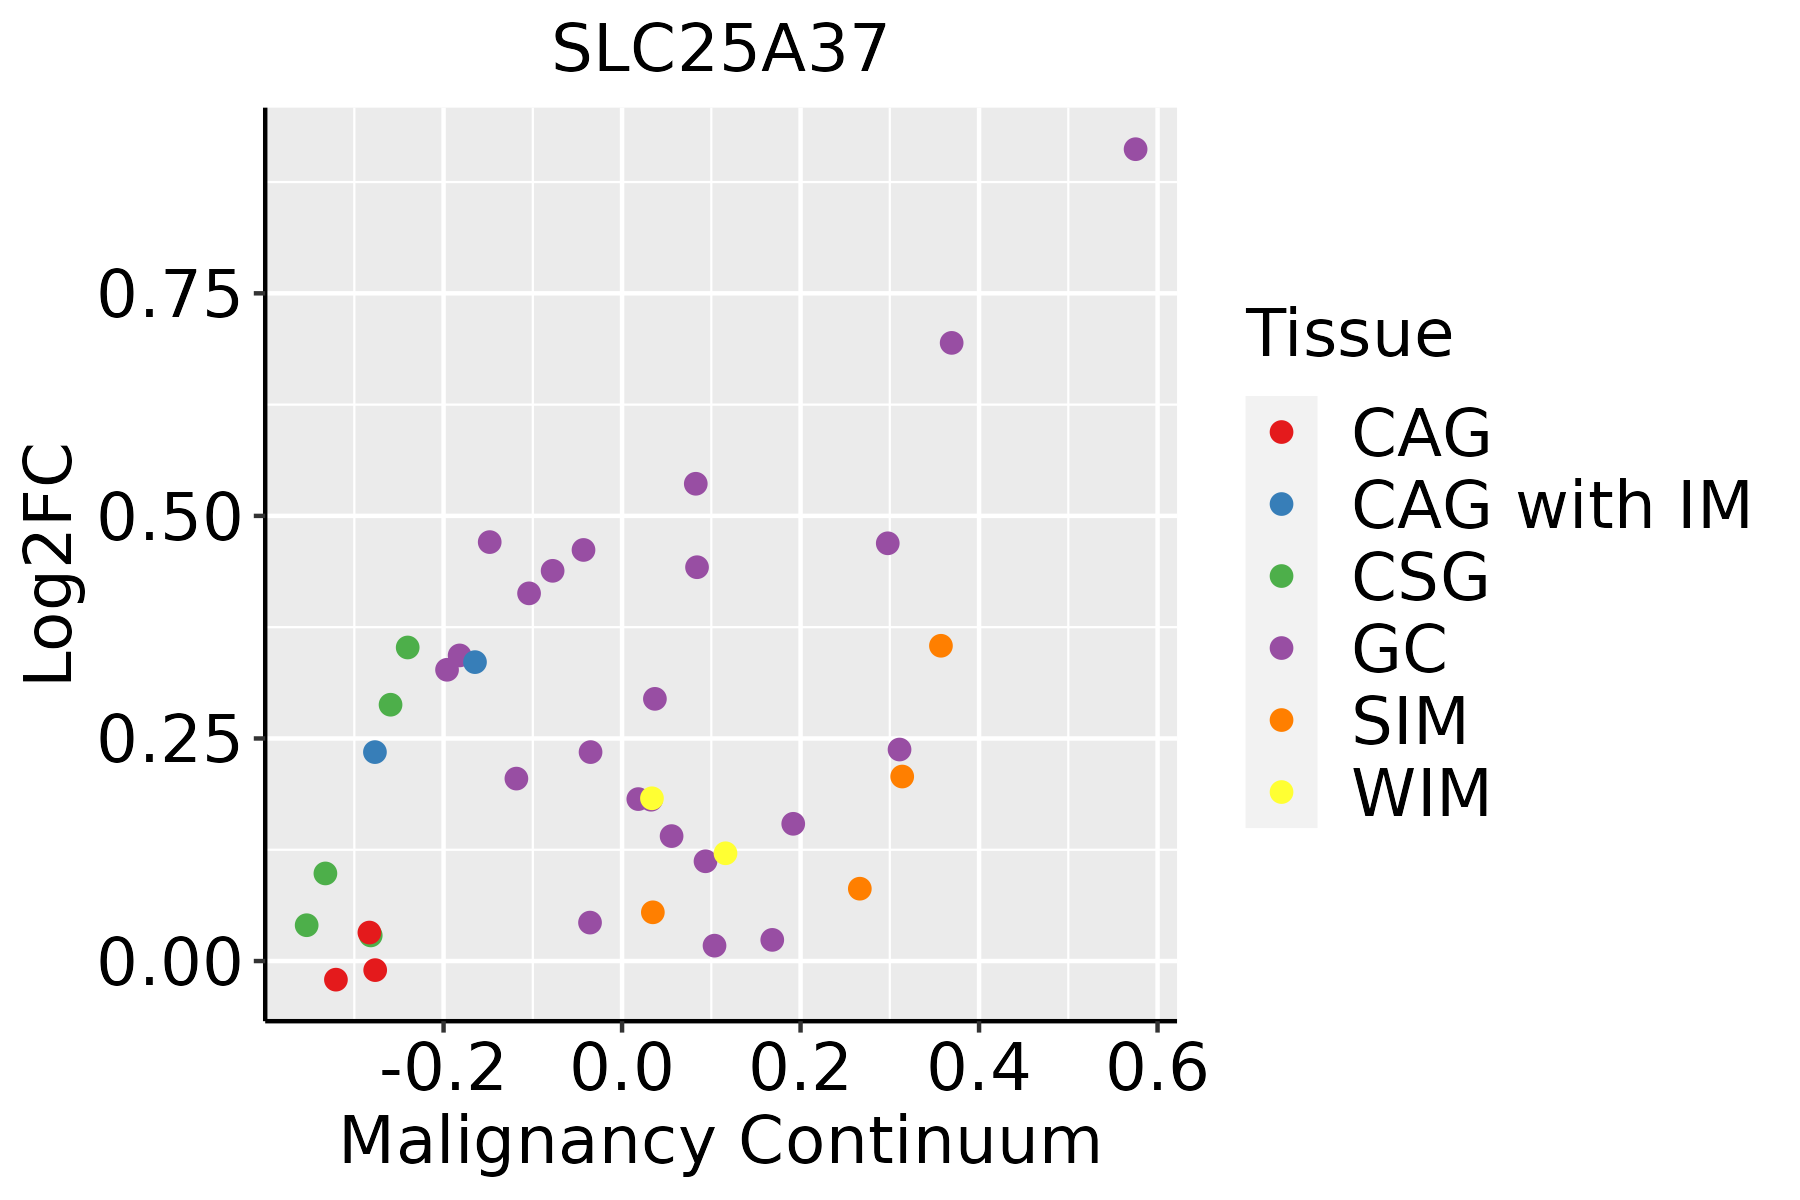 | CAG: Chronic atrophic gastritis |
| CAG with IM: Chronic atrophic gastritis with intestinal metaplasia | ||
| CSG: Chronic superficial gastritis | ||
| GC: Gastric cancer | ||
| SIM: Severe intestinal metaplasia | ||
| WIM: Wild intestinal metaplasia | ||
| Liver | 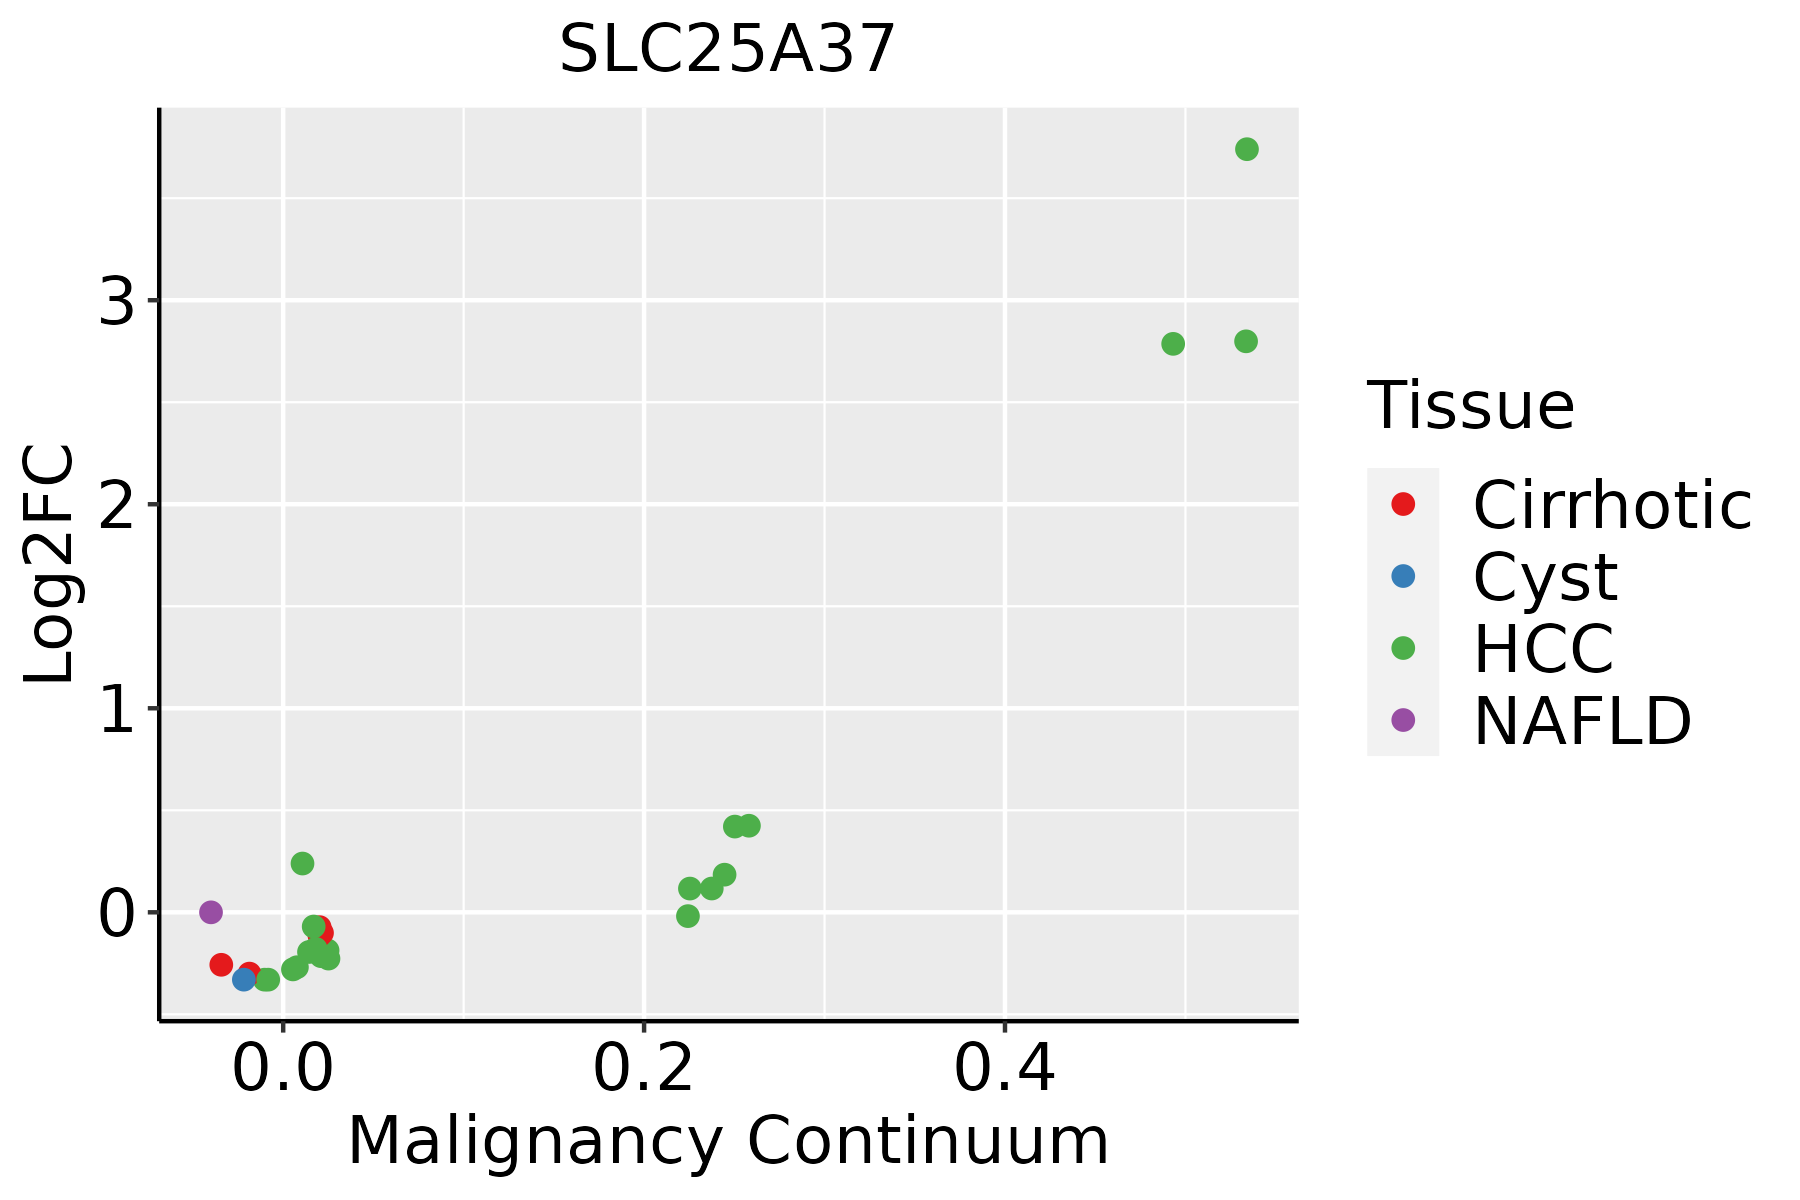 | HCC: Hepatocellular carcinoma |
| NAFLD: Non-alcoholic fatty liver disease | ||
| Lung |  | AAH: Atypical adenomatous hyperplasia |
| AIS: Adenocarcinoma in situ | ||
| IAC: Invasive lung adenocarcinoma | ||
| MIA: Minimally invasive adenocarcinoma | ||
| Oral Cavity | 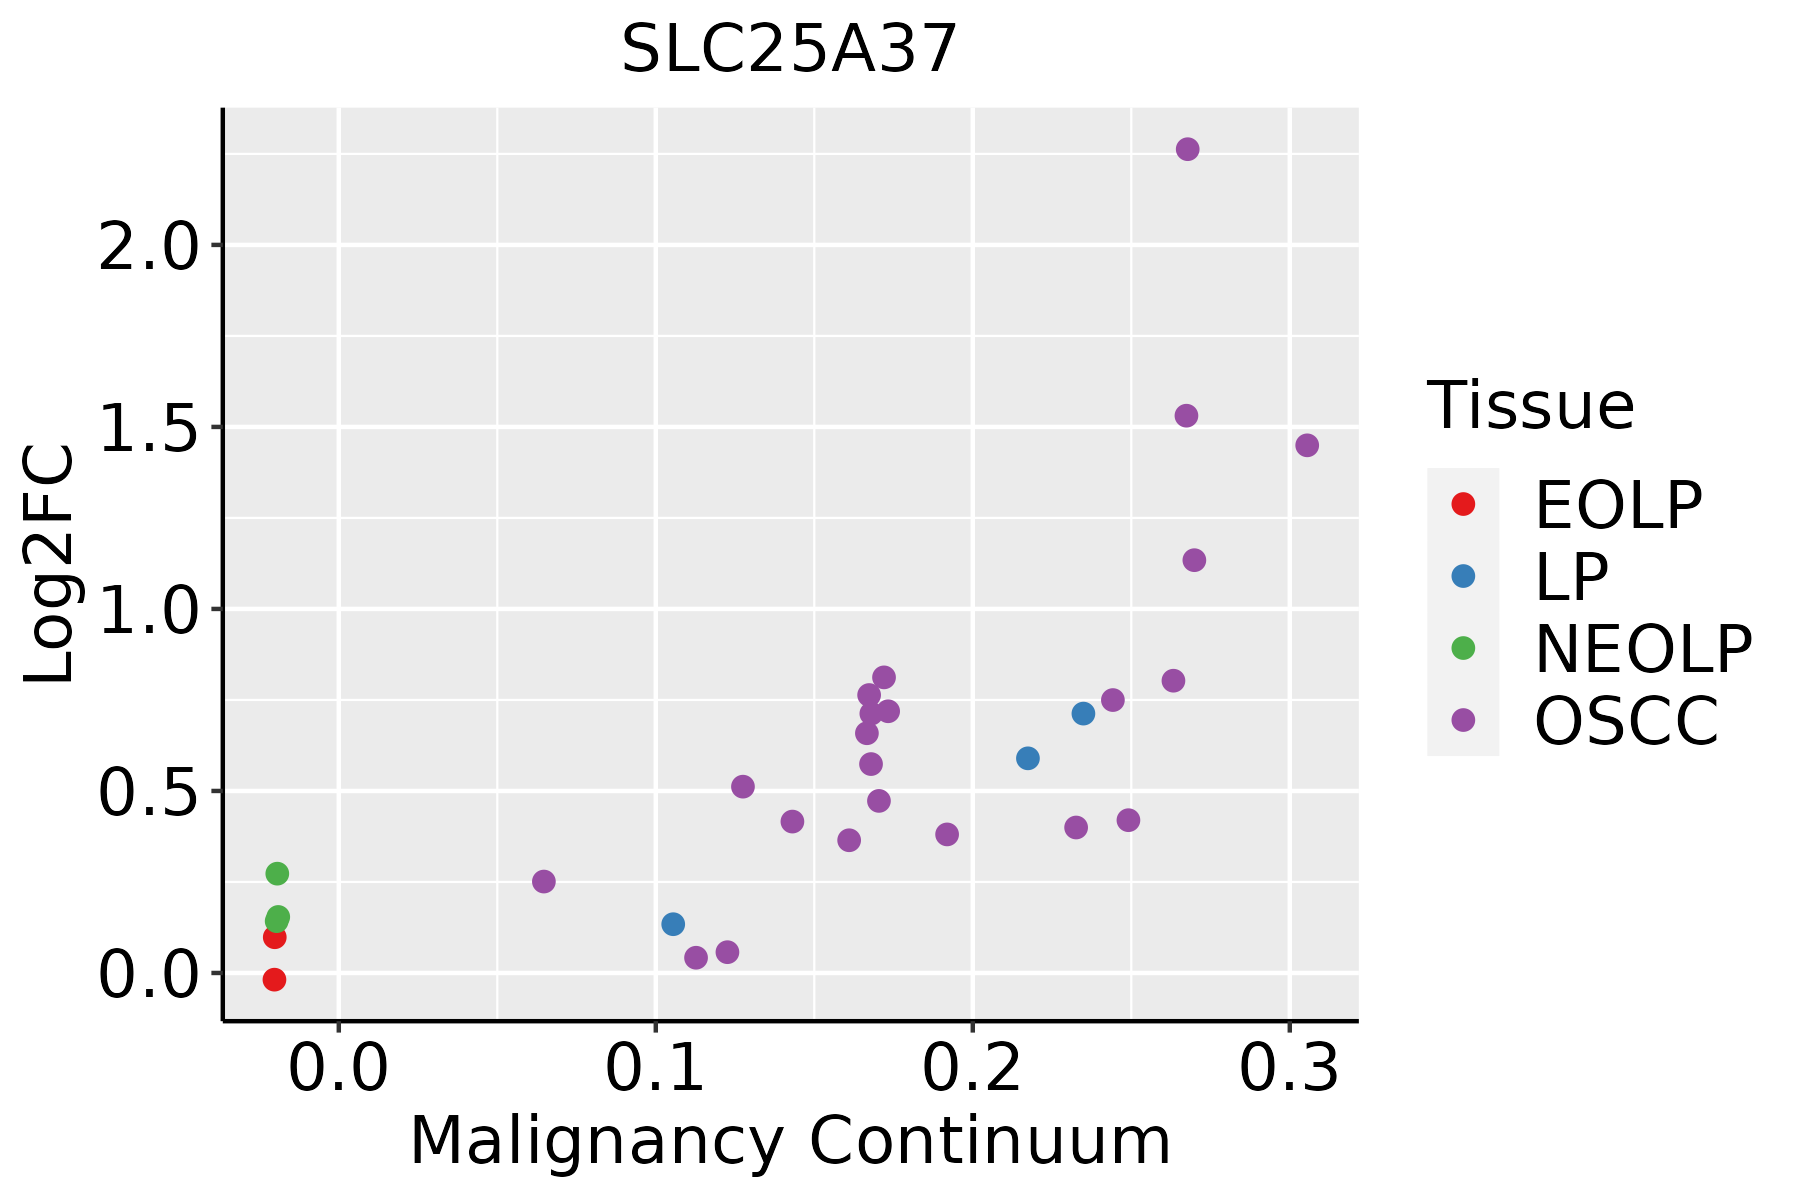 | EOLP: Erosive Oral lichen planus |
| LP: leukoplakia | ||
| NEOLP: Non-erosive oral lichen planus | ||
| OSCC: Oral squamous cell carcinoma | ||
| Prostate | 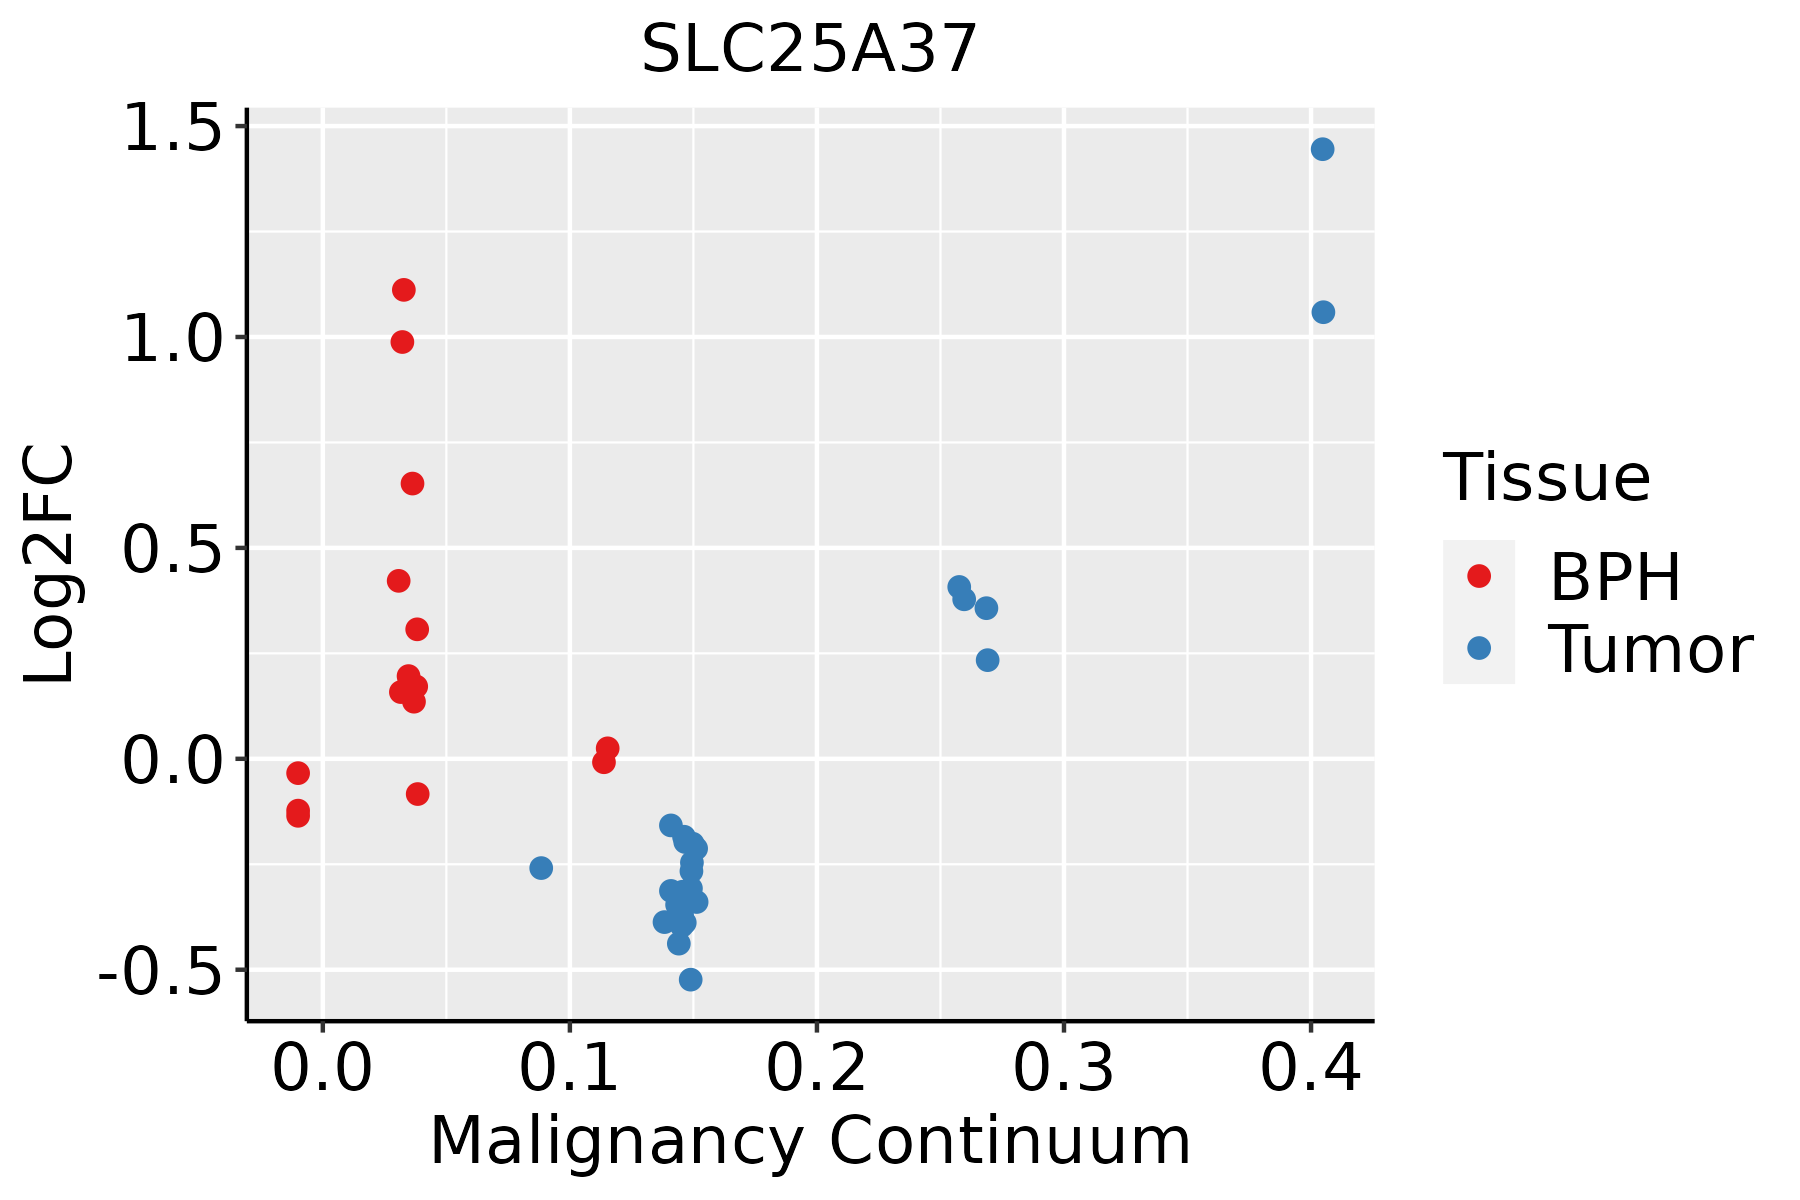 | BPH: Benign Prostatic Hyperplasia |
| Thyroid |  | ATC: Anaplastic thyroid cancer |
| HT: Hashimoto's thyroiditis | ||
| PTC: Papillary thyroid cancer |
| ∗log2FC in expression of this searched gene in stem-like cells from each diseased tissue sample relative to stem-like cells in normal samples in each tissue plotted against the malignancy continuum. Samples are colored based on if they are from different disease stage. |
Top |
Malignant transformation related pathway analysis |
| Find out the enriched GO biological processes and KEGG pathways involved in transition from healthy to precancer to cancer |
| Tissue | Disease Stage | Enriched GO biological Processes |
| Colorectum | AD |  |
| Colorectum | SER |  |
| Colorectum | MSS |  |
| Colorectum | MSI-H |  |
| Colorectum | FAP |  |
| ∗Top 15 enriched GO BP terms are showed in the bar plot of each disease state in each tissue. Each row represents a significant GO biological process which is colored according to the -log10(p.adjust). |
| Page: 1 2 3 4 5 6 7 8 9 |
| GO ID | Tissue | Disease Stage | Description | Gene Ratio | Bg Ratio | pvalue | p.adjust | Count |
| GO:199054218 | Oral cavity | OSCC | mitochondrial transmembrane transport | 56/7305 | 102/18723 | 8.06e-04 | 4.32e-03 | 56 |
| GO:00550728 | Oral cavity | OSCC | iron ion homeostasis | 46/7305 | 85/18723 | 3.31e-03 | 1.42e-02 | 46 |
| GO:000683919 | Oral cavity | LP | mitochondrial transport | 119/4623 | 254/18723 | 1.06e-14 | 1.33e-12 | 119 |
| GO:005507616 | Oral cavity | LP | transition metal ion homeostasis | 54/4623 | 138/18723 | 1.19e-04 | 1.40e-03 | 54 |
| GO:199054219 | Oral cavity | LP | mitochondrial transmembrane transport | 37/4623 | 102/18723 | 5.93e-03 | 3.53e-02 | 37 |
| GO:000683916 | Prostate | BPH | mitochondrial transport | 79/3107 | 254/18723 | 6.77e-09 | 2.38e-07 | 79 |
| GO:00550769 | Prostate | BPH | transition metal ion homeostasis | 43/3107 | 138/18723 | 1.66e-05 | 2.07e-04 | 43 |
| GO:199054210 | Prostate | BPH | mitochondrial transmembrane transport | 34/3107 | 102/18723 | 2.63e-05 | 3.10e-04 | 34 |
| GO:00550727 | Prostate | BPH | iron ion homeostasis | 29/3107 | 85/18723 | 6.22e-05 | 6.23e-04 | 29 |
| GO:000683917 | Prostate | Tumor | mitochondrial transport | 84/3246 | 254/18723 | 7.17e-10 | 3.57e-08 | 84 |
| GO:005507615 | Prostate | Tumor | transition metal ion homeostasis | 45/3246 | 138/18723 | 9.11e-06 | 1.33e-04 | 45 |
| GO:199054217 | Prostate | Tumor | mitochondrial transmembrane transport | 36/3246 | 102/18723 | 9.84e-06 | 1.43e-04 | 36 |
| GO:005507213 | Prostate | Tumor | iron ion homeostasis | 31/3246 | 85/18723 | 1.89e-05 | 2.47e-04 | 31 |
| GO:00068396 | Stomach | GC | mitochondrial transport | 42/1159 | 254/18723 | 4.95e-09 | 5.72e-07 | 42 |
| GO:19905424 | Stomach | GC | mitochondrial transmembrane transport | 20/1159 | 102/18723 | 3.71e-06 | 1.49e-04 | 20 |
| GO:00550765 | Stomach | GC | transition metal ion homeostasis | 19/1159 | 138/18723 | 8.62e-04 | 1.07e-02 | 19 |
| GO:0000041 | Stomach | GC | transition metal ion transport | 15/1159 | 105/18723 | 2.01e-03 | 2.03e-02 | 15 |
| GO:000683911 | Stomach | CAG with IM | mitochondrial transport | 42/1050 | 254/18723 | 2.58e-10 | 4.44e-08 | 42 |
| GO:199054211 | Stomach | CAG with IM | mitochondrial transmembrane transport | 20/1050 | 102/18723 | 8.13e-07 | 4.05e-05 | 20 |
| GO:005507611 | Stomach | CAG with IM | transition metal ion homeostasis | 16/1050 | 138/18723 | 4.60e-03 | 3.83e-02 | 16 |
| Page: 1 2 3 4 |
| Pathway ID | Tissue | Disease Stage | Description | Gene Ratio | Bg Ratio | pvalue | p.adjust | qvalue | Count |
| Page: 1 |
Top |
Cell-cell communication analysis |
| Identification of potential cell-cell interactions between two cell types and their ligand-receptor pairs for different disease states |
| Ligand | Receptor | LRpair | Pathway | Tissue | Disease Stage |
| Page: 1 |
Top |
Single-cell gene regulatory network inference analysis |
| Find out the significant the regulons (TFs) and the target genes of each regulon across cell types for different disease states |
| TF | Cell Type | Tissue | Disease Stage | Target Gene | RSS | Regulon Activity |
| ∗The dot plots of a searched regulon are shown for all cell subpopulations in each disease state of each tissue based on the regulon specific score inferred using pySCENIC and by calculating the average expression. |
| Page: 1 |
Top |
Somatic mutation of malignant transformation related genes |
| Annotation of somatic variants for genes involved in malignant transformation |
| Hugo Symbol | Variant Class | Variant Classification | dbSNP RS | HGVSc | HGVSp | HGVSp Short | SWISSPROT | BIOTYPE | SIFT | PolyPhen | Tumor Sample Barcode | Tissue | Histology | Sex | Age | Stage | Therapy Types | Drugs | Outcome |
| SLC25A37 | SNV | Missense_Mutation | novel | c.509G>A | p.Arg170His | p.R170H | Q9NYZ2 | protein_coding | deleterious(0) | probably_damaging(1) | TCGA-EA-A410-01 | Cervix | cervical & endocervical cancer | Female | <65 | I/II | Unknown | Unknown | SD |
| SLC25A37 | SNV | Missense_Mutation | rs746602617 | c.940N>A | p.Ala314Thr | p.A314T | Q9NYZ2 | protein_coding | deleterious(0.02) | probably_damaging(0.918) | TCGA-3L-AA1B-01 | Colorectum | colon adenocarcinoma | Female | <65 | I/II | Unknown | Unknown | SD |
| SLC25A37 | SNV | Missense_Mutation | c.769G>A | p.Val257Ile | p.V257I | Q9NYZ2 | protein_coding | deleterious(0) | probably_damaging(0.995) | TCGA-AA-3864-01 | Colorectum | colon adenocarcinoma | Male | >=65 | I/II | Unknown | Unknown | SD | |
| SLC25A37 | SNV | Missense_Mutation | c.346C>T | p.Pro116Ser | p.P116S | Q9NYZ2 | protein_coding | deleterious(0) | probably_damaging(1) | TCGA-AD-6895-01 | Colorectum | colon adenocarcinoma | Male | >=65 | III/IV | Unknown | Unknown | SD | |
| SLC25A37 | SNV | Missense_Mutation | c.535N>T | p.Arg179Trp | p.R179W | Q9NYZ2 | protein_coding | deleterious(0) | possibly_damaging(0.766) | TCGA-CM-6171-01 | Colorectum | colon adenocarcinoma | Female | >=65 | I/II | Unknown | Unknown | SD | |
| SLC25A37 | SNV | Missense_Mutation | c.403N>A | p.Val135Ile | p.V135I | Q9NYZ2 | protein_coding | tolerated(0.48) | benign(0.022) | TCGA-G4-6302-01 | Colorectum | colon adenocarcinoma | Female | >=65 | I/II | Unknown | Unknown | SD | |
| SLC25A37 | SNV | Missense_Mutation | rs371477159 | c.614N>C | p.Leu205Pro | p.L205P | Q9NYZ2 | protein_coding | deleterious(0) | probably_damaging(0.999) | TCGA-G4-6588-01 | Colorectum | colon adenocarcinoma | Female | <65 | I/II | Unknown | Unknown | SD |
| SLC25A37 | SNV | Missense_Mutation | novel | c.292G>A | p.Glu98Lys | p.E98K | Q9NYZ2 | protein_coding | deleterious(0) | probably_damaging(0.997) | TCGA-EI-6917-01 | Colorectum | rectum adenocarcinoma | Male | <65 | III/IV | Chemotherapy | 5fluorouracil+oxaciplatina+l-folinian | SD |
| SLC25A37 | SNV | Missense_Mutation | novel | c.391N>G | p.Thr131Ala | p.T131A | Q9NYZ2 | protein_coding | tolerated(0.48) | benign(0.038) | TCGA-F5-6814-01 | Colorectum | rectum adenocarcinoma | Male | <65 | I/II | Unknown | Unknown | SD |
| SLC25A37 | SNV | Missense_Mutation | c.781C>A | p.Leu261Ile | p.L261I | Q9NYZ2 | protein_coding | deleterious(0.04) | probably_damaging(0.968) | TCGA-A5-A0G2-01 | Endometrium | uterine corpus endometrioid carcinoma | Female | <65 | III/IV | Unknown | Unknown | SD |
| Page: 1 2 3 4 |
Top |
Related drugs of malignant transformation related genes |
| Identification of chemicals and drugs interact with genes involved in malignant transfromation |
| (DGIdb 4.0) |
| Entrez ID | Symbol | Category | Interaction Types | Drug Claim Name | Drug Name | PMIDs |
| Page: 1 |

Copyright 2023-Present -The University of Texas Health Science Center at Houston |