| Tissue | Expression Dynamics | Abbreviation |
| Breast | 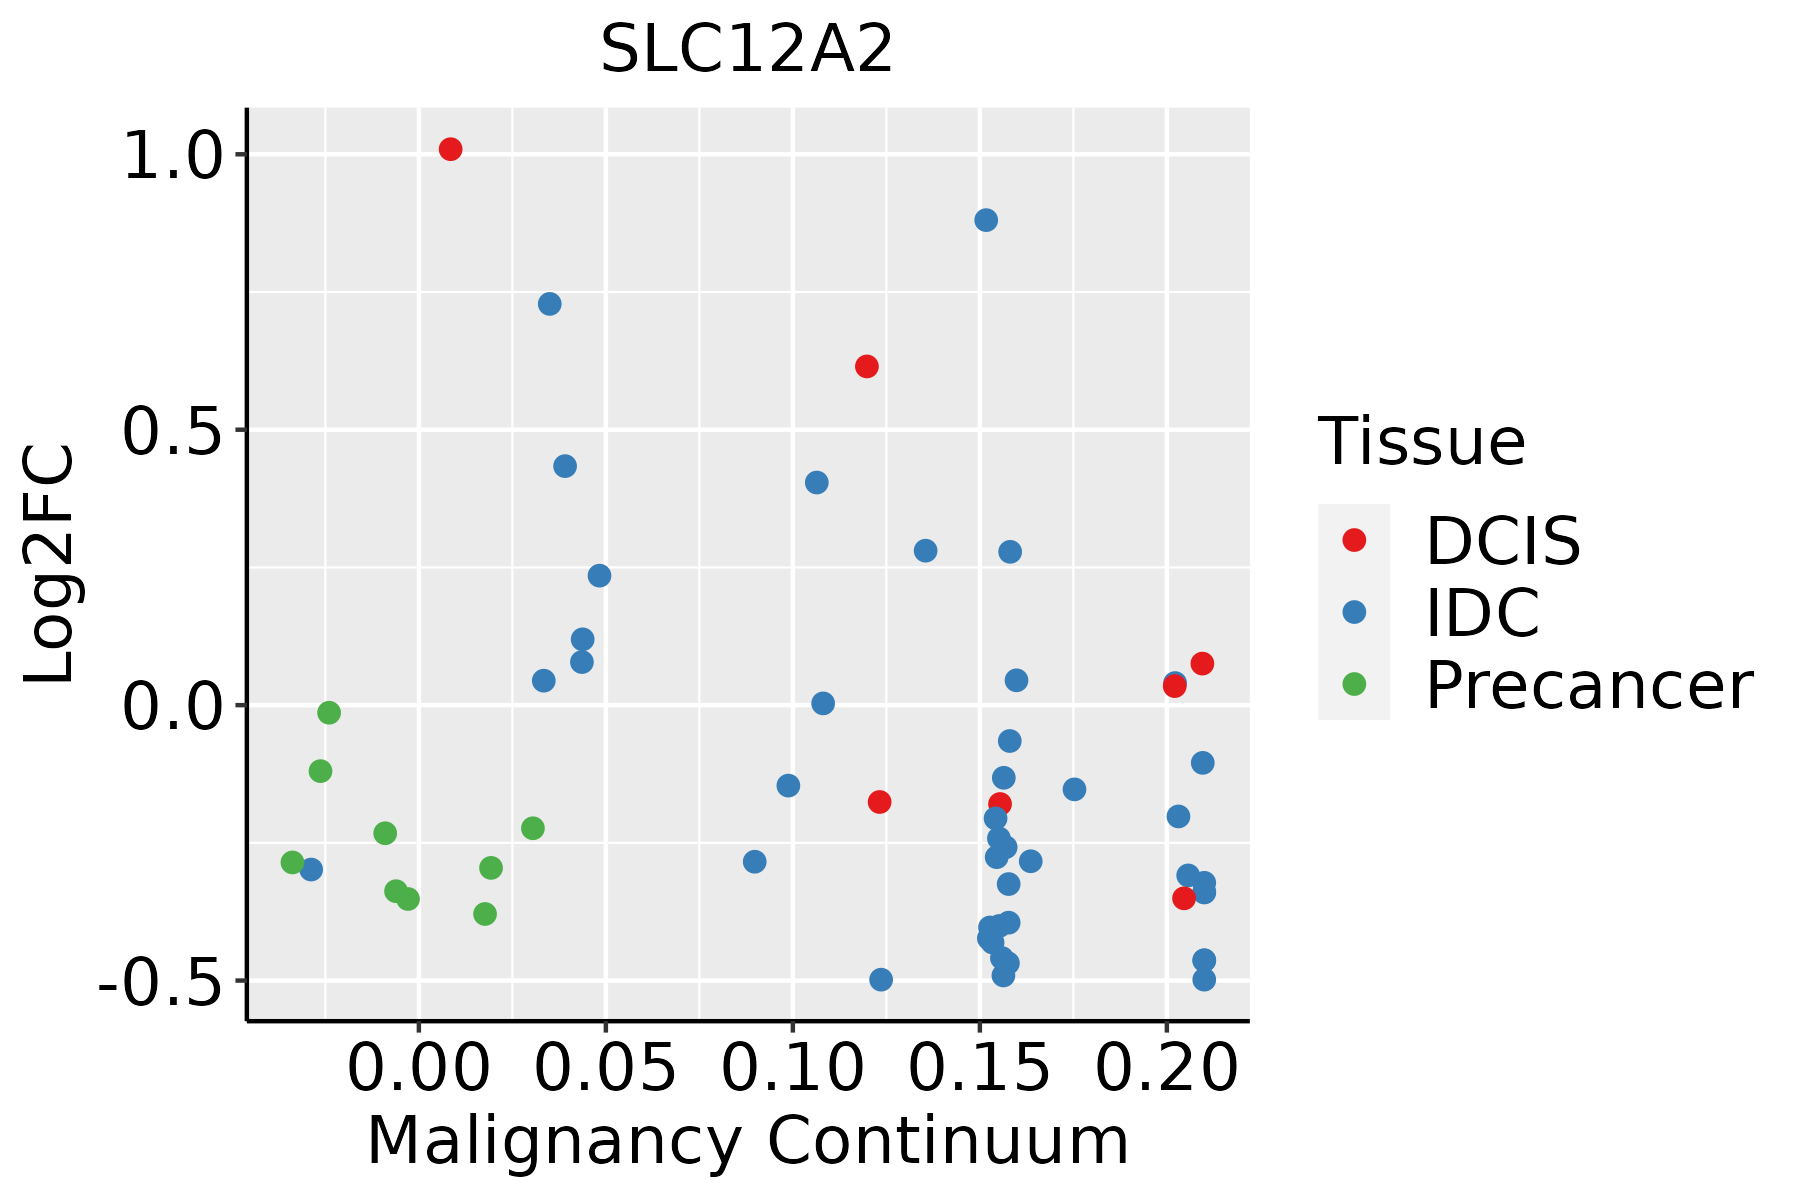 | IDC: Invasive ductal carcinoma |
| DCIS: Ductal carcinoma in situ |
| Precancer(BRCA1-mut): Precancerous lesion from BRCA1 mutation carriers |
| Colorectum (GSE201348) |  | FAP: Familial adenomatous polyposis |
| CRC: Colorectal cancer |
| Colorectum (HTA11) |  | AD: Adenomas |
| SER: Sessile serrated lesions |
| MSI-H: Microsatellite-high colorectal cancer |
| MSS: Microsatellite stable colorectal cancer |
| Endometrium | 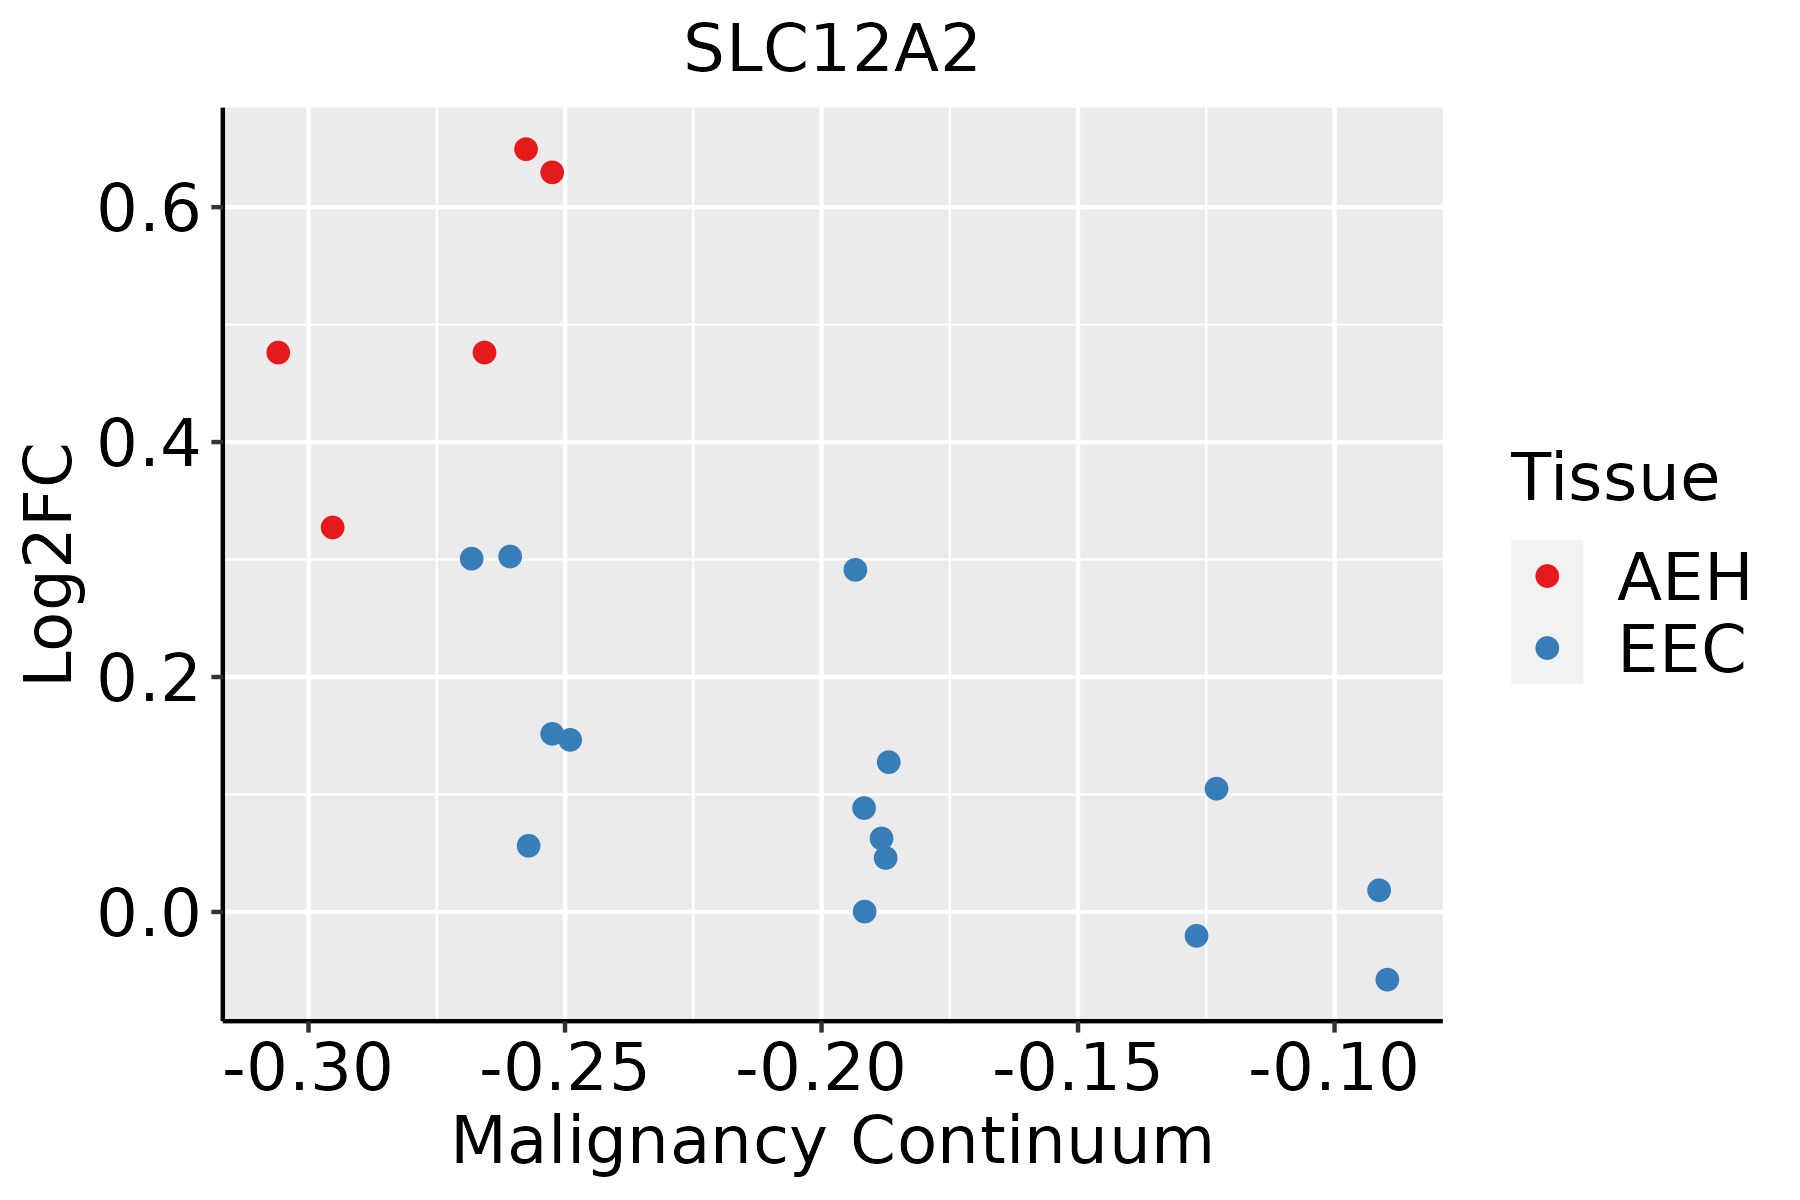 | AEH: Atypical endometrial hyperplasia |
| EEC: Endometrioid Cancer |
| Esophagus | 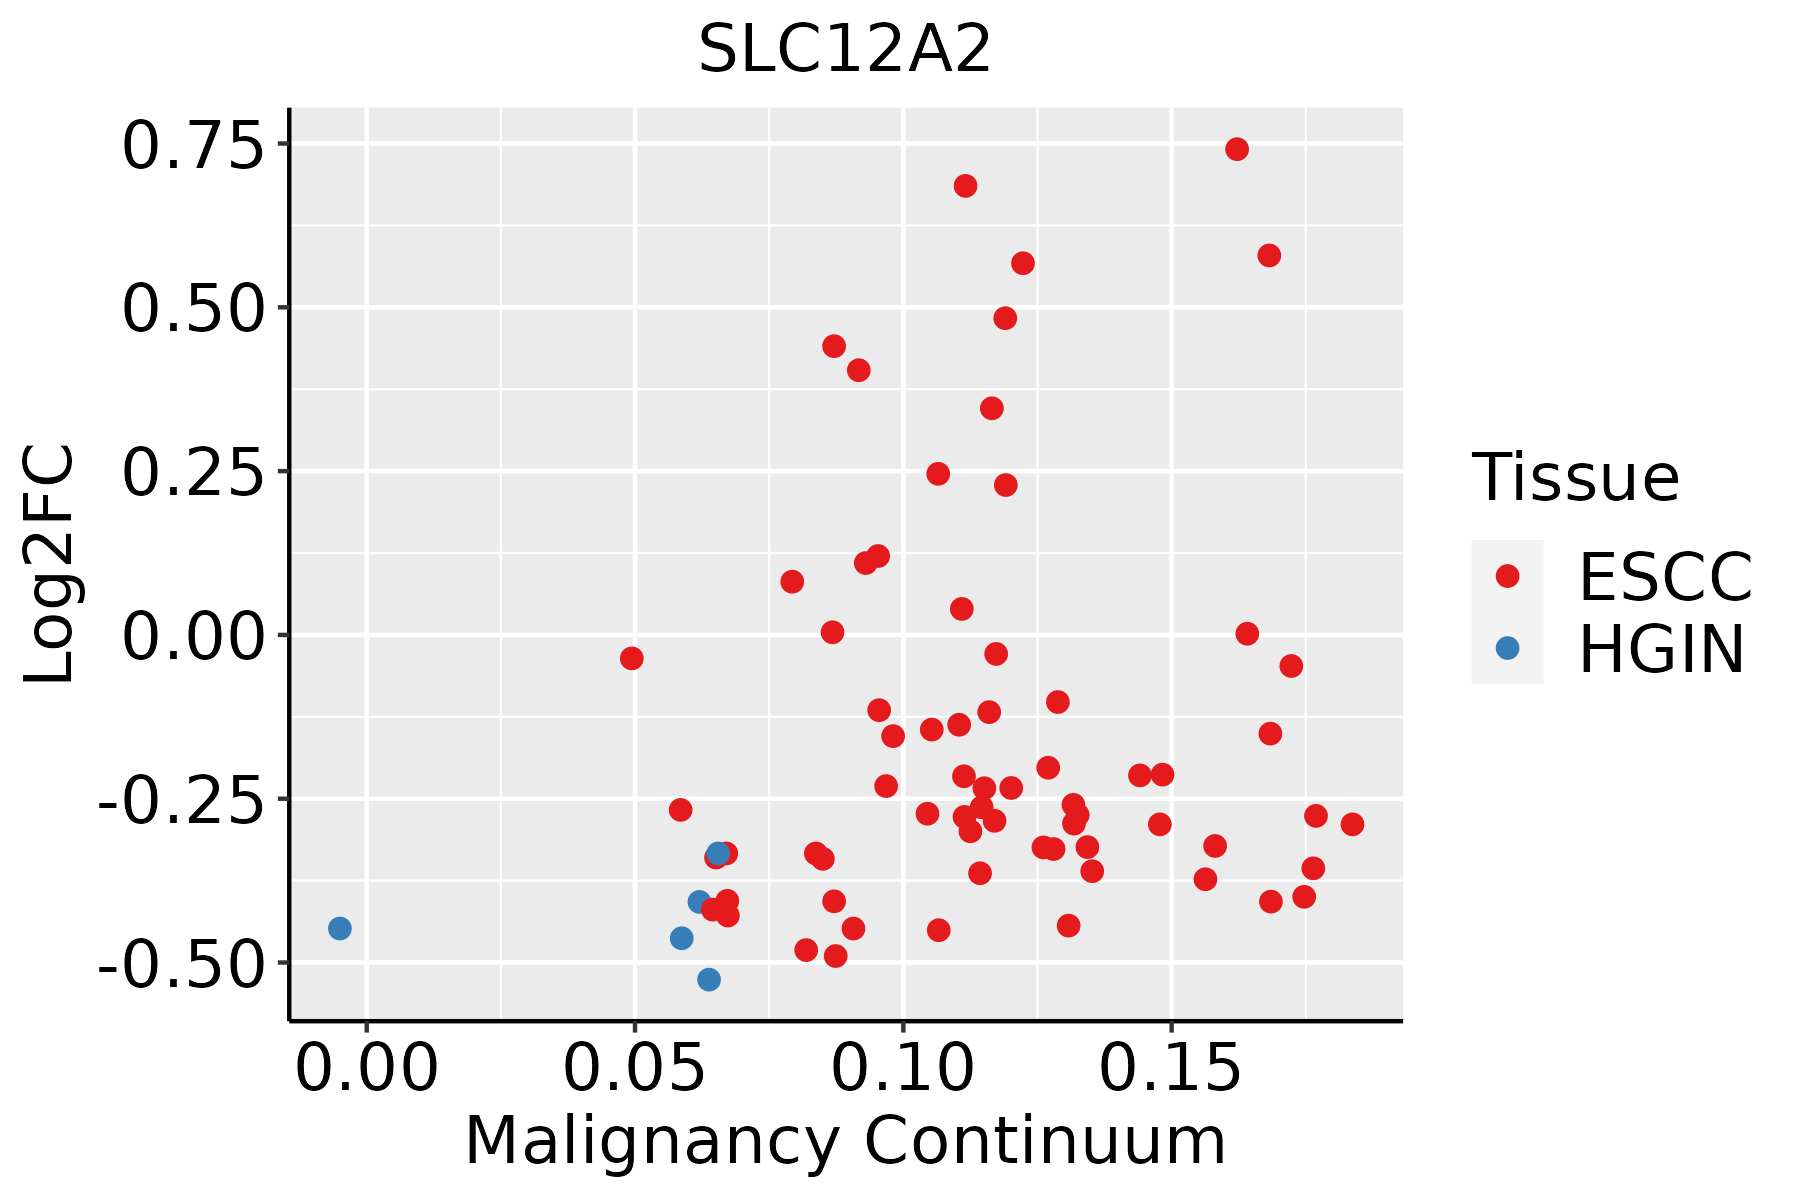 | ESCC: Esophageal squamous cell carcinoma |
| HGIN: High-grade intraepithelial neoplasias |
| LGIN: Low-grade intraepithelial neoplasias |
| GC | 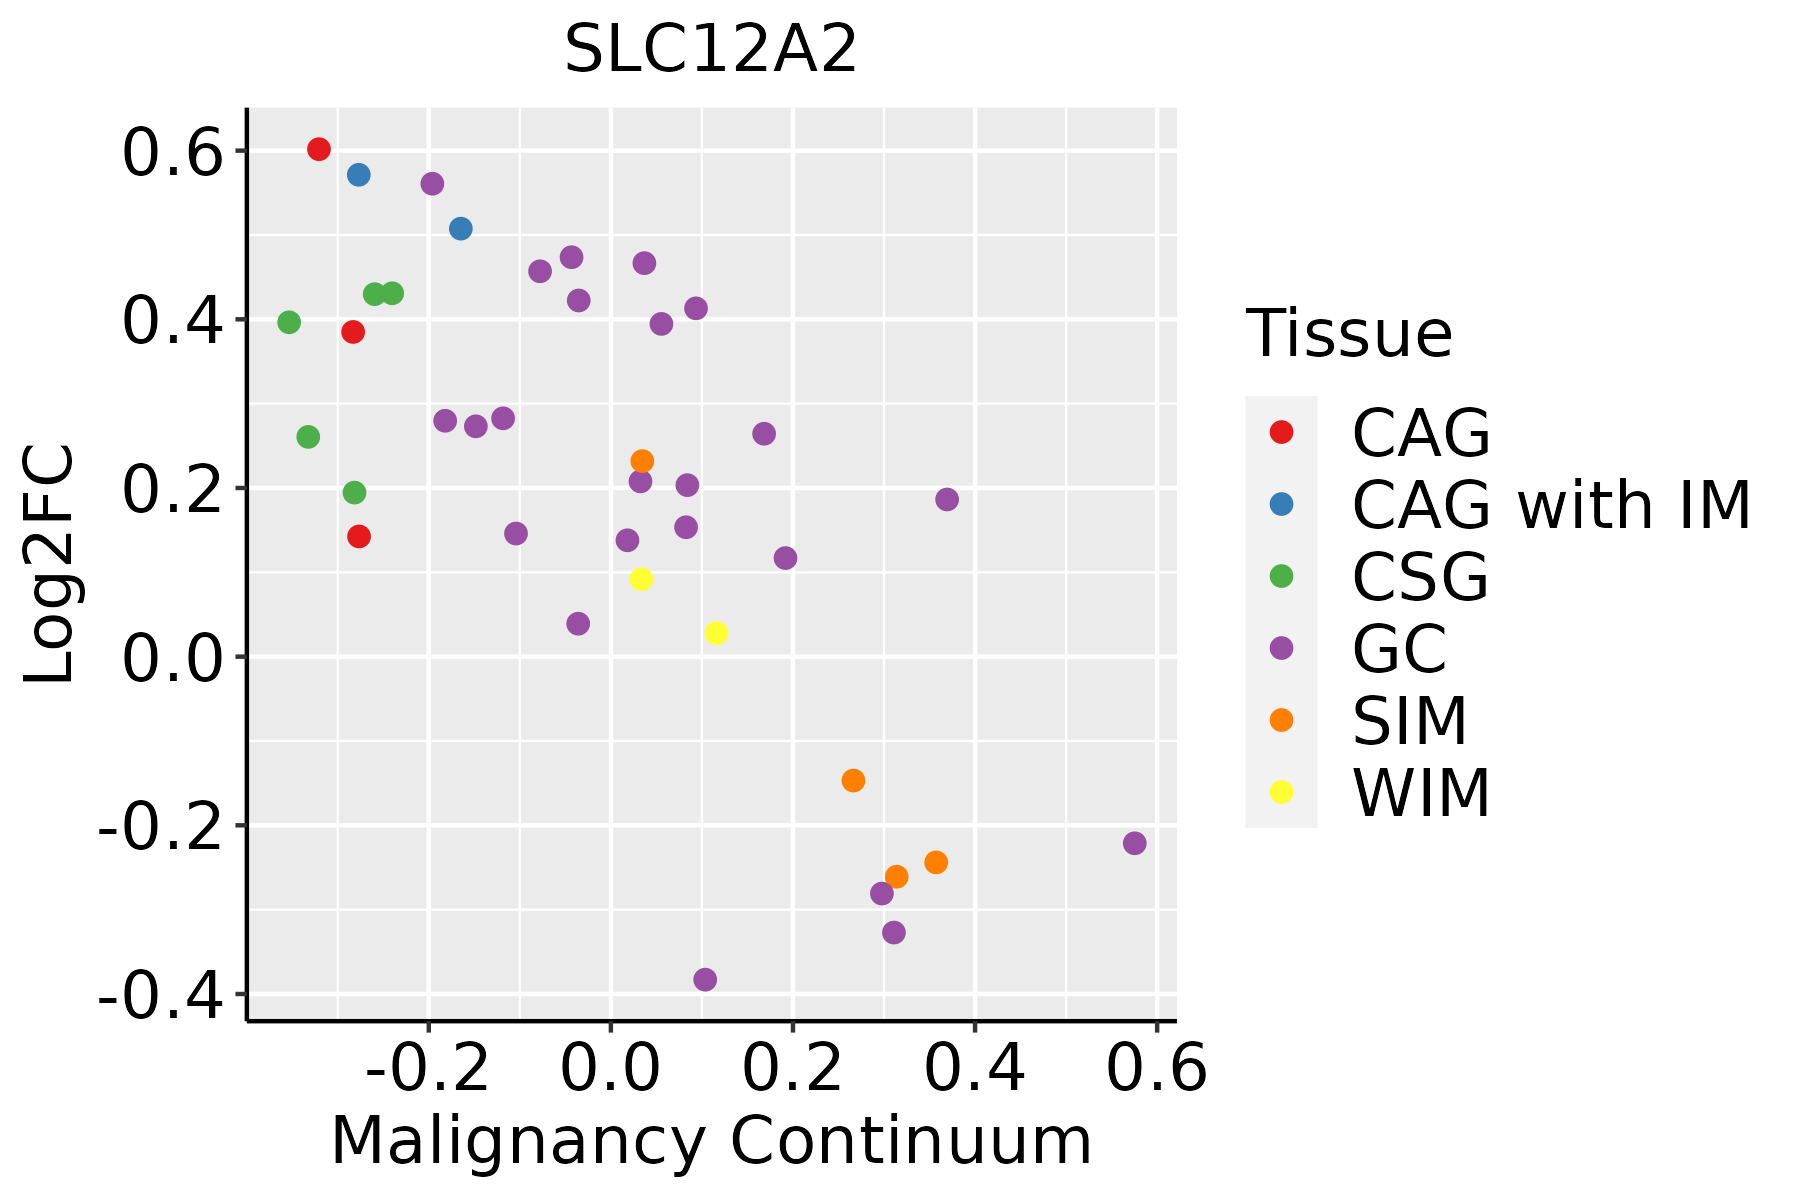 | CAG: Chronic atrophic gastritis |
| CAG with IM: Chronic atrophic gastritis with intestinal metaplasia |
| CSG: Chronic superficial gastritis |
| GC: Gastric cancer |
| SIM: Severe intestinal metaplasia |
| WIM: Wild intestinal metaplasia |
| Liver |  | HCC: Hepatocellular carcinoma |
| NAFLD: Non-alcoholic fatty liver disease |
| Oral Cavity | 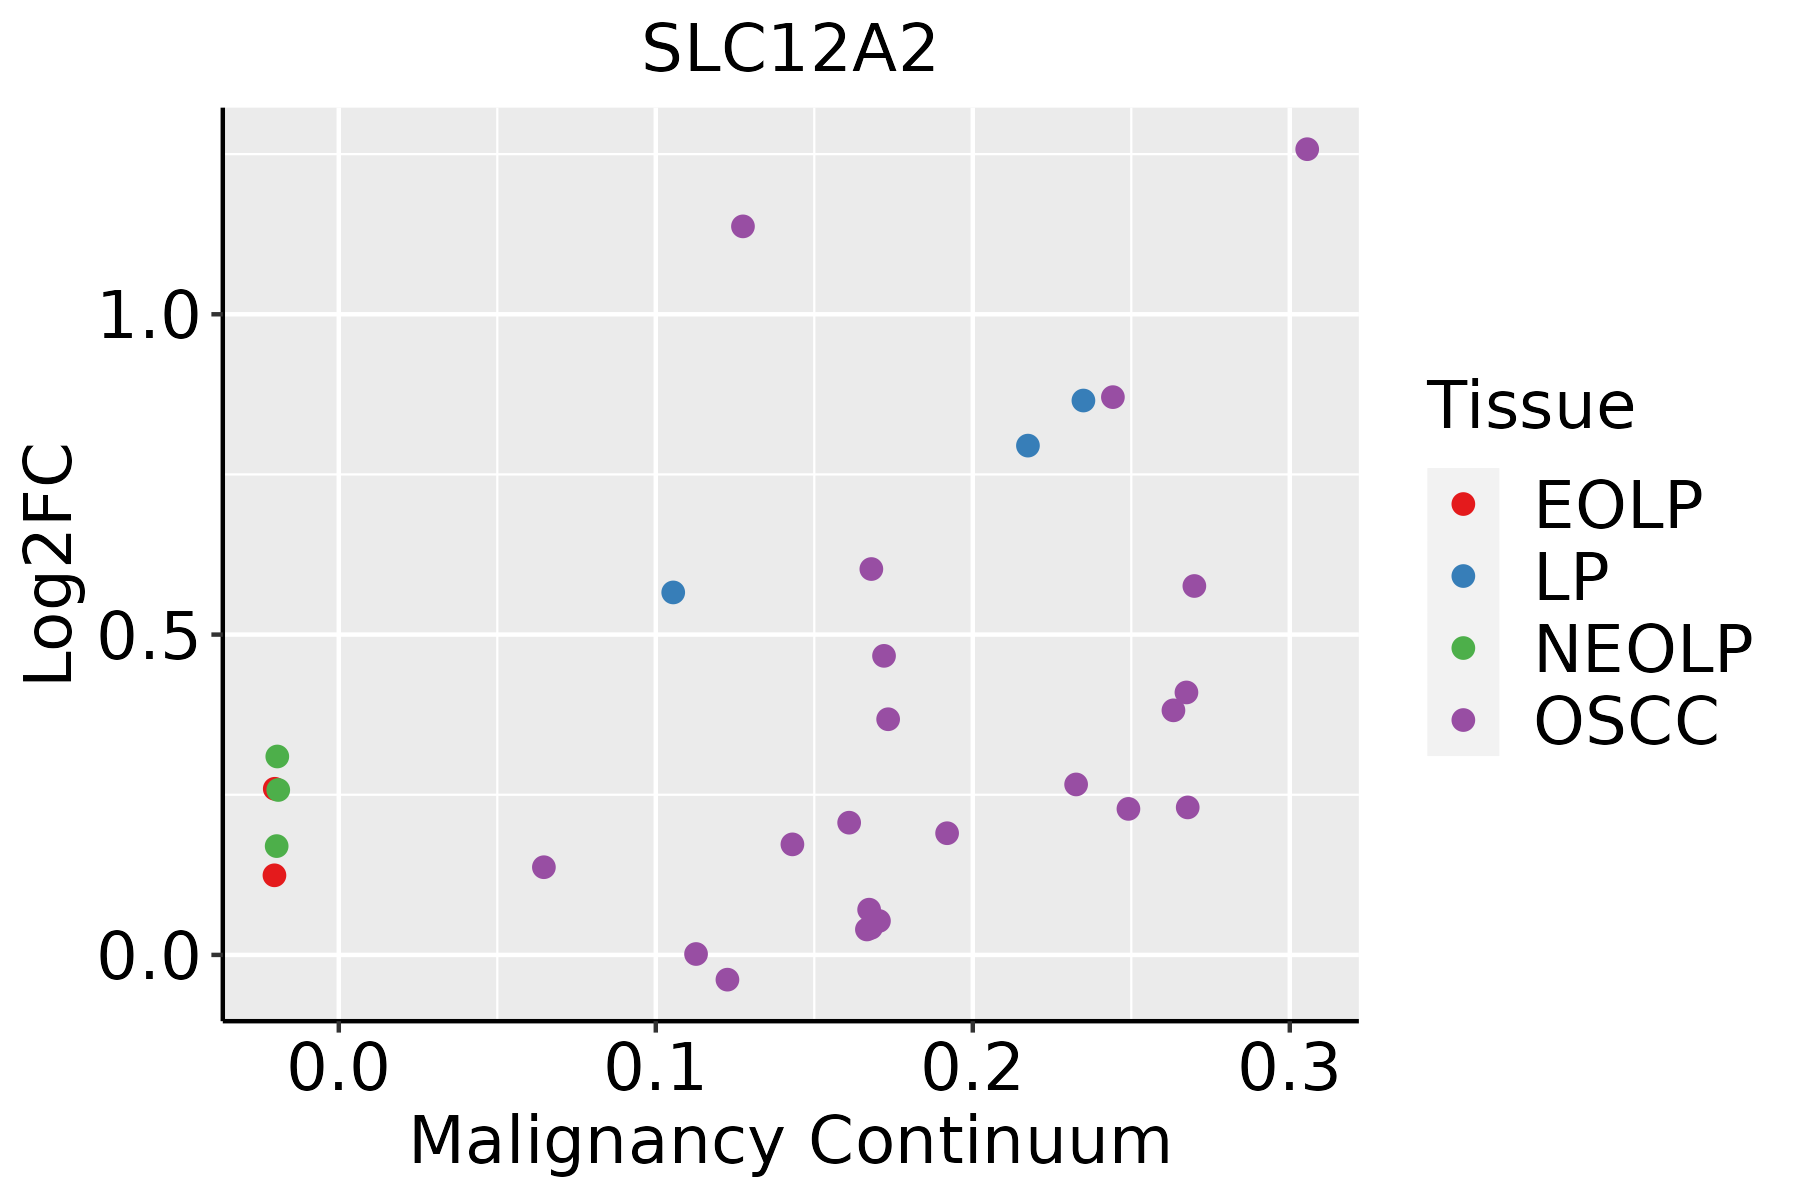 | EOLP: Erosive Oral lichen planus |
| LP: leukoplakia |
| NEOLP: Non-erosive oral lichen planus |
| OSCC: Oral squamous cell carcinoma |
| Prostate |  | BPH: Benign Prostatic Hyperplasia |
| Skin | 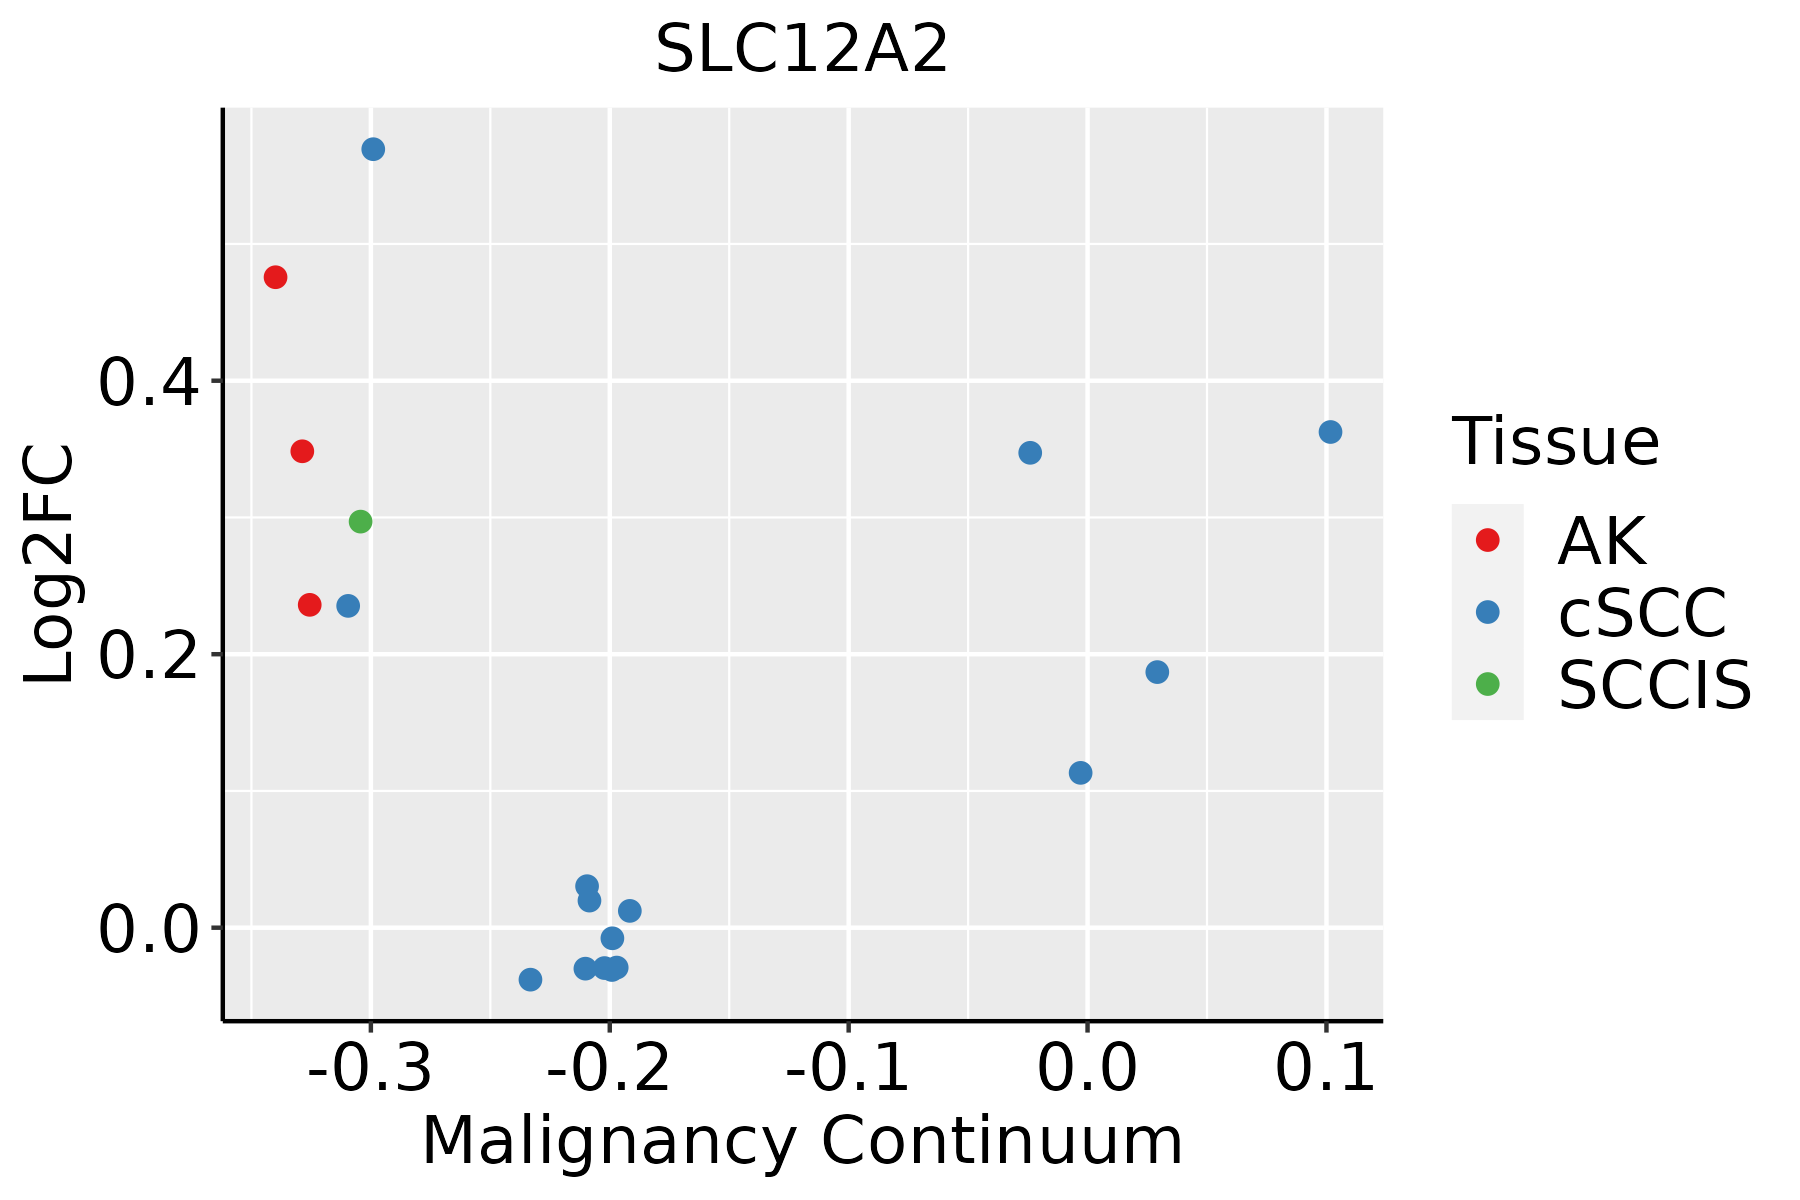 | AK: Actinic keratosis |
| cSCC: Cutaneous squamous cell carcinoma |
| SCCIS:squamous cell carcinoma in situ |
| Thyroid | 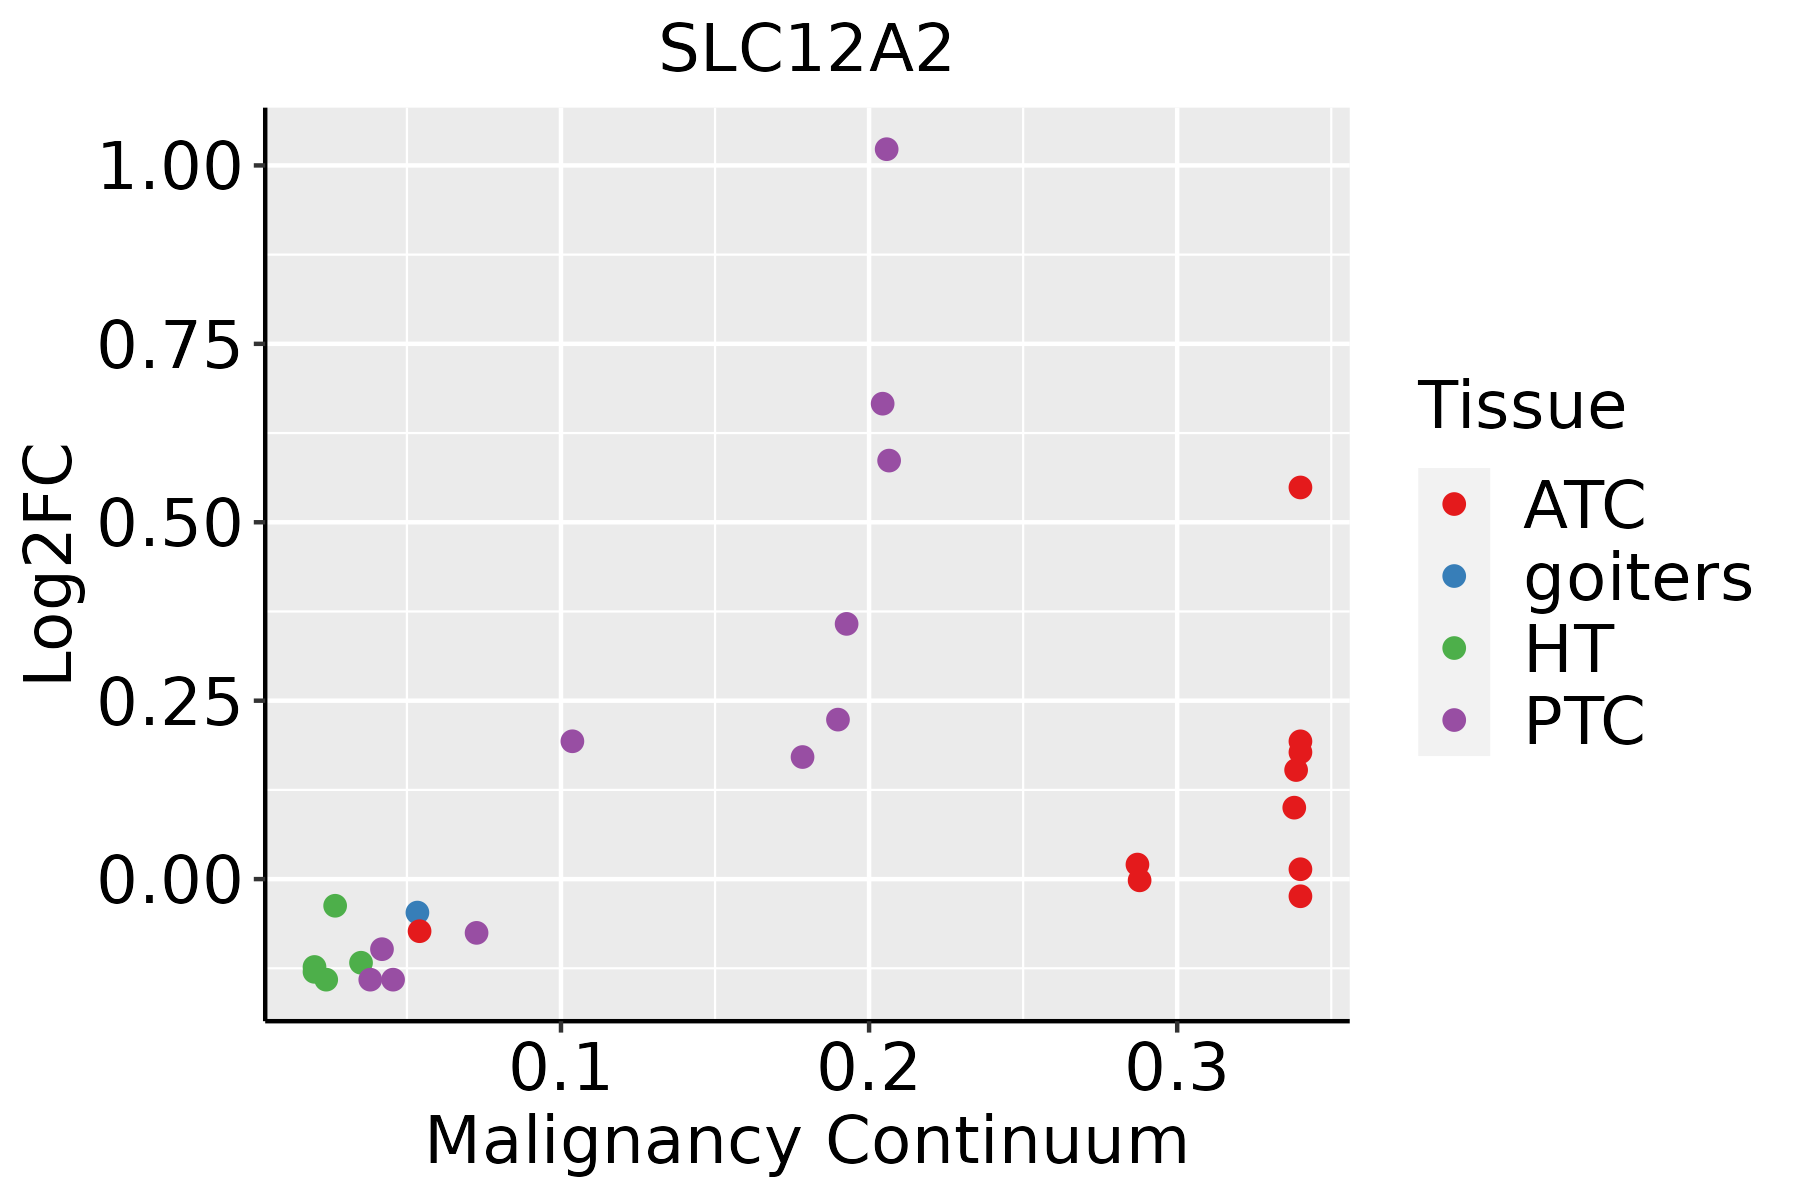 | ATC: Anaplastic thyroid cancer |
| HT: Hashimoto's thyroiditis |
| PTC: Papillary thyroid cancer |
| GO ID | Tissue | Disease Stage | Description | Gene Ratio | Bg Ratio | pvalue | p.adjust | Count |
| GO:000930613 | Breast | IDC | protein secretion | 41/1434 | 359/18723 | 6.64e-03 | 4.63e-02 | 41 |
| GO:003559213 | Breast | IDC | establishment of protein localization to extracellular region | 41/1434 | 360/18723 | 6.96e-03 | 4.81e-02 | 41 |
| GO:001003824 | Breast | DCIS | response to metal ion | 65/1390 | 373/18723 | 8.03e-11 | 9.88e-09 | 65 |
| GO:003059521 | Breast | DCIS | leukocyte chemotaxis | 39/1390 | 230/18723 | 9.85e-07 | 3.93e-05 | 39 |
| GO:005090021 | Breast | DCIS | leukocyte migration | 54/1390 | 369/18723 | 1.22e-06 | 4.78e-05 | 54 |
| GO:000756823 | Breast | DCIS | aging | 50/1390 | 339/18723 | 2.38e-06 | 8.46e-05 | 50 |
| GO:006032621 | Breast | DCIS | cell chemotaxis | 46/1390 | 310/18723 | 5.05e-06 | 1.48e-04 | 46 |
| GO:004206024 | Breast | DCIS | wound healing | 54/1390 | 422/18723 | 6.09e-05 | 1.22e-03 | 54 |
| GO:00457652 | Breast | DCIS | regulation of angiogenesis | 44/1390 | 342/18723 | 2.50e-04 | 3.87e-03 | 44 |
| GO:19013422 | Breast | DCIS | regulation of vasculature development | 44/1390 | 348/18723 | 3.67e-04 | 5.17e-03 | 44 |
| GO:007167421 | Breast | DCIS | mononuclear cell migration | 28/1390 | 196/18723 | 6.29e-04 | 7.90e-03 | 28 |
| GO:005070822 | Breast | DCIS | regulation of protein secretion | 35/1390 | 268/18723 | 7.83e-04 | 9.11e-03 | 35 |
| GO:190303422 | Breast | DCIS | regulation of response to wounding | 24/1390 | 167/18723 | 1.37e-03 | 1.42e-02 | 24 |
| GO:007124822 | Breast | DCIS | cellular response to metal ion | 27/1390 | 197/18723 | 1.46e-03 | 1.49e-02 | 27 |
| GO:004327011 | Breast | DCIS | positive regulation of ion transport | 34/1390 | 275/18723 | 2.35e-03 | 2.13e-02 | 34 |
| GO:00300072 | Breast | DCIS | cellular potassium ion homeostasis | 5/1390 | 14/18723 | 2.54e-03 | 2.28e-02 | 5 |
| GO:003253514 | Breast | DCIS | regulation of cellular component size | 44/1390 | 383/18723 | 2.58e-03 | 2.30e-02 | 44 |
| GO:007124123 | Breast | DCIS | cellular response to inorganic substance | 29/1390 | 226/18723 | 2.75e-03 | 2.41e-02 | 29 |
| GO:000189423 | Breast | DCIS | tissue homeostasis | 33/1390 | 268/18723 | 2.88e-03 | 2.48e-02 | 33 |
| GO:003563321 | Breast | DCIS | maintenance of blood-brain barrier | 8/1390 | 35/18723 | 3.49e-03 | 2.90e-02 | 8 |
| Pathway ID | Tissue | Disease Stage | Description | Gene Ratio | Bg Ratio | pvalue | p.adjust | qvalue | Count |
| hsa0511014 | Breast | Precancer | Vibrio cholerae infection | 14/684 | 50/8465 | 2.67e-05 | 2.64e-04 | 2.02e-04 | 14 |
| hsa0511015 | Breast | Precancer | Vibrio cholerae infection | 14/684 | 50/8465 | 2.67e-05 | 2.64e-04 | 2.02e-04 | 14 |
| hsa0511022 | Breast | IDC | Vibrio cholerae infection | 17/867 | 50/8465 | 4.82e-06 | 6.82e-05 | 5.10e-05 | 17 |
| hsa049704 | Breast | IDC | Salivary secretion | 18/867 | 93/8465 | 5.69e-03 | 3.13e-02 | 2.34e-02 | 18 |
| hsa0511032 | Breast | IDC | Vibrio cholerae infection | 17/867 | 50/8465 | 4.82e-06 | 6.82e-05 | 5.10e-05 | 17 |
| hsa0497011 | Breast | IDC | Salivary secretion | 18/867 | 93/8465 | 5.69e-03 | 3.13e-02 | 2.34e-02 | 18 |
| hsa0511041 | Breast | DCIS | Vibrio cholerae infection | 17/846 | 50/8465 | 3.45e-06 | 4.45e-05 | 3.28e-05 | 17 |
| hsa0511051 | Breast | DCIS | Vibrio cholerae infection | 17/846 | 50/8465 | 3.45e-06 | 4.45e-05 | 3.28e-05 | 17 |
| hsa05110 | Colorectum | AD | Vibrio cholerae infection | 29/2092 | 50/8465 | 5.10e-07 | 7.12e-06 | 4.54e-06 | 29 |
| hsa04972 | Colorectum | AD | Pancreatic secretion | 36/2092 | 102/8465 | 1.06e-02 | 3.98e-02 | 2.54e-02 | 36 |
| hsa051101 | Colorectum | AD | Vibrio cholerae infection | 29/2092 | 50/8465 | 5.10e-07 | 7.12e-06 | 4.54e-06 | 29 |
| hsa049721 | Colorectum | AD | Pancreatic secretion | 36/2092 | 102/8465 | 1.06e-02 | 3.98e-02 | 2.54e-02 | 36 |
| hsa051102 | Colorectum | SER | Vibrio cholerae infection | 24/1580 | 50/8465 | 2.17e-06 | 3.13e-05 | 2.28e-05 | 24 |
| hsa049722 | Colorectum | SER | Pancreatic secretion | 30/1580 | 102/8465 | 5.41e-03 | 3.28e-02 | 2.38e-02 | 30 |
| hsa051103 | Colorectum | SER | Vibrio cholerae infection | 24/1580 | 50/8465 | 2.17e-06 | 3.13e-05 | 2.28e-05 | 24 |
| hsa049723 | Colorectum | SER | Pancreatic secretion | 30/1580 | 102/8465 | 5.41e-03 | 3.28e-02 | 2.38e-02 | 30 |
| hsa051104 | Colorectum | MSS | Vibrio cholerae infection | 27/1875 | 50/8465 | 8.58e-07 | 1.20e-05 | 7.34e-06 | 27 |
| hsa049724 | Colorectum | MSS | Pancreatic secretion | 33/1875 | 102/8465 | 1.09e-02 | 3.75e-02 | 2.30e-02 | 33 |
| hsa051105 | Colorectum | MSS | Vibrio cholerae infection | 27/1875 | 50/8465 | 8.58e-07 | 1.20e-05 | 7.34e-06 | 27 |
| hsa049725 | Colorectum | MSS | Pancreatic secretion | 33/1875 | 102/8465 | 1.09e-02 | 3.75e-02 | 2.30e-02 | 33 |
| Hugo Symbol | Variant Class | Variant Classification | dbSNP RS | HGVSc | HGVSp | HGVSp Short | SWISSPROT | BIOTYPE | SIFT | PolyPhen | Tumor Sample Barcode | Tissue | Histology | Sex | Age | Stage | Therapy Types | Drugs | Outcome |
| SLC12A2 | SNV | Missense_Mutation | | c.2921N>T | p.Thr974Ile | p.T974I | P55011 | protein_coding | tolerated(0.35) | benign(0) | TCGA-A8-A08S-01 | Breast | breast invasive carcinoma | Female | >=65 | I/II | Hormone Therapy | anastrozole | SD |
| SLC12A2 | SNV | Missense_Mutation | | c.2813T>C | p.Leu938Ser | p.L938S | P55011 | protein_coding | tolerated(0.28) | benign(0.115) | TCGA-AN-A0AK-01 | Breast | breast invasive carcinoma | Female | >=65 | I/II | Unknown | Unknown | SD |
| SLC12A2 | SNV | Missense_Mutation | rs772305204 | c.1461N>G | p.Phe487Leu | p.F487L | P55011 | protein_coding | deleterious(0.01) | probably_damaging(0.998) | TCGA-BH-A0B5-01 | Breast | breast invasive carcinoma | Female | <65 | III/IV | Chemotherapy | adriamycin | CR |
| SLC12A2 | SNV | Missense_Mutation | | c.985N>A | p.Val329Ile | p.V329I | P55011 | protein_coding | tolerated(0.06) | probably_damaging(0.99) | TCGA-BH-A0HL-01 | Breast | breast invasive carcinoma | Female | <65 | I/II | Chemotherapy | cyclophosphamide | SD |
| SLC12A2 | SNV | Missense_Mutation | rs111986207 | c.2739A>G | p.Ile913Met | p.I913M | P55011 | protein_coding | tolerated(0.27) | benign(0.097) | TCGA-BH-A18G-01 | Breast | breast invasive carcinoma | Female | >=65 | I/II | Unknown | Unknown | SD |
| SLC12A2 | SNV | Missense_Mutation | | c.1593N>T | p.Leu531Phe | p.L531F | P55011 | protein_coding | tolerated(0.06) | benign(0.401) | TCGA-E9-A1RH-01 | Breast | breast invasive carcinoma | Female | <65 | I/II | Chemotherapy | 5-fluorouracil | SD |
| SLC12A2 | SNV | Missense_Mutation | | c.1594N>A | p.Val532Ile | p.V532I | P55011 | protein_coding | tolerated(0.24) | possibly_damaging(0.728) | TCGA-E9-A1RH-01 | Breast | breast invasive carcinoma | Female | <65 | I/II | Chemotherapy | 5-fluorouracil | SD |
| SLC12A2 | SNV | Missense_Mutation | novel | c.1070C>T | p.Ser357Phe | p.S357F | P55011 | protein_coding | deleterious(0) | probably_damaging(0.998) | TCGA-XX-A89A-01 | Breast | breast invasive carcinoma | Female | >=65 | I/II | Unknown | Unknown | SD |
| SLC12A2 | insertion | In_Frame_Ins | novel | c.1124_1125insAGATTTTATTTACTCTTTTTCCAGTTT | p.Ala375_Asn376insAspPheIleTyrSerPheSerSerPhe | p.A375_N376insDFIYSFSSF | P55011 | protein_coding | | | TCGA-BH-A0AY-01 | Breast | breast invasive carcinoma | Female | <65 | I/II | Chemotherapy | | SD |
| SLC12A2 | SNV | Missense_Mutation | | c.1129G>A | p.Ala377Thr | p.A377T | P55011 | protein_coding | deleterious(0.04) | probably_damaging(0.996) | TCGA-2W-A8YY-01 | Cervix | cervical & endocervical cancer | Female | <65 | I/II | Chemotherapy | cisplatin | CR |
| Entrez ID | Symbol | Category | Interaction Types | Drug Claim Name | Drug Name | PMIDs |
| 6558 | SLC12A2 | DRUGGABLE GENOME, TRANSPORTER, EXTERNAL SIDE OF PLASMA MEMBRANE | | BUMETANIDE | BUMETANIDE | |
| 6558 | SLC12A2 | DRUGGABLE GENOME, TRANSPORTER, EXTERNAL SIDE OF PLASMA MEMBRANE | | BUMETANIDE | BUMETANIDE | |
| 6558 | SLC12A2 | DRUGGABLE GENOME, TRANSPORTER, EXTERNAL SIDE OF PLASMA MEMBRANE | inhibitor | 178101453 | PIRETANIDE | |
| 6558 | SLC12A2 | DRUGGABLE GENOME, TRANSPORTER, EXTERNAL SIDE OF PLASMA MEMBRANE | inhibitor | 178101539 | BUMETANIDE | |
| 6558 | SLC12A2 | DRUGGABLE GENOME, TRANSPORTER, EXTERNAL SIDE OF PLASMA MEMBRANE | inhibitor | 178101541 | FUROSEMIDE | |


