
|
|||||
|
 | |
| |
| |
| |
| |
| |
|
Gene: SIRT6 |
Gene summary for SIRT6 |
| Gene information | Species | Human | Gene symbol | SIRT6 | Gene ID | 51548 |
| Gene name | sirtuin 6 | |
| Gene Alias | SIR2L6 | |
| Cytomap | 19p13.3 | |
| Gene Type | protein-coding | GO ID | GO:0000018 | UniProtAcc | Q8N6T7 |
Top |
Malignant transformation analysis |
| Identification of the aberrant gene expression in precancerous and cancerous lesions by comparing the gene expression of stem-like cells in diseased tissues with normal stem cells |
| Entrez ID | Symbol | Replicates | Species | Organ | Tissue | Adj P-value | Log2FC | Malignancy |
| 51548 | SIRT6 | HTA11_2487_2000001011 | Human | Colorectum | SER | 1.24e-14 | 5.57e-01 | -0.1808 |
| 51548 | SIRT6 | HTA11_3361_2000001011 | Human | Colorectum | AD | 2.52e-03 | 3.31e-01 | -0.1207 |
| 51548 | SIRT6 | HTA11_696_2000001011 | Human | Colorectum | AD | 1.78e-04 | 3.44e-01 | -0.1464 |
| 51548 | SIRT6 | HTA11_1391_2000001011 | Human | Colorectum | AD | 1.60e-02 | 2.35e-01 | -0.059 |
| 51548 | SIRT6 | LZE4T | Human | Esophagus | ESCC | 3.93e-05 | 1.43e-01 | 0.0811 |
| 51548 | SIRT6 | LZE7T | Human | Esophagus | ESCC | 1.32e-06 | 3.05e-01 | 0.0667 |
| 51548 | SIRT6 | LZE8T | Human | Esophagus | ESCC | 1.29e-04 | 1.82e-01 | 0.067 |
| 51548 | SIRT6 | LZE20T | Human | Esophagus | ESCC | 4.56e-08 | 1.46e-01 | 0.0662 |
| 51548 | SIRT6 | LZE22T | Human | Esophagus | ESCC | 3.34e-02 | 2.51e-01 | 0.068 |
| 51548 | SIRT6 | LZE24T | Human | Esophagus | ESCC | 7.12e-09 | 2.23e-01 | 0.0596 |
| 51548 | SIRT6 | LZE21T | Human | Esophagus | ESCC | 1.34e-04 | 2.25e-01 | 0.0655 |
| 51548 | SIRT6 | LZE6T | Human | Esophagus | ESCC | 5.08e-05 | 2.52e-01 | 0.0845 |
| 51548 | SIRT6 | P1T-E | Human | Esophagus | ESCC | 5.05e-08 | 2.48e-01 | 0.0875 |
| 51548 | SIRT6 | P2T-E | Human | Esophagus | ESCC | 1.30e-15 | 2.52e-01 | 0.1177 |
| 51548 | SIRT6 | P4T-E | Human | Esophagus | ESCC | 1.37e-18 | 3.52e-01 | 0.1323 |
| 51548 | SIRT6 | P5T-E | Human | Esophagus | ESCC | 1.13e-08 | 1.87e-01 | 0.1327 |
| 51548 | SIRT6 | P8T-E | Human | Esophagus | ESCC | 2.28e-35 | 5.94e-01 | 0.0889 |
| 51548 | SIRT6 | P9T-E | Human | Esophagus | ESCC | 8.65e-21 | 3.56e-01 | 0.1131 |
| 51548 | SIRT6 | P10T-E | Human | Esophagus | ESCC | 1.01e-32 | 4.74e-01 | 0.116 |
| 51548 | SIRT6 | P11T-E | Human | Esophagus | ESCC | 4.89e-11 | 3.99e-01 | 0.1426 |
| Page: 1 2 3 4 5 |
| Tissue | Expression Dynamics | Abbreviation |
| Colorectum (GSE201348) | 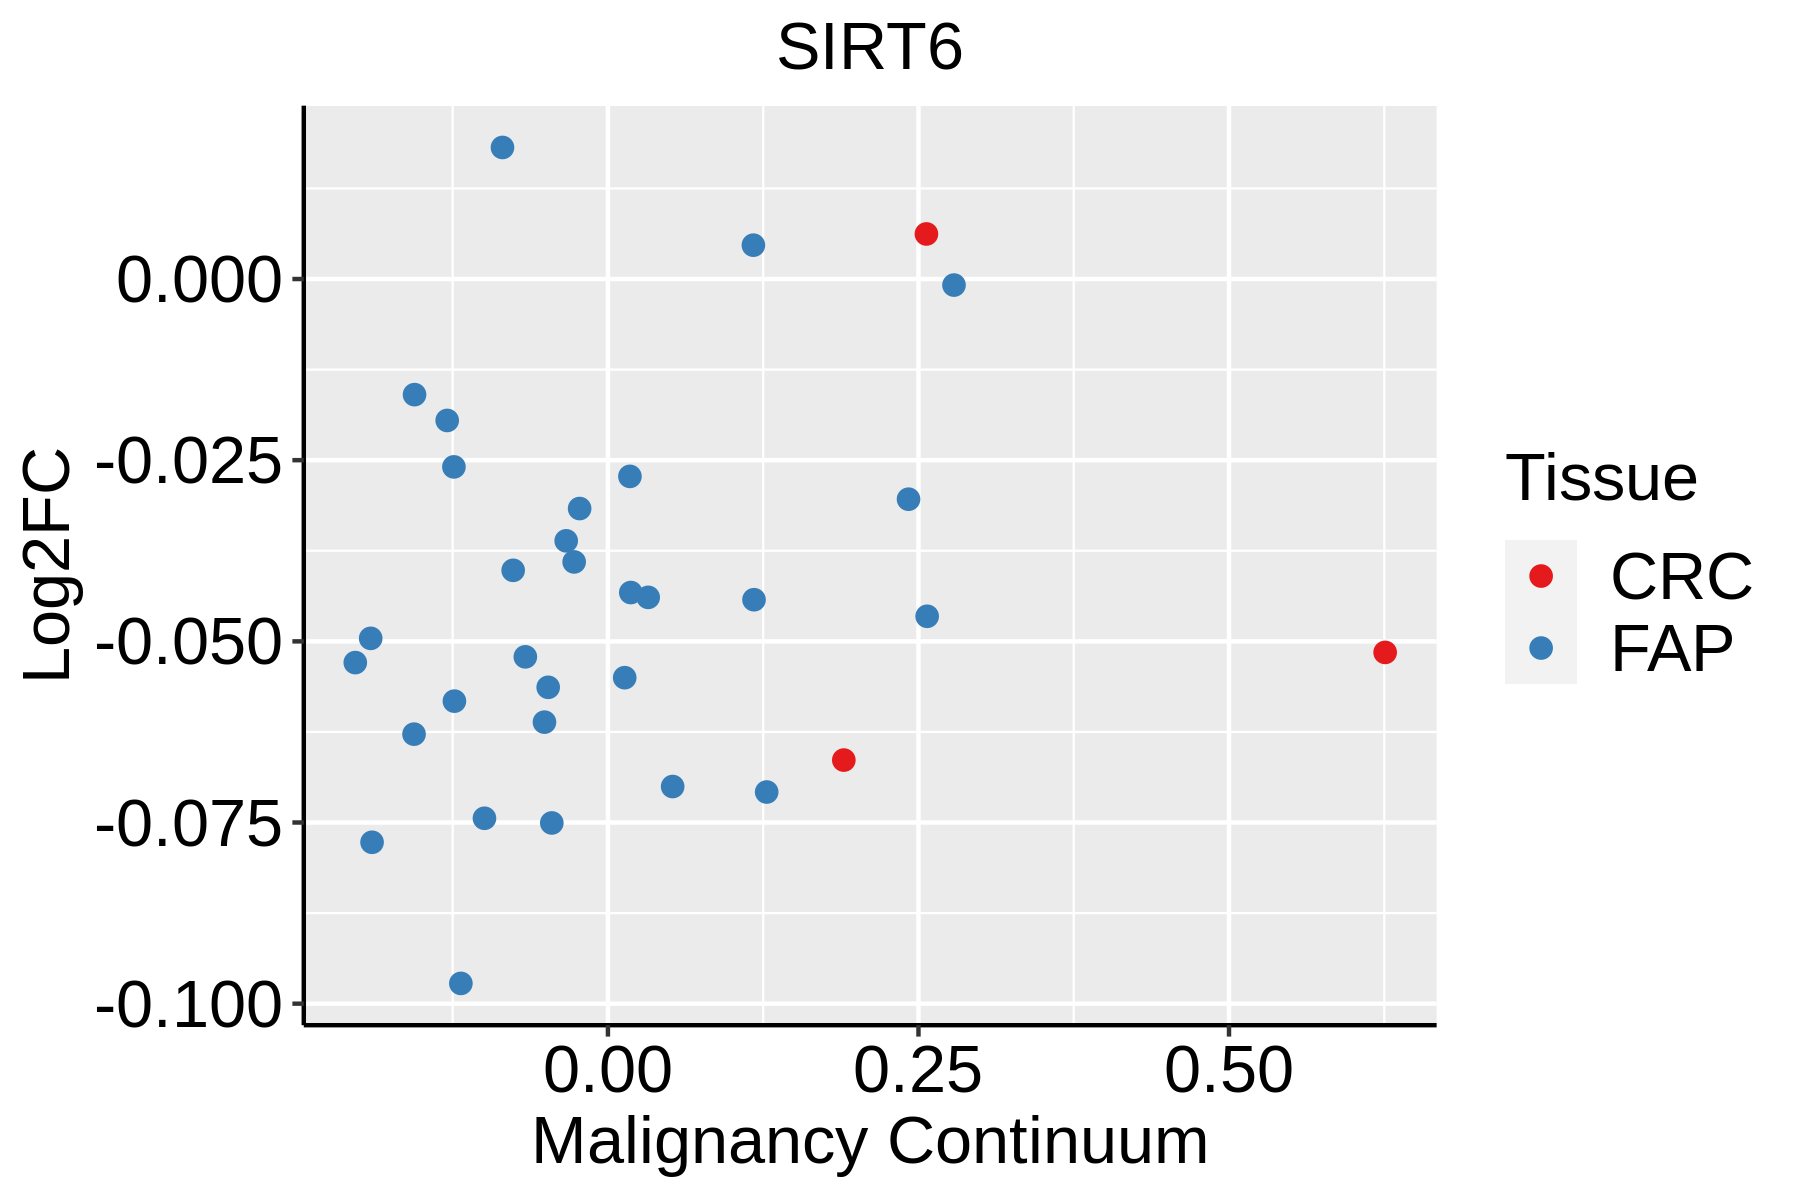 | FAP: Familial adenomatous polyposis |
| CRC: Colorectal cancer | ||
| Colorectum (HTA11) |  | AD: Adenomas |
| SER: Sessile serrated lesions | ||
| MSI-H: Microsatellite-high colorectal cancer | ||
| MSS: Microsatellite stable colorectal cancer | ||
| Esophagus | 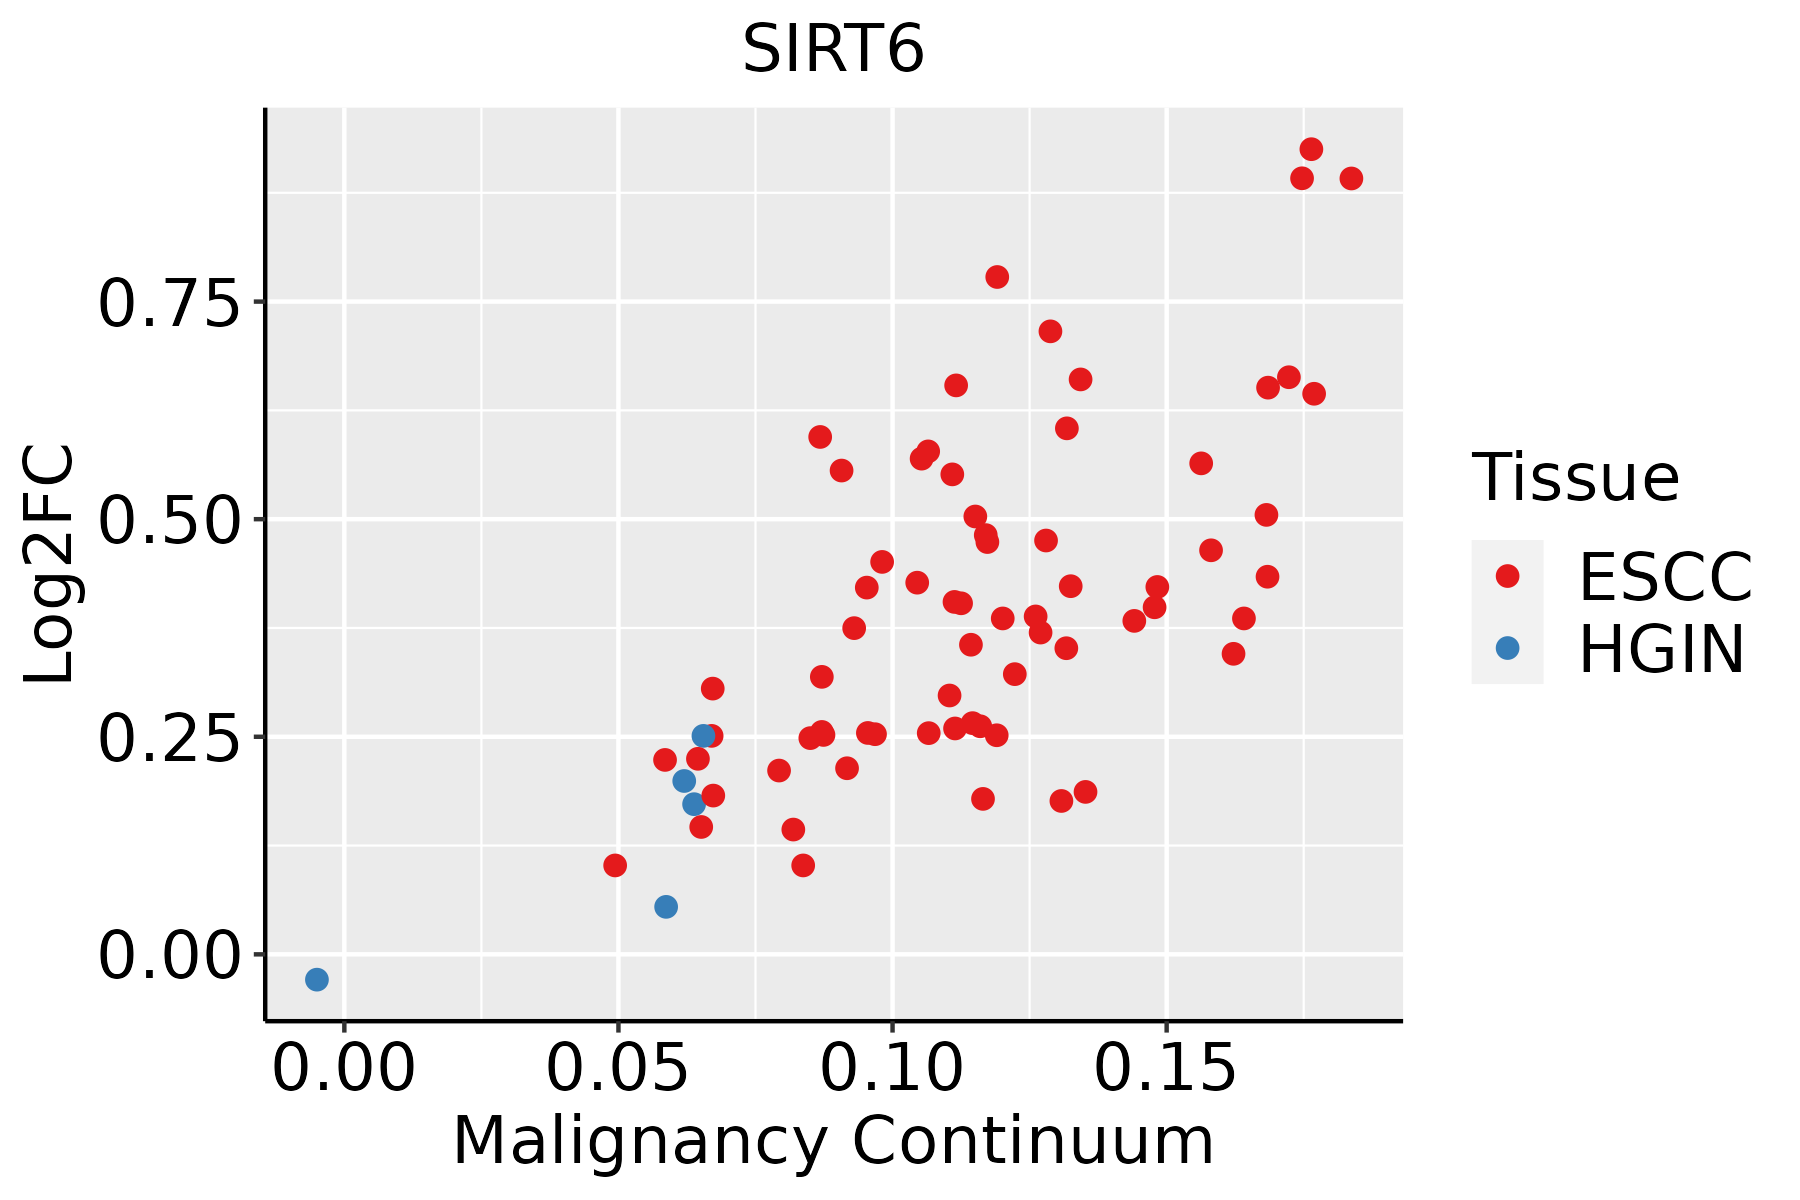 | ESCC: Esophageal squamous cell carcinoma |
| HGIN: High-grade intraepithelial neoplasias | ||
| LGIN: Low-grade intraepithelial neoplasias | ||
| Oral Cavity |  | EOLP: Erosive Oral lichen planus |
| LP: leukoplakia | ||
| NEOLP: Non-erosive oral lichen planus | ||
| OSCC: Oral squamous cell carcinoma | ||
| Thyroid | 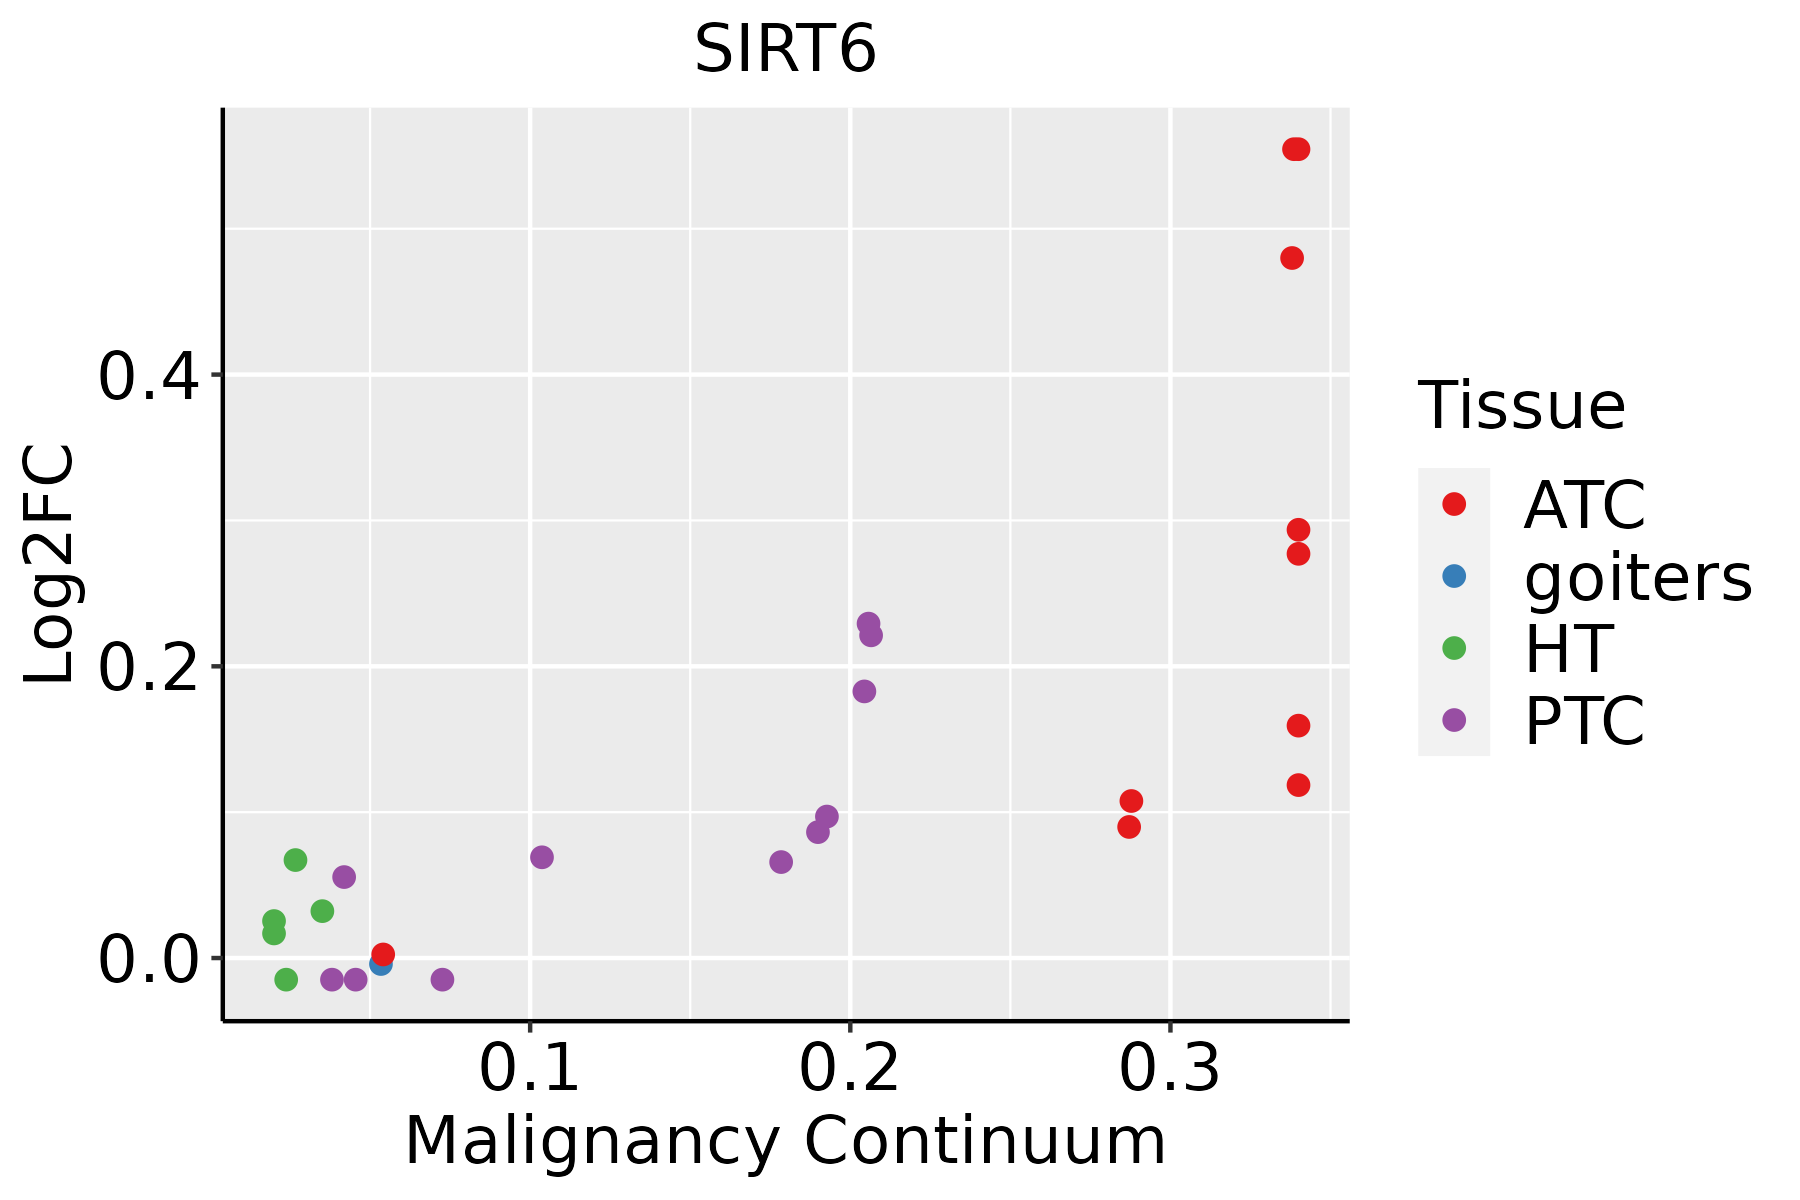 | ATC: Anaplastic thyroid cancer |
| HT: Hashimoto's thyroiditis | ||
| PTC: Papillary thyroid cancer |
| ∗log2FC in expression of this searched gene in stem-like cells from each diseased tissue sample relative to stem-like cells in normal samples in each tissue plotted against the malignancy continuum. Samples are colored based on if they are from different disease stage. |
Top |
Malignant transformation related pathway analysis |
| Find out the enriched GO biological processes and KEGG pathways involved in transition from healthy to precancer to cancer |
| Tissue | Disease Stage | Enriched GO biological Processes |
| Colorectum | AD |  |
| Colorectum | SER |  |
| Colorectum | MSS |  |
| Colorectum | MSI-H |  |
| Colorectum | FAP |  |
| ∗Top 15 enriched GO BP terms are showed in the bar plot of each disease state in each tissue. Each row represents a significant GO biological process which is colored according to the -log10(p.adjust). |
| Page: 1 2 3 4 5 6 7 8 9 |
| GO ID | Tissue | Disease Stage | Description | Gene Ratio | Bg Ratio | pvalue | p.adjust | Count |
| GO:00457321 | Colorectum | SER | positive regulation of protein catabolic process | 77/2897 | 231/18723 | 9.91e-12 | 1.90e-09 | 77 |
| GO:00104981 | Colorectum | SER | proteasomal protein catabolic process | 132/2897 | 490/18723 | 3.08e-11 | 5.55e-09 | 132 |
| GO:00098961 | Colorectum | SER | positive regulation of catabolic process | 132/2897 | 492/18723 | 4.16e-11 | 6.72e-09 | 132 |
| GO:00458621 | Colorectum | SER | positive regulation of proteolysis | 106/2897 | 372/18723 | 8.40e-11 | 1.20e-08 | 106 |
| GO:19033641 | Colorectum | SER | positive regulation of cellular protein catabolic process | 56/2897 | 155/18723 | 2.09e-10 | 2.85e-08 | 56 |
| GO:20000581 | Colorectum | SER | regulation of ubiquitin-dependent protein catabolic process | 57/2897 | 164/18723 | 7.98e-10 | 8.74e-08 | 57 |
| GO:00313311 | Colorectum | SER | positive regulation of cellular catabolic process | 114/2897 | 427/18723 | 1.22e-09 | 1.27e-07 | 114 |
| GO:00611361 | Colorectum | SER | regulation of proteasomal protein catabolic process | 62/2897 | 187/18723 | 1.28e-09 | 1.31e-07 | 62 |
| GO:19030521 | Colorectum | SER | positive regulation of proteolysis involved in cellular protein catabolic process | 47/2897 | 133/18723 | 1.30e-08 | 1.02e-06 | 47 |
| GO:20000601 | Colorectum | SER | positive regulation of ubiquitin-dependent protein catabolic process | 40/2897 | 107/18723 | 2.57e-08 | 1.79e-06 | 40 |
| GO:00431611 | Colorectum | SER | proteasome-mediated ubiquitin-dependent protein catabolic process | 105/2897 | 412/18723 | 7.48e-08 | 4.70e-06 | 105 |
| GO:00324341 | Colorectum | SER | regulation of proteasomal ubiquitin-dependent protein catabolic process | 45/2897 | 134/18723 | 1.48e-07 | 8.67e-06 | 45 |
| GO:19018001 | Colorectum | SER | positive regulation of proteasomal protein catabolic process | 38/2897 | 114/18723 | 1.65e-06 | 7.23e-05 | 38 |
| GO:00324361 | Colorectum | SER | positive regulation of proteasomal ubiquitin-dependent protein catabolic process | 32/2897 | 90/18723 | 2.23e-06 | 9.31e-05 | 32 |
| GO:00316671 | Colorectum | SER | response to nutrient levels | 106/2897 | 474/18723 | 3.94e-05 | 1.00e-03 | 106 |
| GO:00510541 | Colorectum | SER | positive regulation of DNA metabolic process | 53/2897 | 201/18723 | 4.51e-05 | 1.13e-03 | 53 |
| GO:00322061 | Colorectum | SER | positive regulation of telomere maintenance | 20/2897 | 52/18723 | 4.80e-05 | 1.18e-03 | 20 |
| GO:20012521 | Colorectum | SER | positive regulation of chromosome organization | 27/2897 | 82/18723 | 6.44e-05 | 1.49e-03 | 27 |
| GO:00510521 | Colorectum | SER | regulation of DNA metabolic process | 83/2897 | 359/18723 | 8.03e-05 | 1.77e-03 | 83 |
| GO:00322041 | Colorectum | SER | regulation of telomere maintenance | 24/2897 | 80/18723 | 7.57e-04 | 9.73e-03 | 24 |
| Page: 1 2 3 4 5 6 7 8 9 10 11 12 13 14 15 16 |
| Pathway ID | Tissue | Disease Stage | Description | Gene Ratio | Bg Ratio | pvalue | p.adjust | qvalue | Count |
| hsa04714 | Colorectum | AD | Thermogenesis | 120/2092 | 232/8465 | 2.76e-19 | 1.16e-17 | 7.37e-18 | 120 |
| hsa05230 | Colorectum | AD | Central carbon metabolism in cancer | 33/2092 | 70/8465 | 3.61e-05 | 3.19e-04 | 2.03e-04 | 33 |
| hsa047141 | Colorectum | AD | Thermogenesis | 120/2092 | 232/8465 | 2.76e-19 | 1.16e-17 | 7.37e-18 | 120 |
| hsa052301 | Colorectum | AD | Central carbon metabolism in cancer | 33/2092 | 70/8465 | 3.61e-05 | 3.19e-04 | 2.03e-04 | 33 |
| hsa047142 | Colorectum | SER | Thermogenesis | 106/1580 | 232/8465 | 1.15e-21 | 6.34e-20 | 4.61e-20 | 106 |
| hsa052302 | Colorectum | SER | Central carbon metabolism in cancer | 25/1580 | 70/8465 | 5.43e-04 | 4.51e-03 | 3.27e-03 | 25 |
| hsa047143 | Colorectum | SER | Thermogenesis | 106/1580 | 232/8465 | 1.15e-21 | 6.34e-20 | 4.61e-20 | 106 |
| hsa052303 | Colorectum | SER | Central carbon metabolism in cancer | 25/1580 | 70/8465 | 5.43e-04 | 4.51e-03 | 3.27e-03 | 25 |
| hsa04714211 | Esophagus | ESCC | Thermogenesis | 163/4205 | 232/8465 | 9.22e-11 | 1.14e-09 | 5.86e-10 | 163 |
| hsa0523018 | Esophagus | ESCC | Central carbon metabolism in cancer | 50/4205 | 70/8465 | 1.70e-04 | 6.62e-04 | 3.39e-04 | 50 |
| hsa04714310 | Esophagus | ESCC | Thermogenesis | 163/4205 | 232/8465 | 9.22e-11 | 1.14e-09 | 5.86e-10 | 163 |
| hsa0523019 | Esophagus | ESCC | Central carbon metabolism in cancer | 50/4205 | 70/8465 | 1.70e-04 | 6.62e-04 | 3.39e-04 | 50 |
| hsa0471430 | Oral cavity | OSCC | Thermogenesis | 138/3704 | 232/8465 | 7.67e-07 | 4.35e-06 | 2.22e-06 | 138 |
| hsa0523016 | Oral cavity | OSCC | Central carbon metabolism in cancer | 49/3704 | 70/8465 | 7.57e-06 | 3.59e-05 | 1.83e-05 | 49 |
| hsa04714113 | Oral cavity | OSCC | Thermogenesis | 138/3704 | 232/8465 | 7.67e-07 | 4.35e-06 | 2.22e-06 | 138 |
| hsa0523017 | Oral cavity | OSCC | Central carbon metabolism in cancer | 49/3704 | 70/8465 | 7.57e-06 | 3.59e-05 | 1.83e-05 | 49 |
| Page: 1 |
Top |
Cell-cell communication analysis |
| Identification of potential cell-cell interactions between two cell types and their ligand-receptor pairs for different disease states |
| Ligand | Receptor | LRpair | Pathway | Tissue | Disease Stage |
| Page: 1 |
Top |
Single-cell gene regulatory network inference analysis |
| Find out the significant the regulons (TFs) and the target genes of each regulon across cell types for different disease states |
| TF | Cell Type | Tissue | Disease Stage | Target Gene | RSS | Regulon Activity |
| SIRT6 | BAS | Breast | IDC | HIST1H2BN,LY6K,CA2, etc. | 8.16e-03 |  |
| SIRT6 | CD8TRM | Breast | Precancer | KCNAB2,FBXO33,PPP2R2B, etc. | 5.57e-02 |  |
| SIRT6 | IMENT | Colorectum | ADJ | CDHR5,INF2,C1QTNF12, etc. | 2.95e-01 |  |
| SIRT6 | IMENT | Colorectum | CRC | CDHR5,INF2,C1QTNF12, etc. | 7.08e-02 |  |
| SIRT6 | ABS | Colorectum | CRC | CDHR5,INF2,C1QTNF12, etc. | 5.20e-02 | |
| SIRT6 | IMENT | Colorectum | FAP | CDHR5,INF2,C1QTNF12, etc. | 1.63e-01 |  |
| SIRT6 | INCAF | Colorectum | AD | ZNF335,ESRRA,STK32A, etc. | 2.92e-01 |  |
| SIRT6 | NK | Liver | Healthy | CLECL1,QTRT1,KLHDC3, etc. | 6.03e-03 |  |
| SIRT6 | BN | Liver | NAFLD | CLECL1,QTRT1,KLHDC3, etc. | 1.56e-01 |  |
| SIRT6 | HSC | Liver | Healthy | SIGLEC7,LY6E,RP13-143G15.4, etc. | 9.24e-03 | |
| ∗The dot plots of a searched regulon are shown for all cell subpopulations in each disease state of each tissue based on the regulon specific score inferred using pySCENIC and by calculating the average expression. |
| Page: 1 2 |
Top |
Somatic mutation of malignant transformation related genes |
| Annotation of somatic variants for genes involved in malignant transformation |
| Hugo Symbol | Variant Class | Variant Classification | dbSNP RS | HGVSc | HGVSp | HGVSp Short | SWISSPROT | BIOTYPE | SIFT | PolyPhen | Tumor Sample Barcode | Tissue | Histology | Sex | Age | Stage | Therapy Types | Drugs | Outcome |
| SIRT6 | SNV | Missense_Mutation | rs540970217 | c.583C>T | p.Arg195Trp | p.R195W | Q8N6T7 | protein_coding | deleterious(0) | benign(0.344) | TCGA-BH-A203-01 | Breast | breast invasive carcinoma | Female | >=65 | I/II | Unknown | Unknown | PD |
| SIRT6 | deletion | Frame_Shift_Del | novel | c.193delN | p.Arg65GlyfsTer95 | p.R65Gfs*95 | Q8N6T7 | protein_coding | TCGA-D8-A27V-01 | Breast | breast invasive carcinoma | Female | <65 | I/II | Hormone Therapy | tamoxiphen | SD | ||
| SIRT6 | deletion | Frame_Shift_Del | c.671delN | p.Asn224ThrfsTer39 | p.N224Tfs*39 | Q8N6T7 | protein_coding | TCGA-EW-A2FV-01 | Breast | breast invasive carcinoma | Female | <65 | III/IV | Chemotherapy | docetaxel | SD | |||
| SIRT6 | SNV | Missense_Mutation | c.787N>C | p.Thr263Pro | p.T263P | Q8N6T7 | protein_coding | tolerated(0.09) | benign(0.046) | TCGA-C5-A1BF-01 | Cervix | cervical & endocervical cancer | Female | <65 | I/II | Chemotherapy | cisplatin | PD | |
| SIRT6 | SNV | Missense_Mutation | c.956N>T | p.Pro319Leu | p.P319L | Q8N6T7 | protein_coding | deleterious(0) | benign(0.133) | TCGA-AD-6964-01 | Colorectum | colon adenocarcinoma | Male | <65 | III/IV | Chemotherapy | folfox | PD | |
| SIRT6 | SNV | Missense_Mutation | c.806N>A | p.Leu269Gln | p.L269Q | Q8N6T7 | protein_coding | deleterious(0) | probably_damaging(0.997) | TCGA-CK-4951-01 | Colorectum | colon adenocarcinoma | Female | >=65 | I/II | Unknown | Unknown | PD | |
| SIRT6 | SNV | Missense_Mutation | c.94N>T | p.Arg32Trp | p.R32W | Q8N6T7 | protein_coding | deleterious(0.02) | possibly_damaging(0.466) | TCGA-WS-AB45-01 | Colorectum | colon adenocarcinoma | Female | <65 | I/II | Unknown | Unknown | SD | |
| SIRT6 | SNV | Missense_Mutation | novel | c.908N>A | p.Ser303Tyr | p.S303Y | Q8N6T7 | protein_coding | tolerated(0.05) | benign(0.085) | TCGA-A5-A1OF-01 | Endometrium | uterine corpus endometrioid carcinoma | Female | <65 | I/II | Unknown | Unknown | SD |
| SIRT6 | SNV | Missense_Mutation | novel | c.1055N>T | p.Ala352Val | p.A352V | Q8N6T7 | protein_coding | tolerated_low_confidence(0.33) | benign(0) | TCGA-AX-A0IZ-01 | Endometrium | uterine corpus endometrioid carcinoma | Female | <65 | I/II | Unknown | Unknown | SD |
| SIRT6 | SNV | Missense_Mutation | novel | c.653N>G | p.Gln218Arg | p.Q218R | Q8N6T7 | protein_coding | deleterious(0) | benign(0.327) | TCGA-BG-A222-01 | Endometrium | uterine corpus endometrioid carcinoma | Female | <65 | I/II | Unknown | Unknown | SD |
| Page: 1 2 3 |
Top |
Related drugs of malignant transformation related genes |
| Identification of chemicals and drugs interact with genes involved in malignant transfromation |
| (DGIdb 4.0) |
| Entrez ID | Symbol | Category | Interaction Types | Drug Claim Name | Drug Name | PMIDs |
| 51548 | SIRT6 | TRANSCRIPTION FACTOR, ENZYME | inhibitor | 252827474 | ||
| 51548 | SIRT6 | TRANSCRIPTION FACTOR, ENZYME | allosteric modulator | 381118833 |
| Page: 1 |

Copyright 2023-Present -The University of Texas Health Science Center at Houston |