
|
|||||
|
 | |
| |
| |
| |
| |
| |
|
Gene: SIPA1L1 |
Gene summary for SIPA1L1 |
| Gene information | Species | Human | Gene symbol | SIPA1L1 | Gene ID | 26037 |
| Gene name | signal induced proliferation associated 1 like 1 | |
| Gene Alias | E6TP1 | |
| Cytomap | 14q24.2 | |
| Gene Type | protein-coding | GO ID | GO:0000902 | UniProtAcc | O43166 |
Top |
Malignant transformation analysis |
| Identification of the aberrant gene expression in precancerous and cancerous lesions by comparing the gene expression of stem-like cells in diseased tissues with normal stem cells |
| Entrez ID | Symbol | Replicates | Species | Organ | Tissue | Adj P-value | Log2FC | Malignancy |
| 26037 | SIPA1L1 | CCI_1 | Human | Cervix | CC | 4.61e-11 | 1.32e+00 | 0.528 |
| 26037 | SIPA1L1 | CCI_2 | Human | Cervix | CC | 1.07e-09 | 1.30e+00 | 0.5249 |
| 26037 | SIPA1L1 | CCI_3 | Human | Cervix | CC | 4.25e-15 | 1.14e+00 | 0.516 |
| 26037 | SIPA1L1 | HTA11_3410_2000001011 | Human | Colorectum | AD | 5.41e-19 | -5.41e-01 | 0.0155 |
| 26037 | SIPA1L1 | HTA11_2951_2000001011 | Human | Colorectum | AD | 5.76e-03 | -7.52e-01 | 0.0216 |
| 26037 | SIPA1L1 | HTA11_347_2000001011 | Human | Colorectum | AD | 1.67e-06 | 4.93e-01 | -0.1954 |
| 26037 | SIPA1L1 | HTA11_5216_2000001011 | Human | Colorectum | SER | 1.26e-05 | -4.97e-01 | -0.1462 |
| 26037 | SIPA1L1 | HTA11_11156_2000001011 | Human | Colorectum | AD | 5.40e-04 | -9.24e-01 | 0.0397 |
| 26037 | SIPA1L1 | HTA11_99999965062_69753 | Human | Colorectum | MSI-H | 2.95e-07 | 9.19e-01 | 0.3487 |
| 26037 | SIPA1L1 | HTA11_99999971662_82457 | Human | Colorectum | MSS | 1.31e-18 | -6.61e-01 | 0.3859 |
| 26037 | SIPA1L1 | HTA11_99999974143_84620 | Human | Colorectum | MSS | 6.13e-25 | -7.23e-01 | 0.3005 |
| 26037 | SIPA1L1 | F007 | Human | Colorectum | FAP | 1.44e-02 | -1.27e-01 | 0.1176 |
| 26037 | SIPA1L1 | A001-C-207 | Human | Colorectum | FAP | 5.09e-05 | -4.33e-01 | 0.1278 |
| 26037 | SIPA1L1 | A015-C-203 | Human | Colorectum | FAP | 1.51e-32 | -5.32e-01 | -0.1294 |
| 26037 | SIPA1L1 | A015-C-204 | Human | Colorectum | FAP | 4.20e-04 | -2.77e-01 | -0.0228 |
| 26037 | SIPA1L1 | A014-C-040 | Human | Colorectum | FAP | 2.87e-04 | -3.79e-01 | -0.1184 |
| 26037 | SIPA1L1 | A002-C-201 | Human | Colorectum | FAP | 2.52e-16 | -4.07e-01 | 0.0324 |
| 26037 | SIPA1L1 | A001-C-119 | Human | Colorectum | FAP | 1.12e-07 | -4.22e-01 | -0.1557 |
| 26037 | SIPA1L1 | A001-C-108 | Human | Colorectum | FAP | 1.23e-21 | -4.92e-01 | -0.0272 |
| 26037 | SIPA1L1 | A002-C-205 | Human | Colorectum | FAP | 2.85e-31 | -5.93e-01 | -0.1236 |
| Page: 1 2 3 4 5 6 7 8 9 10 11 |
| Tissue | Expression Dynamics | Abbreviation |
| Cervix |  | CC: Cervix cancer |
| HSIL_HPV: HPV-infected high-grade squamous intraepithelial lesions | ||
| N_HPV: HPV-infected normal cervix | ||
| Colorectum (GSE201348) |  | FAP: Familial adenomatous polyposis |
| CRC: Colorectal cancer | ||
| Colorectum (HTA11) |  | AD: Adenomas |
| SER: Sessile serrated lesions | ||
| MSI-H: Microsatellite-high colorectal cancer | ||
| MSS: Microsatellite stable colorectal cancer | ||
| Endometrium |  | AEH: Atypical endometrial hyperplasia |
| EEC: Endometrioid Cancer | ||
| Esophagus | 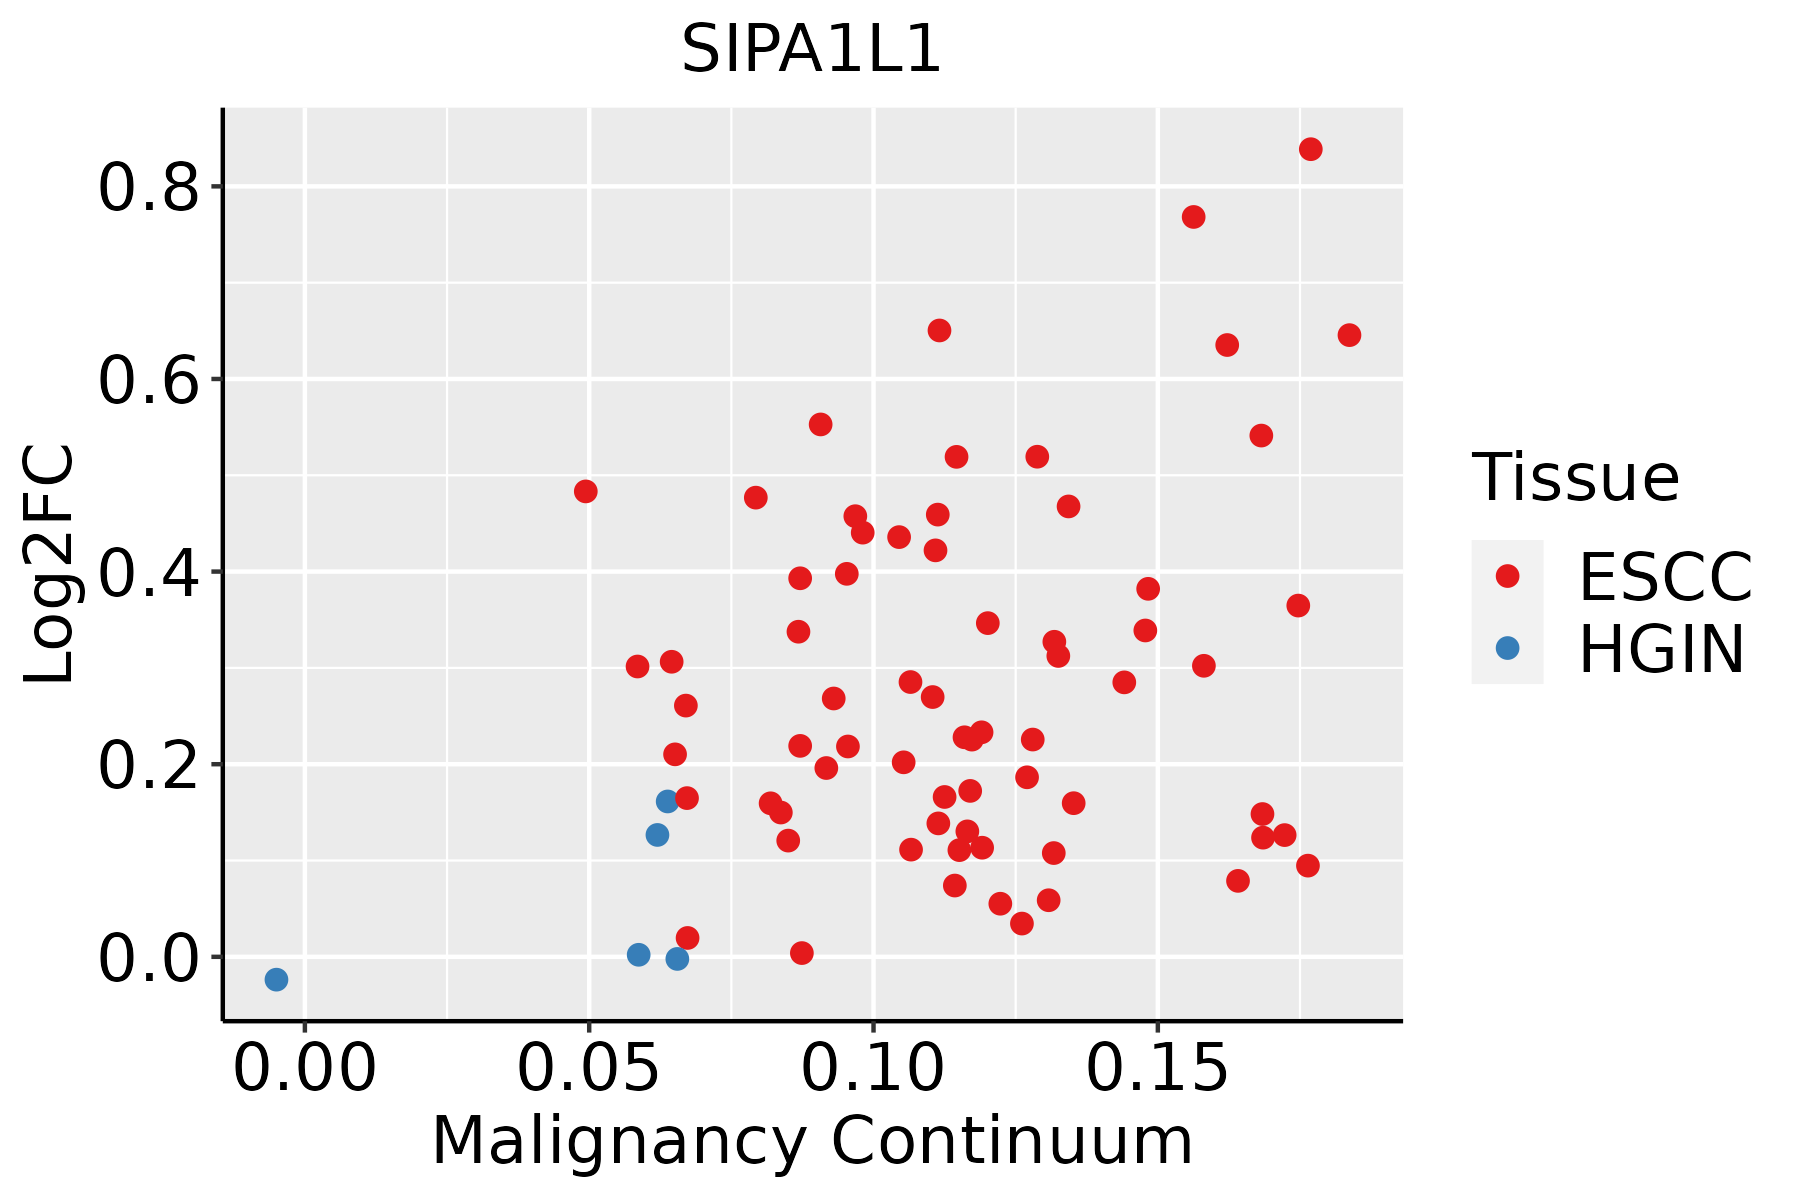 | ESCC: Esophageal squamous cell carcinoma |
| HGIN: High-grade intraepithelial neoplasias | ||
| LGIN: Low-grade intraepithelial neoplasias | ||
| GC | 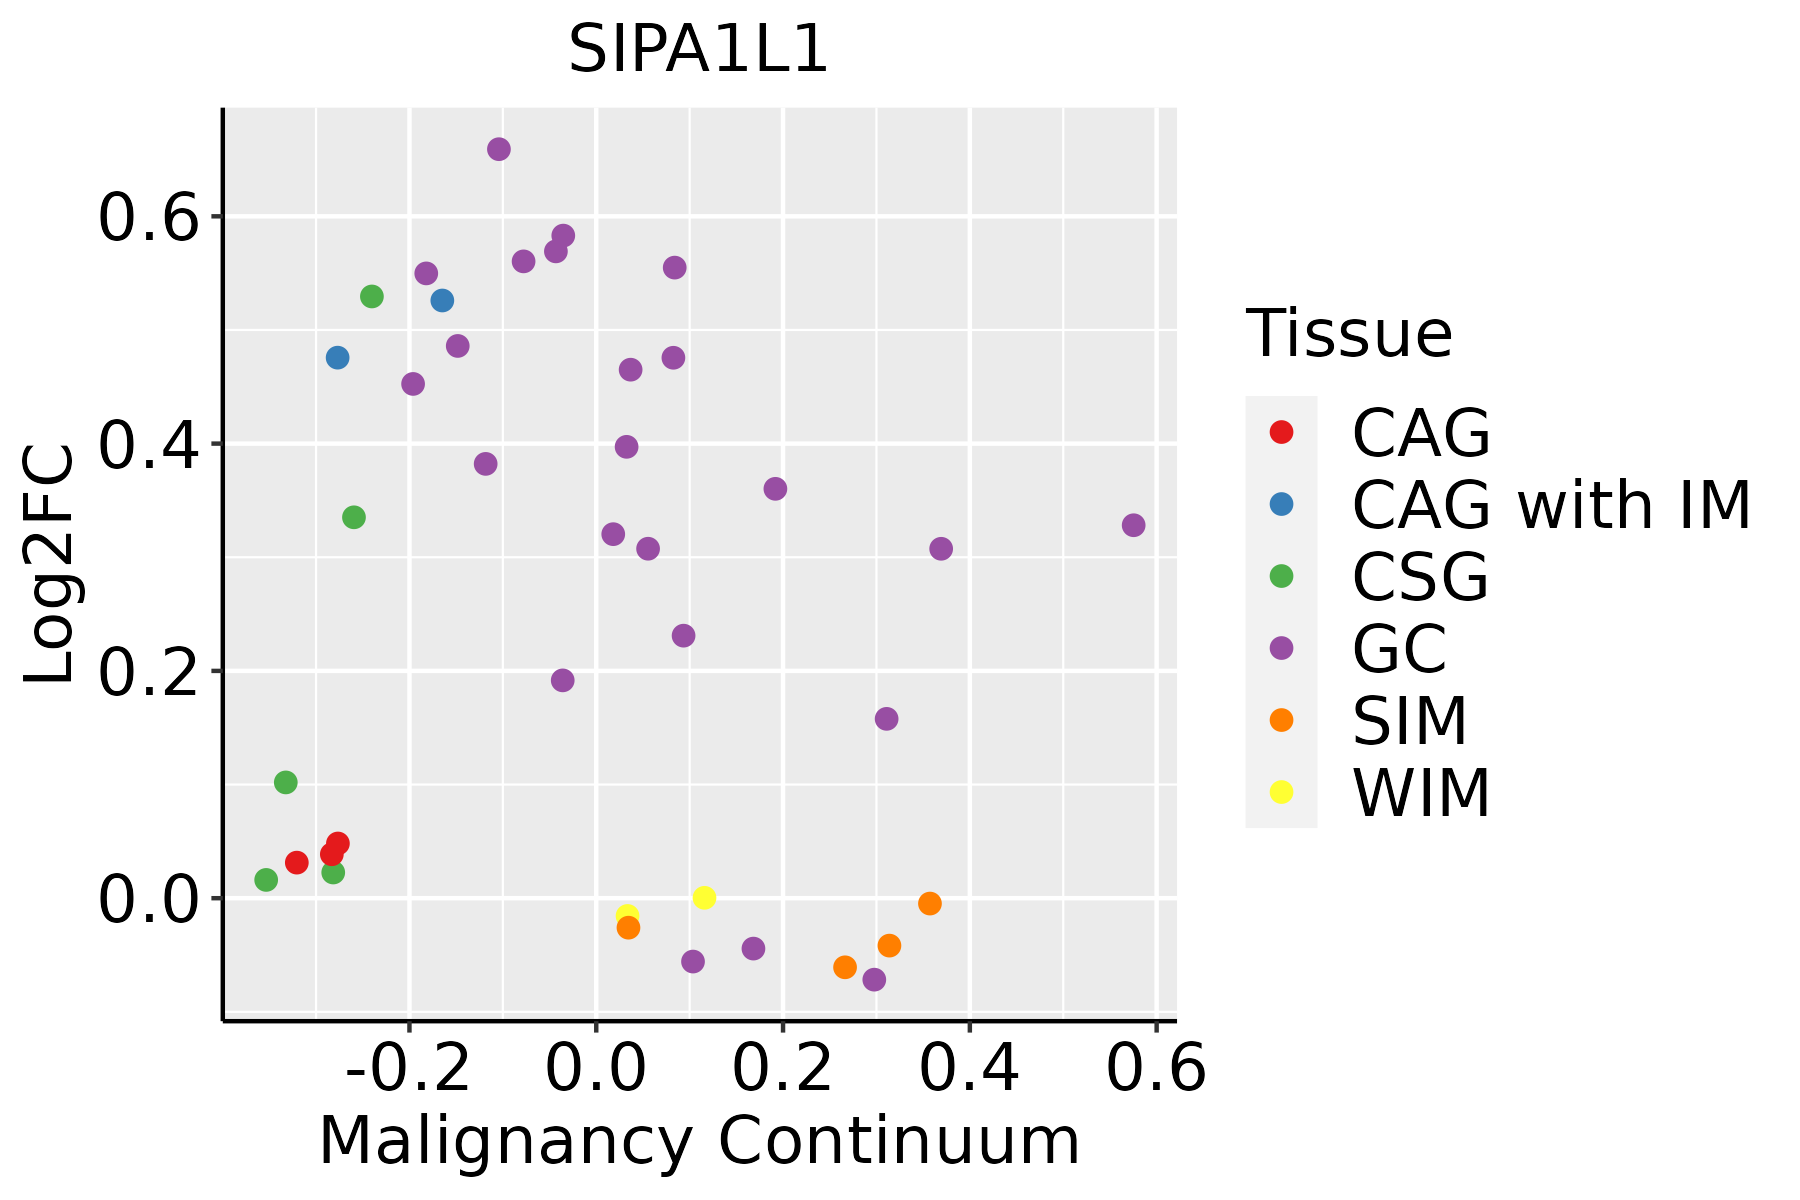 | CAG: Chronic atrophic gastritis |
| CAG with IM: Chronic atrophic gastritis with intestinal metaplasia | ||
| CSG: Chronic superficial gastritis | ||
| GC: Gastric cancer | ||
| SIM: Severe intestinal metaplasia | ||
| WIM: Wild intestinal metaplasia | ||
| Liver | 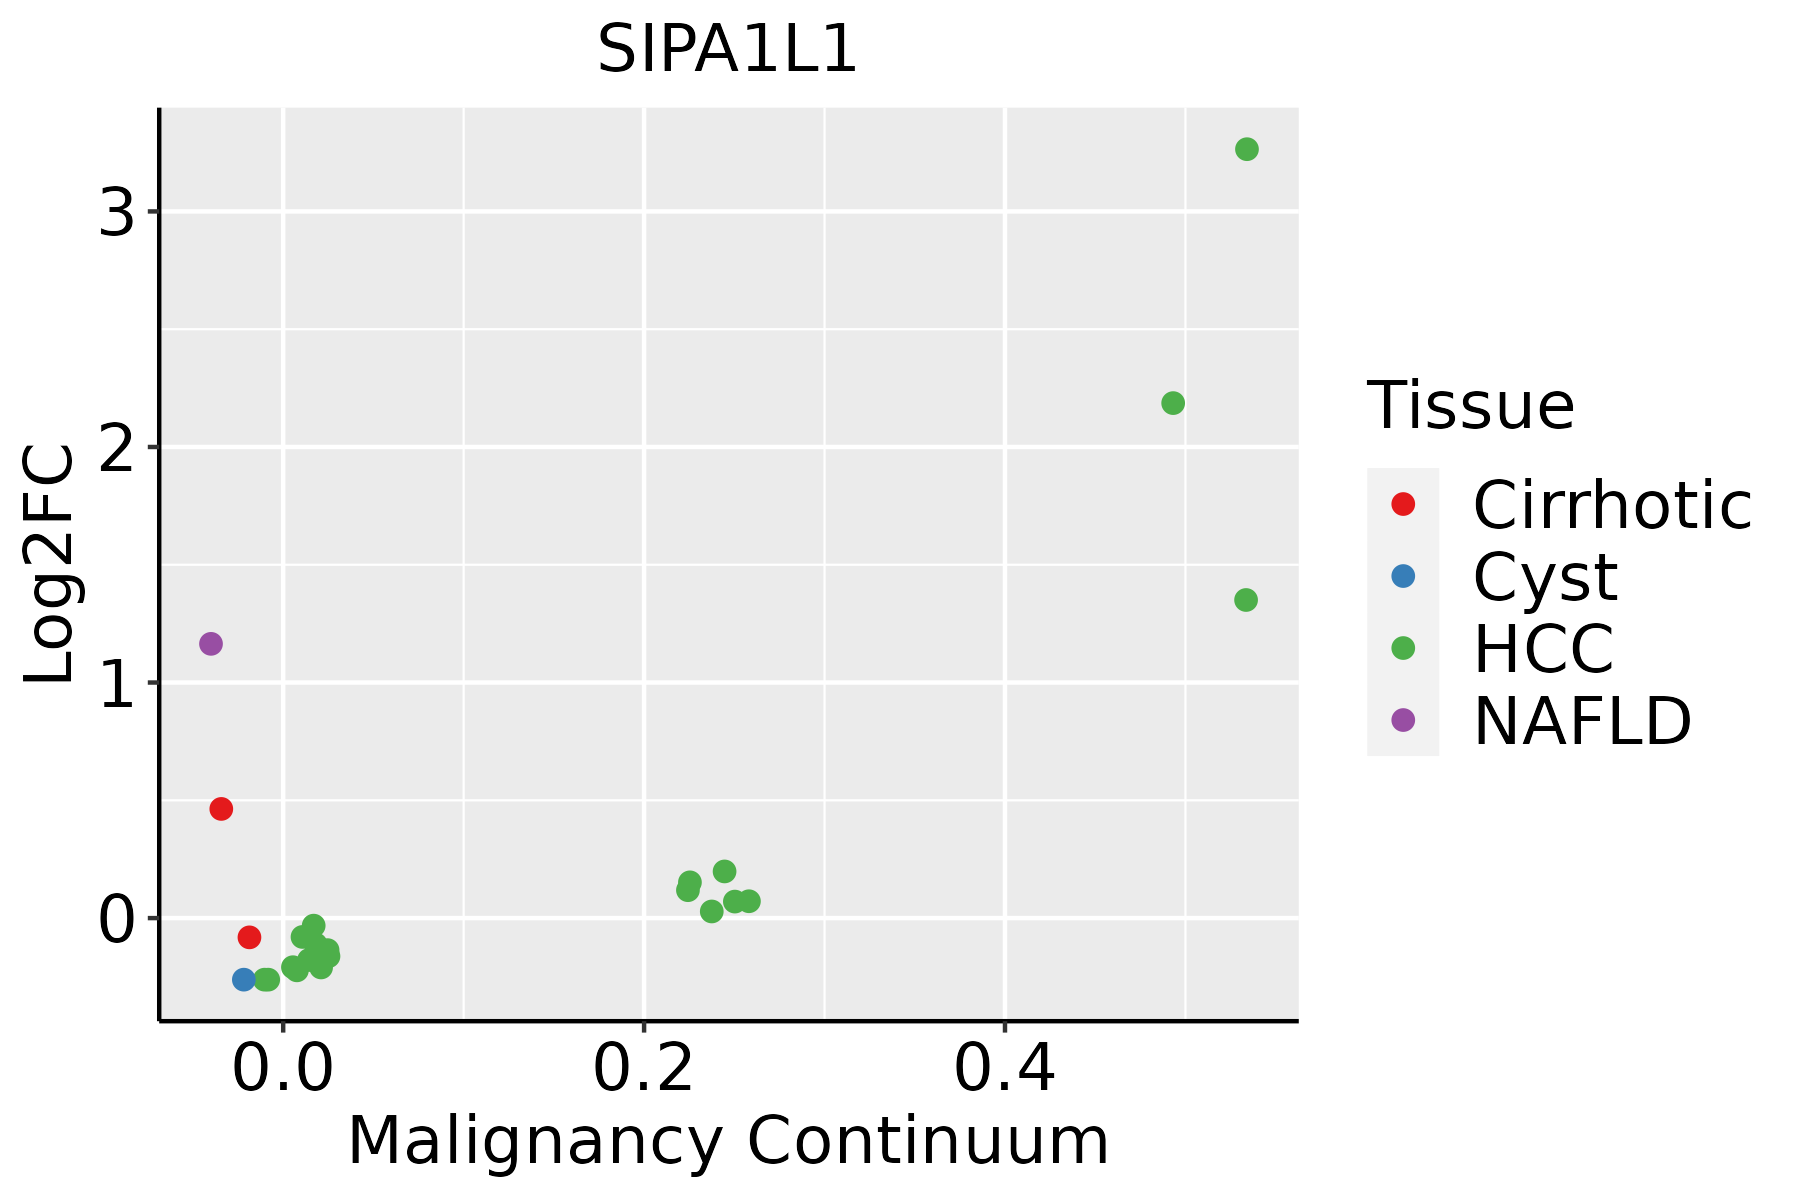 | HCC: Hepatocellular carcinoma |
| NAFLD: Non-alcoholic fatty liver disease | ||
| Lung | 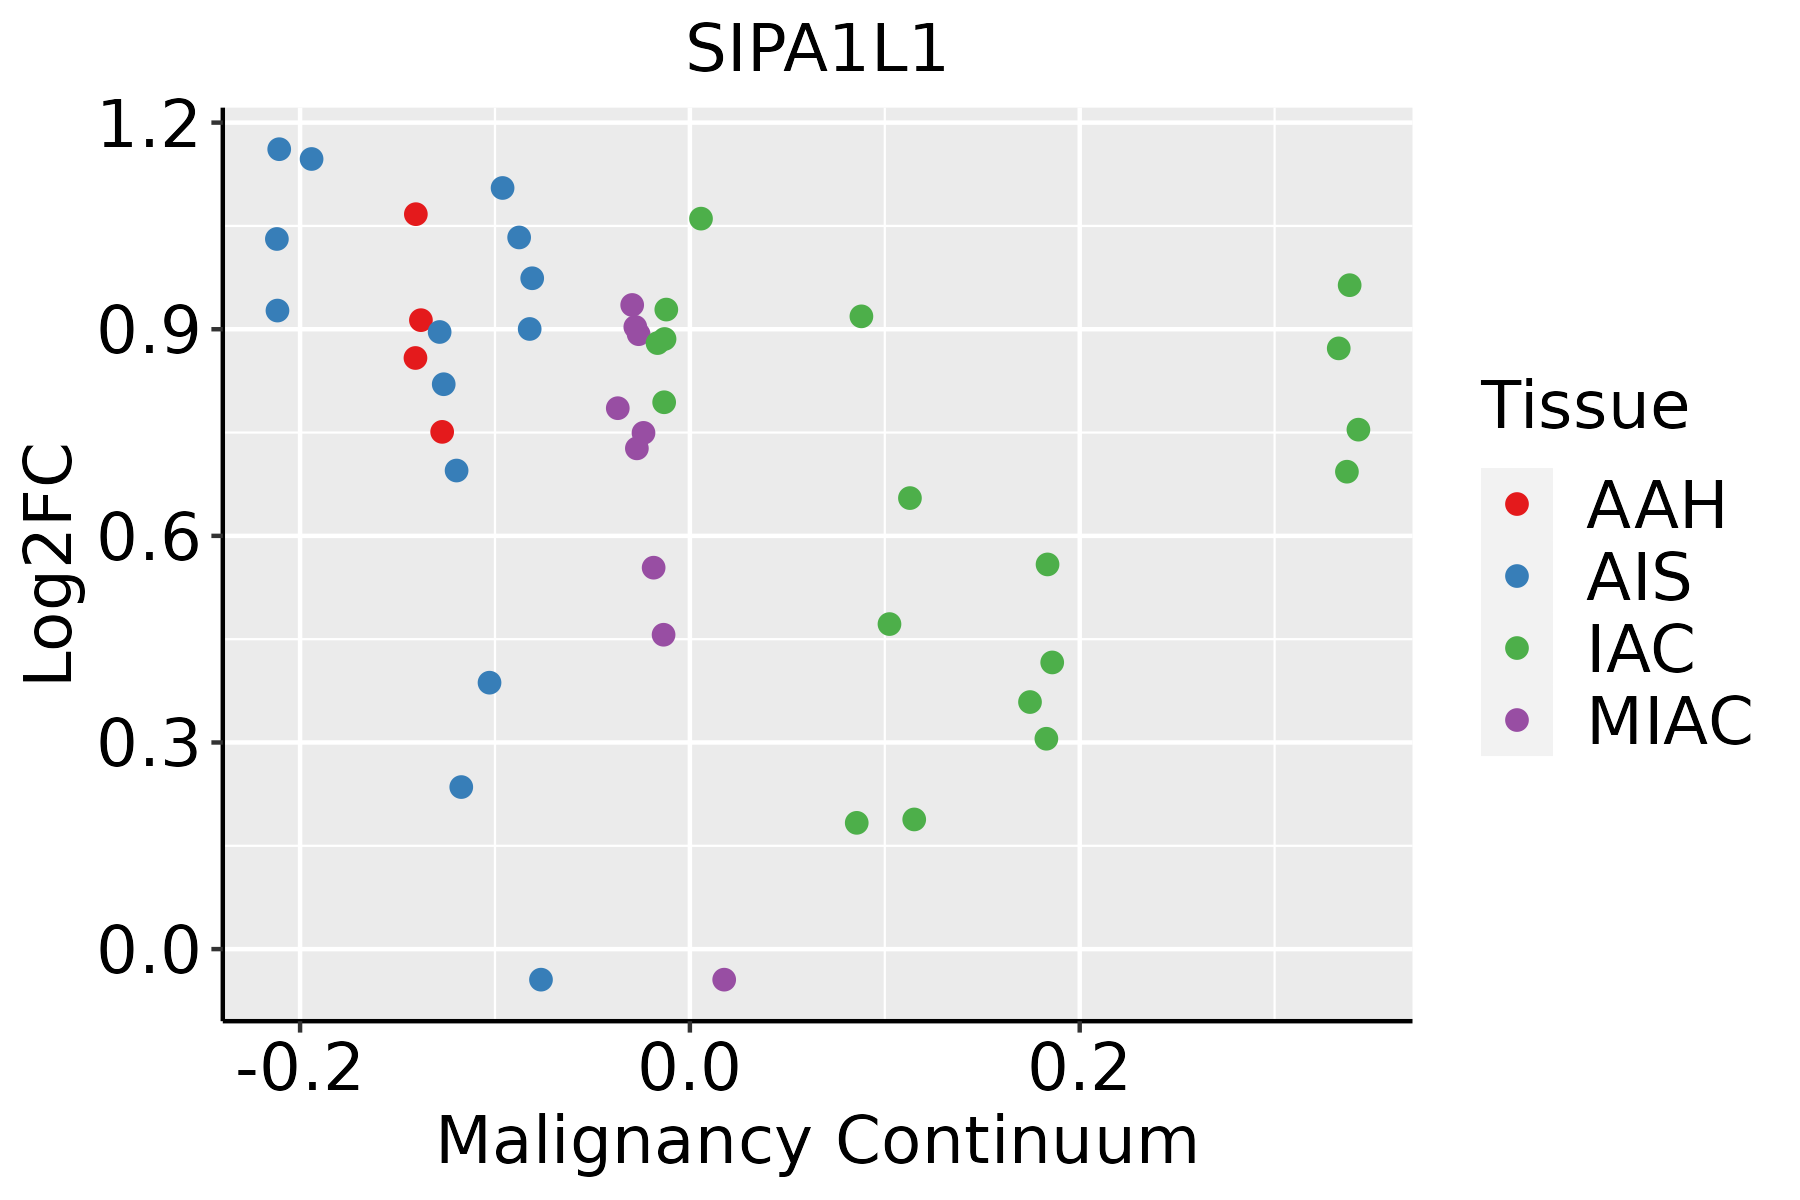 | AAH: Atypical adenomatous hyperplasia |
| AIS: Adenocarcinoma in situ | ||
| IAC: Invasive lung adenocarcinoma | ||
| MIA: Minimally invasive adenocarcinoma | ||
| Prostate | 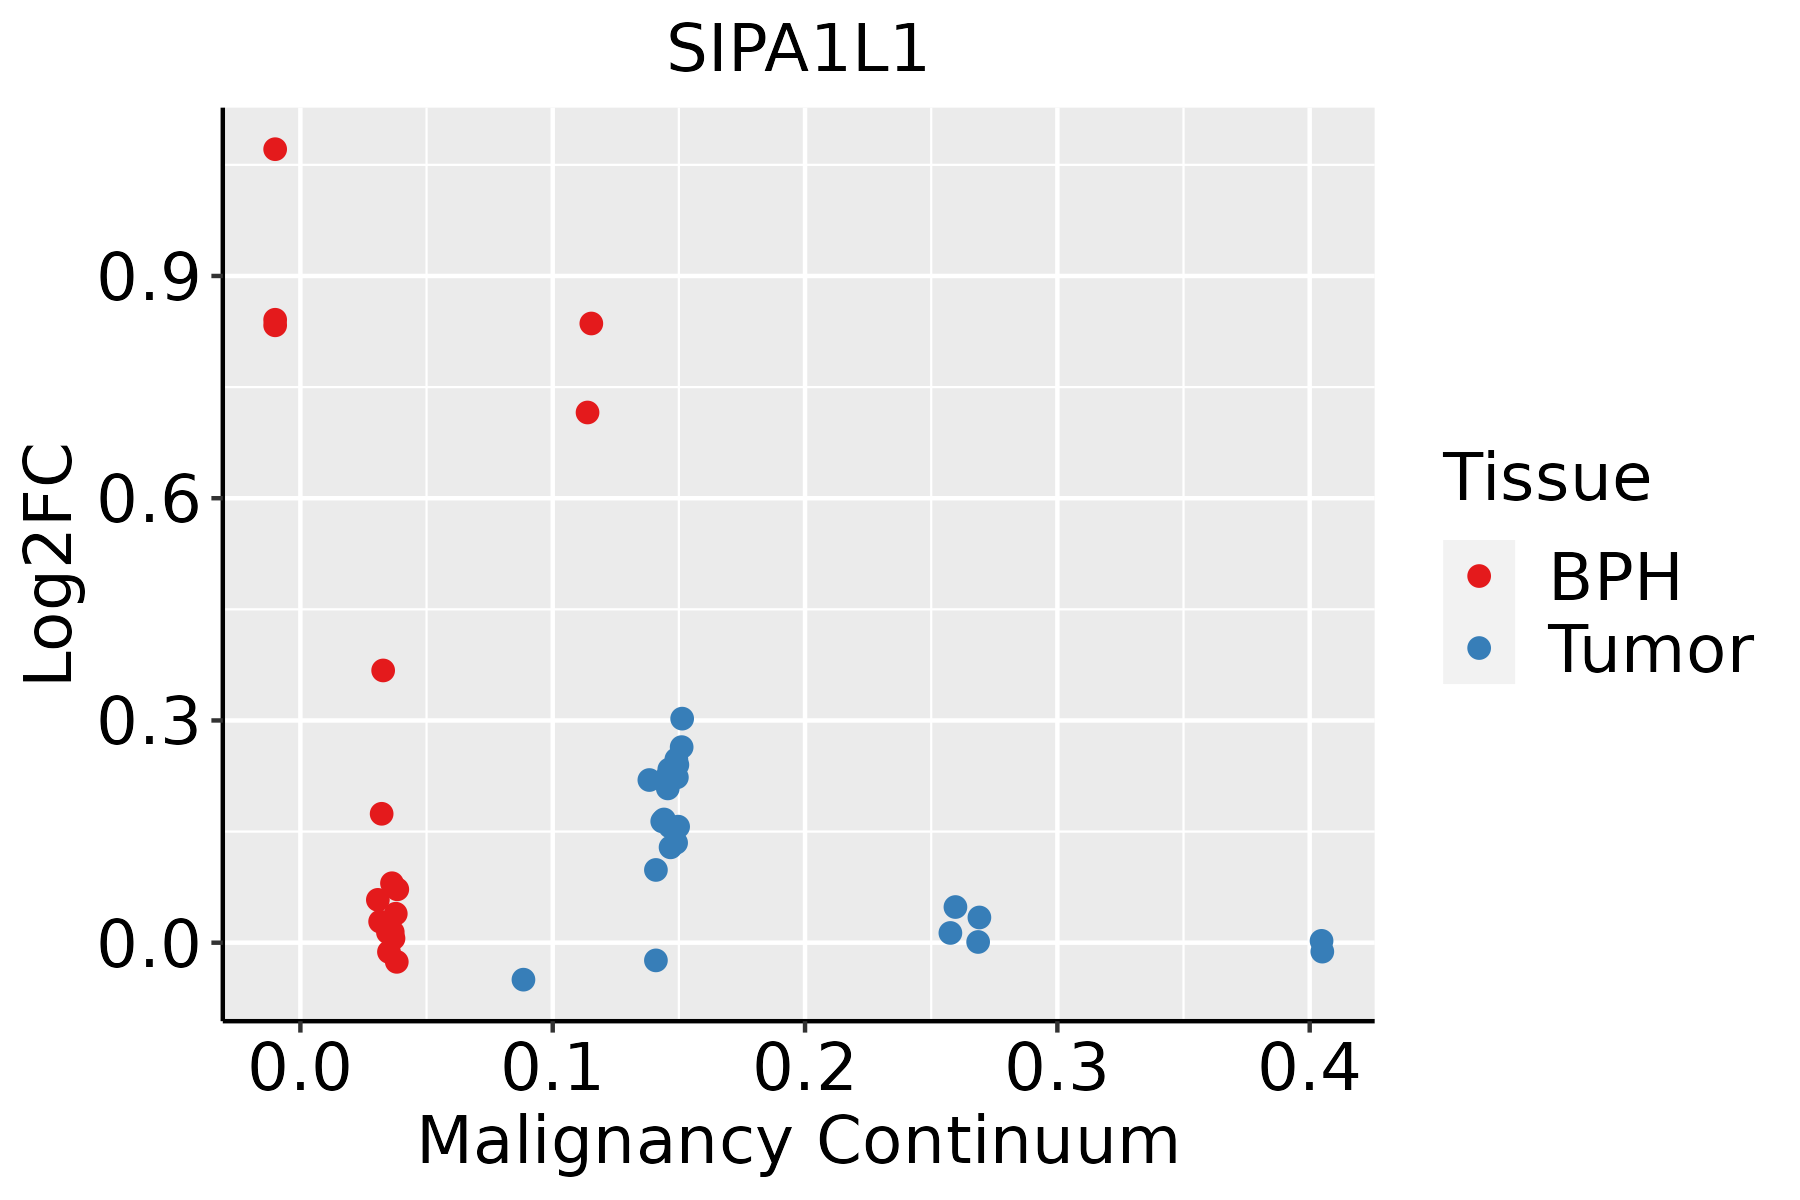 | BPH: Benign Prostatic Hyperplasia |
| Skin |  | AK: Actinic keratosis |
| cSCC: Cutaneous squamous cell carcinoma | ||
| SCCIS:squamous cell carcinoma in situ | ||
| Thyroid | 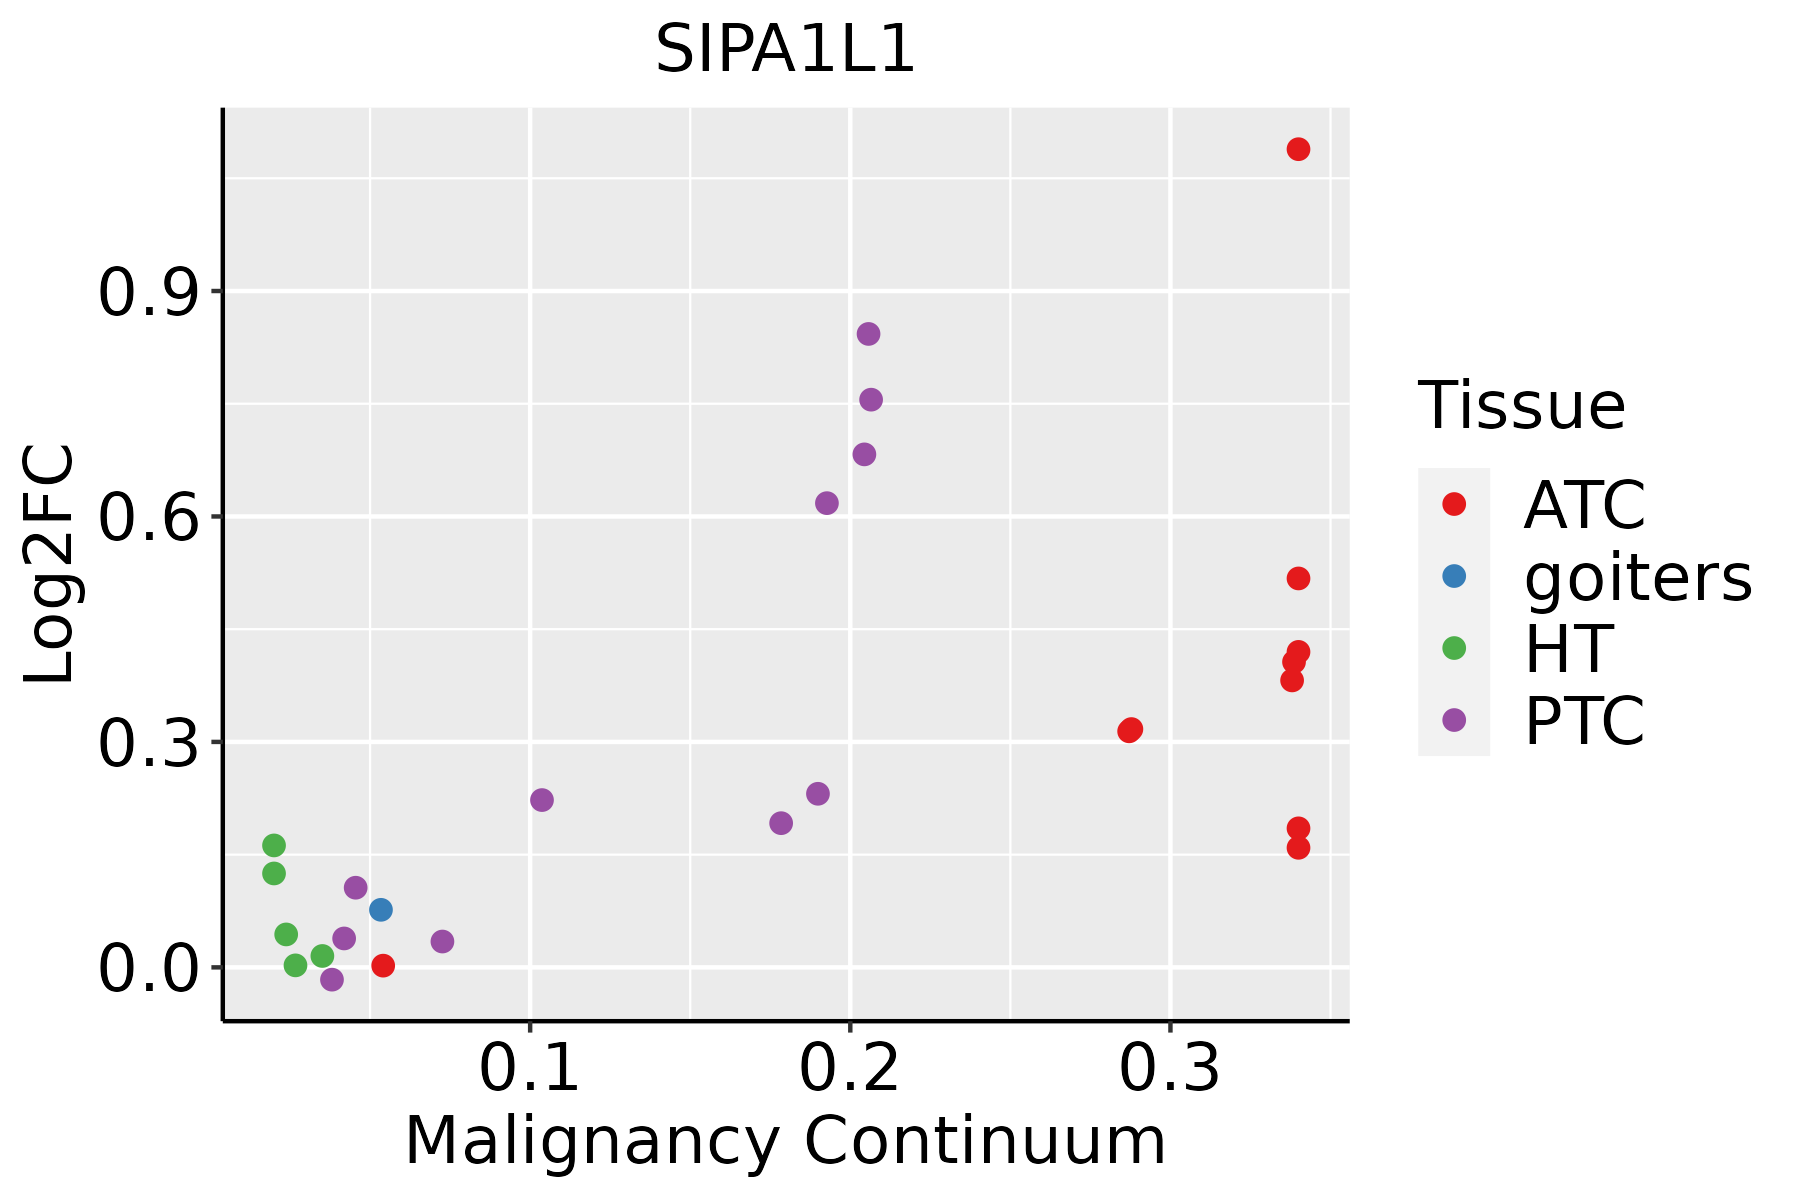 | ATC: Anaplastic thyroid cancer |
| HT: Hashimoto's thyroiditis | ||
| PTC: Papillary thyroid cancer |
| ∗log2FC in expression of this searched gene in stem-like cells from each diseased tissue sample relative to stem-like cells in normal samples in each tissue plotted against the malignancy continuum. Samples are colored based on if they are from different disease stage. |
Top |
Malignant transformation related pathway analysis |
| Find out the enriched GO biological processes and KEGG pathways involved in transition from healthy to precancer to cancer |
| Tissue | Disease Stage | Enriched GO biological Processes |
| Colorectum | AD |  |
| Colorectum | SER |  |
| Colorectum | MSS |  |
| Colorectum | MSI-H |  |
| Colorectum | FAP |  |
| ∗Top 15 enriched GO BP terms are showed in the bar plot of each disease state in each tissue. Each row represents a significant GO biological process which is colored according to the -log10(p.adjust). |
| Page: 1 2 3 4 5 6 7 8 9 |
| GO ID | Tissue | Disease Stage | Description | Gene Ratio | Bg Ratio | pvalue | p.adjust | Count |
| GO:00615641 | Colorectum | SER | axon development | 94/2897 | 467/18723 | 3.78e-03 | 3.13e-02 | 94 |
| GO:0060996 | Colorectum | SER | dendritic spine development | 26/2897 | 99/18723 | 3.83e-03 | 3.17e-02 | 26 |
| GO:00074091 | Colorectum | SER | axonogenesis | 84/2897 | 418/18723 | 6.20e-03 | 4.49e-02 | 84 |
| GO:00508081 | Colorectum | SER | synapse organization | 85/2897 | 426/18723 | 7.17e-03 | 4.99e-02 | 85 |
| GO:00430872 | Colorectum | MSS | regulation of GTPase activity | 101/3467 | 348/18723 | 1.00e-06 | 3.46e-05 | 101 |
| GO:00315322 | Colorectum | MSS | actin cytoskeleton reorganization | 41/3467 | 107/18723 | 1.21e-06 | 4.06e-05 | 41 |
| GO:01060272 | Colorectum | MSS | neuron projection organization | 34/3467 | 93/18723 | 3.04e-05 | 6.14e-04 | 34 |
| GO:00109752 | Colorectum | MSS | regulation of neuron projection development | 115/3467 | 445/18723 | 6.91e-05 | 1.20e-03 | 115 |
| GO:00510561 | Colorectum | MSS | regulation of small GTPase mediated signal transduction | 82/3467 | 302/18723 | 1.31e-04 | 1.99e-03 | 82 |
| GO:00970612 | Colorectum | MSS | dendritic spine organization | 29/3467 | 84/18723 | 3.54e-04 | 4.50e-03 | 29 |
| GO:00074092 | Colorectum | MSS | axonogenesis | 105/3467 | 418/18723 | 4.32e-04 | 5.23e-03 | 105 |
| GO:00615642 | Colorectum | MSS | axon development | 115/3467 | 467/18723 | 5.33e-04 | 6.00e-03 | 115 |
| GO:00435471 | Colorectum | MSS | positive regulation of GTPase activity | 68/3467 | 255/18723 | 7.97e-04 | 8.38e-03 | 68 |
| GO:00991732 | Colorectum | MSS | postsynapse organization | 48/3467 | 168/18723 | 9.32e-04 | 9.44e-03 | 48 |
| GO:00163582 | Colorectum | MSS | dendrite development | 65/3467 | 243/18723 | 9.41e-04 | 9.50e-03 | 65 |
| GO:00507701 | Colorectum | MSS | regulation of axonogenesis | 43/3467 | 154/18723 | 2.69e-03 | 2.12e-02 | 43 |
| GO:00508082 | Colorectum | MSS | synapse organization | 101/3467 | 426/18723 | 3.96e-03 | 2.89e-02 | 101 |
| GO:0048013 | Colorectum | MSS | ephrin receptor signaling pathway | 17/3467 | 51/18723 | 8.28e-03 | 4.99e-02 | 17 |
| GO:00510562 | Colorectum | FAP | regulation of small GTPase mediated signal transduction | 78/2622 | 302/18723 | 3.25e-08 | 2.85e-06 | 78 |
| GO:00430873 | Colorectum | FAP | regulation of GTPase activity | 85/2622 | 348/18723 | 1.20e-07 | 7.68e-06 | 85 |
| Page: 1 2 3 4 5 6 7 8 9 10 11 12 13 14 15 16 |
| Pathway ID | Tissue | Disease Stage | Description | Gene Ratio | Bg Ratio | pvalue | p.adjust | qvalue | Count |
| hsa0401512 | Cervix | CC | Rap1 signaling pathway | 56/1267 | 210/8465 | 6.23e-06 | 5.61e-05 | 3.32e-05 | 56 |
| hsa0401513 | Cervix | CC | Rap1 signaling pathway | 56/1267 | 210/8465 | 6.23e-06 | 5.61e-05 | 3.32e-05 | 56 |
| hsa04015 | Colorectum | AD | Rap1 signaling pathway | 71/2092 | 210/8465 | 1.72e-03 | 9.68e-03 | 6.18e-03 | 71 |
| hsa040151 | Colorectum | AD | Rap1 signaling pathway | 71/2092 | 210/8465 | 1.72e-03 | 9.68e-03 | 6.18e-03 | 71 |
| hsa040152 | Colorectum | SER | Rap1 signaling pathway | 54/1580 | 210/8465 | 6.55e-03 | 3.68e-02 | 2.67e-02 | 54 |
| hsa040153 | Colorectum | SER | Rap1 signaling pathway | 54/1580 | 210/8465 | 6.55e-03 | 3.68e-02 | 2.67e-02 | 54 |
| hsa040154 | Colorectum | MSS | Rap1 signaling pathway | 66/1875 | 210/8465 | 1.03e-03 | 5.94e-03 | 3.64e-03 | 66 |
| hsa040155 | Colorectum | MSS | Rap1 signaling pathway | 66/1875 | 210/8465 | 1.03e-03 | 5.94e-03 | 3.64e-03 | 66 |
| hsa040156 | Colorectum | FAP | Rap1 signaling pathway | 53/1404 | 210/8465 | 7.93e-04 | 5.14e-03 | 3.13e-03 | 53 |
| hsa040157 | Colorectum | FAP | Rap1 signaling pathway | 53/1404 | 210/8465 | 7.93e-04 | 5.14e-03 | 3.13e-03 | 53 |
| hsa040158 | Colorectum | CRC | Rap1 signaling pathway | 48/1091 | 210/8465 | 4.00e-05 | 8.70e-04 | 5.90e-04 | 48 |
| hsa040159 | Colorectum | CRC | Rap1 signaling pathway | 48/1091 | 210/8465 | 4.00e-05 | 8.70e-04 | 5.90e-04 | 48 |
| hsa0401514 | Endometrium | AEH | Rap1 signaling pathway | 49/1197 | 210/8465 | 2.03e-04 | 1.78e-03 | 1.30e-03 | 49 |
| hsa0401515 | Endometrium | AEH | Rap1 signaling pathway | 49/1197 | 210/8465 | 2.03e-04 | 1.78e-03 | 1.30e-03 | 49 |
| hsa0401522 | Endometrium | EEC | Rap1 signaling pathway | 49/1237 | 210/8465 | 4.45e-04 | 3.47e-03 | 2.59e-03 | 49 |
| hsa0401532 | Endometrium | EEC | Rap1 signaling pathway | 49/1237 | 210/8465 | 4.45e-04 | 3.47e-03 | 2.59e-03 | 49 |
| hsa0401510 | Lung | IAC | Rap1 signaling pathway | 41/1053 | 210/8465 | 2.01e-03 | 1.07e-02 | 7.10e-03 | 41 |
| hsa0401511 | Lung | IAC | Rap1 signaling pathway | 41/1053 | 210/8465 | 2.01e-03 | 1.07e-02 | 7.10e-03 | 41 |
| hsa0401521 | Lung | AIS | Rap1 signaling pathway | 41/961 | 210/8465 | 3.23e-04 | 3.38e-03 | 2.16e-03 | 41 |
| hsa0401531 | Lung | AIS | Rap1 signaling pathway | 41/961 | 210/8465 | 3.23e-04 | 3.38e-03 | 2.16e-03 | 41 |
| Page: 1 2 |
Top |
Cell-cell communication analysis |
| Identification of potential cell-cell interactions between two cell types and their ligand-receptor pairs for different disease states |
| Ligand | Receptor | LRpair | Pathway | Tissue | Disease Stage |
| Page: 1 |
Top |
Single-cell gene regulatory network inference analysis |
| Find out the significant the regulons (TFs) and the target genes of each regulon across cell types for different disease states |
| TF | Cell Type | Tissue | Disease Stage | Target Gene | RSS | Regulon Activity |
| ∗The dot plots of a searched regulon are shown for all cell subpopulations in each disease state of each tissue based on the regulon specific score inferred using pySCENIC and by calculating the average expression. |
| Page: 1 |
Top |
Somatic mutation of malignant transformation related genes |
| Annotation of somatic variants for genes involved in malignant transformation |
| Hugo Symbol | Variant Class | Variant Classification | dbSNP RS | HGVSc | HGVSp | HGVSp Short | SWISSPROT | BIOTYPE | SIFT | PolyPhen | Tumor Sample Barcode | Tissue | Histology | Sex | Age | Stage | Therapy Types | Drugs | Outcome |
| SIPA1L1 | SNV | Missense_Mutation | c.596G>C | p.Gly199Ala | p.G199A | O43166 | protein_coding | tolerated(0.28) | probably_damaging(0.995) | TCGA-A8-A09A-01 | Breast | breast invasive carcinoma | Female | <65 | I/II | Hormone Therapy | tamoxiphen | SD | |
| SIPA1L1 | SNV | Missense_Mutation | c.3518A>G | p.Glu1173Gly | p.E1173G | O43166 | protein_coding | deleterious(0) | benign(0.077) | TCGA-A8-A09Z-01 | Breast | breast invasive carcinoma | Female | >=65 | I/II | Unknown | Unknown | SD | |
| SIPA1L1 | SNV | Missense_Mutation | rs371174898 | c.1342N>C | p.Glu448Gln | p.E448Q | O43166 | protein_coding | deleterious(0.02) | benign(0.373) | TCGA-AC-A5EH-01 | Breast | breast invasive carcinoma | Female | >=65 | I/II | Unknown | Unknown | SD |
| SIPA1L1 | SNV | Missense_Mutation | novel | c.1310N>T | p.Gly437Val | p.G437V | O43166 | protein_coding | tolerated(0.06) | possibly_damaging(0.527) | TCGA-AC-A8OR-01 | Breast | breast invasive carcinoma | Female | >=65 | I/II | Unknown | Unknown | SD |
| SIPA1L1 | SNV | Missense_Mutation | rs759169137 | c.4673N>C | p.Phe1558Ser | p.F1558S | O43166 | protein_coding | tolerated(0.39) | benign(0.042) | TCGA-AN-A046-01 | Breast | breast invasive carcinoma | Female | >=65 | I/II | Unknown | Unknown | SD |
| SIPA1L1 | SNV | Missense_Mutation | c.1102N>T | p.Val368Leu | p.V368L | O43166 | protein_coding | deleterious(0.02) | benign(0.103) | TCGA-AN-A049-01 | Breast | breast invasive carcinoma | Female | <65 | I/II | Unknown | Unknown | SD | |
| SIPA1L1 | SNV | Missense_Mutation | c.2846N>A | p.Cys949Tyr | p.C949Y | O43166 | protein_coding | deleterious(0) | probably_damaging(0.986) | TCGA-AO-A0J9-01 | Breast | breast invasive carcinoma | Female | <65 | III/IV | Chemotherapy | cyclophosphamide | PD | |
| SIPA1L1 | SNV | Missense_Mutation | c.2060C>G | p.Ser687Cys | p.S687C | O43166 | protein_coding | deleterious(0.01) | probably_damaging(0.997) | TCGA-AR-A0TZ-01 | Breast | breast invasive carcinoma | Female | <65 | III/IV | Unspecific | Doxorubicin | PD | |
| SIPA1L1 | SNV | Missense_Mutation | rs771656202 | c.3934N>A | p.Glu1312Lys | p.E1312K | O43166 | protein_coding | deleterious(0.01) | benign(0.291) | TCGA-BH-A0B8-01 | Breast | breast invasive carcinoma | Female | <65 | I/II | Hormone Therapy | arimidex | SD |
| SIPA1L1 | SNV | Missense_Mutation | c.4120N>C | p.Asp1374His | p.D1374H | O43166 | protein_coding | tolerated(0.05) | probably_damaging(0.994) | TCGA-BH-A0DZ-01 | Breast | breast invasive carcinoma | Female | <65 | I/II | Chemotherapy | docetaxel | SD |
| Page: 1 2 3 4 5 6 7 8 9 10 11 12 13 14 15 16 17 18 19 20 21 22 23 24 25 26 27 |
Top |
Related drugs of malignant transformation related genes |
| Identification of chemicals and drugs interact with genes involved in malignant transfromation |
| (DGIdb 4.0) |
| Entrez ID | Symbol | Category | Interaction Types | Drug Claim Name | Drug Name | PMIDs |
| Page: 1 |

Copyright 2023-Present -The University of Texas Health Science Center at Houston |