
|
|||||
|
 | |
| |
| |
| |
| |
| |
|
Gene: SH3PXD2B |
Gene summary for SH3PXD2B |
| Gene information | Species | Human | Gene symbol | SH3PXD2B | Gene ID | 285590 |
| Gene name | SH3 and PX domains 2B | |
| Gene Alias | FAD49 | |
| Cytomap | 5q35.1 | |
| Gene Type | protein-coding | GO ID | GO:0001501 | UniProtAcc | A1X283 |
Top |
Malignant transformation analysis |
| Identification of the aberrant gene expression in precancerous and cancerous lesions by comparing the gene expression of stem-like cells in diseased tissues with normal stem cells |
| Entrez ID | Symbol | Replicates | Species | Organ | Tissue | Adj P-value | Log2FC | Malignancy |
| 285590 | SH3PXD2B | LZE24T | Human | Esophagus | ESCC | 6.10e-04 | 4.65e-02 | 0.0596 |
| 285590 | SH3PXD2B | P1T-E | Human | Esophagus | ESCC | 4.79e-08 | 3.76e-01 | 0.0875 |
| 285590 | SH3PXD2B | P2T-E | Human | Esophagus | ESCC | 2.40e-25 | 2.47e-01 | 0.1177 |
| 285590 | SH3PXD2B | P4T-E | Human | Esophagus | ESCC | 1.89e-07 | 1.82e-01 | 0.1323 |
| 285590 | SH3PXD2B | P5T-E | Human | Esophagus | ESCC | 3.58e-18 | 3.40e-01 | 0.1327 |
| 285590 | SH3PXD2B | P8T-E | Human | Esophagus | ESCC | 3.19e-09 | 6.51e-02 | 0.0889 |
| 285590 | SH3PXD2B | P10T-E | Human | Esophagus | ESCC | 1.15e-16 | 1.12e-01 | 0.116 |
| 285590 | SH3PXD2B | P11T-E | Human | Esophagus | ESCC | 2.85e-08 | 5.16e-01 | 0.1426 |
| 285590 | SH3PXD2B | P12T-E | Human | Esophagus | ESCC | 7.34e-13 | 1.60e-01 | 0.1122 |
| 285590 | SH3PXD2B | P15T-E | Human | Esophagus | ESCC | 2.48e-12 | 1.86e-01 | 0.1149 |
| 285590 | SH3PXD2B | P16T-E | Human | Esophagus | ESCC | 1.49e-06 | 9.41e-03 | 0.1153 |
| 285590 | SH3PXD2B | P17T-E | Human | Esophagus | ESCC | 2.81e-03 | 1.81e-01 | 0.1278 |
| 285590 | SH3PXD2B | P19T-E | Human | Esophagus | ESCC | 1.93e-08 | 4.95e-01 | 0.1662 |
| 285590 | SH3PXD2B | P21T-E | Human | Esophagus | ESCC | 1.90e-18 | 3.10e-01 | 0.1617 |
| 285590 | SH3PXD2B | P22T-E | Human | Esophagus | ESCC | 8.99e-16 | 3.35e-01 | 0.1236 |
| 285590 | SH3PXD2B | P23T-E | Human | Esophagus | ESCC | 2.16e-09 | 2.47e-01 | 0.108 |
| 285590 | SH3PXD2B | P24T-E | Human | Esophagus | ESCC | 4.55e-14 | 1.36e-01 | 0.1287 |
| 285590 | SH3PXD2B | P26T-E | Human | Esophagus | ESCC | 1.30e-08 | 1.16e-01 | 0.1276 |
| 285590 | SH3PXD2B | P27T-E | Human | Esophagus | ESCC | 3.10e-19 | 2.18e-01 | 0.1055 |
| 285590 | SH3PXD2B | P28T-E | Human | Esophagus | ESCC | 2.10e-15 | 2.68e-01 | 0.1149 |
| Page: 1 2 3 4 |
| Tissue | Expression Dynamics | Abbreviation |
| Esophagus | 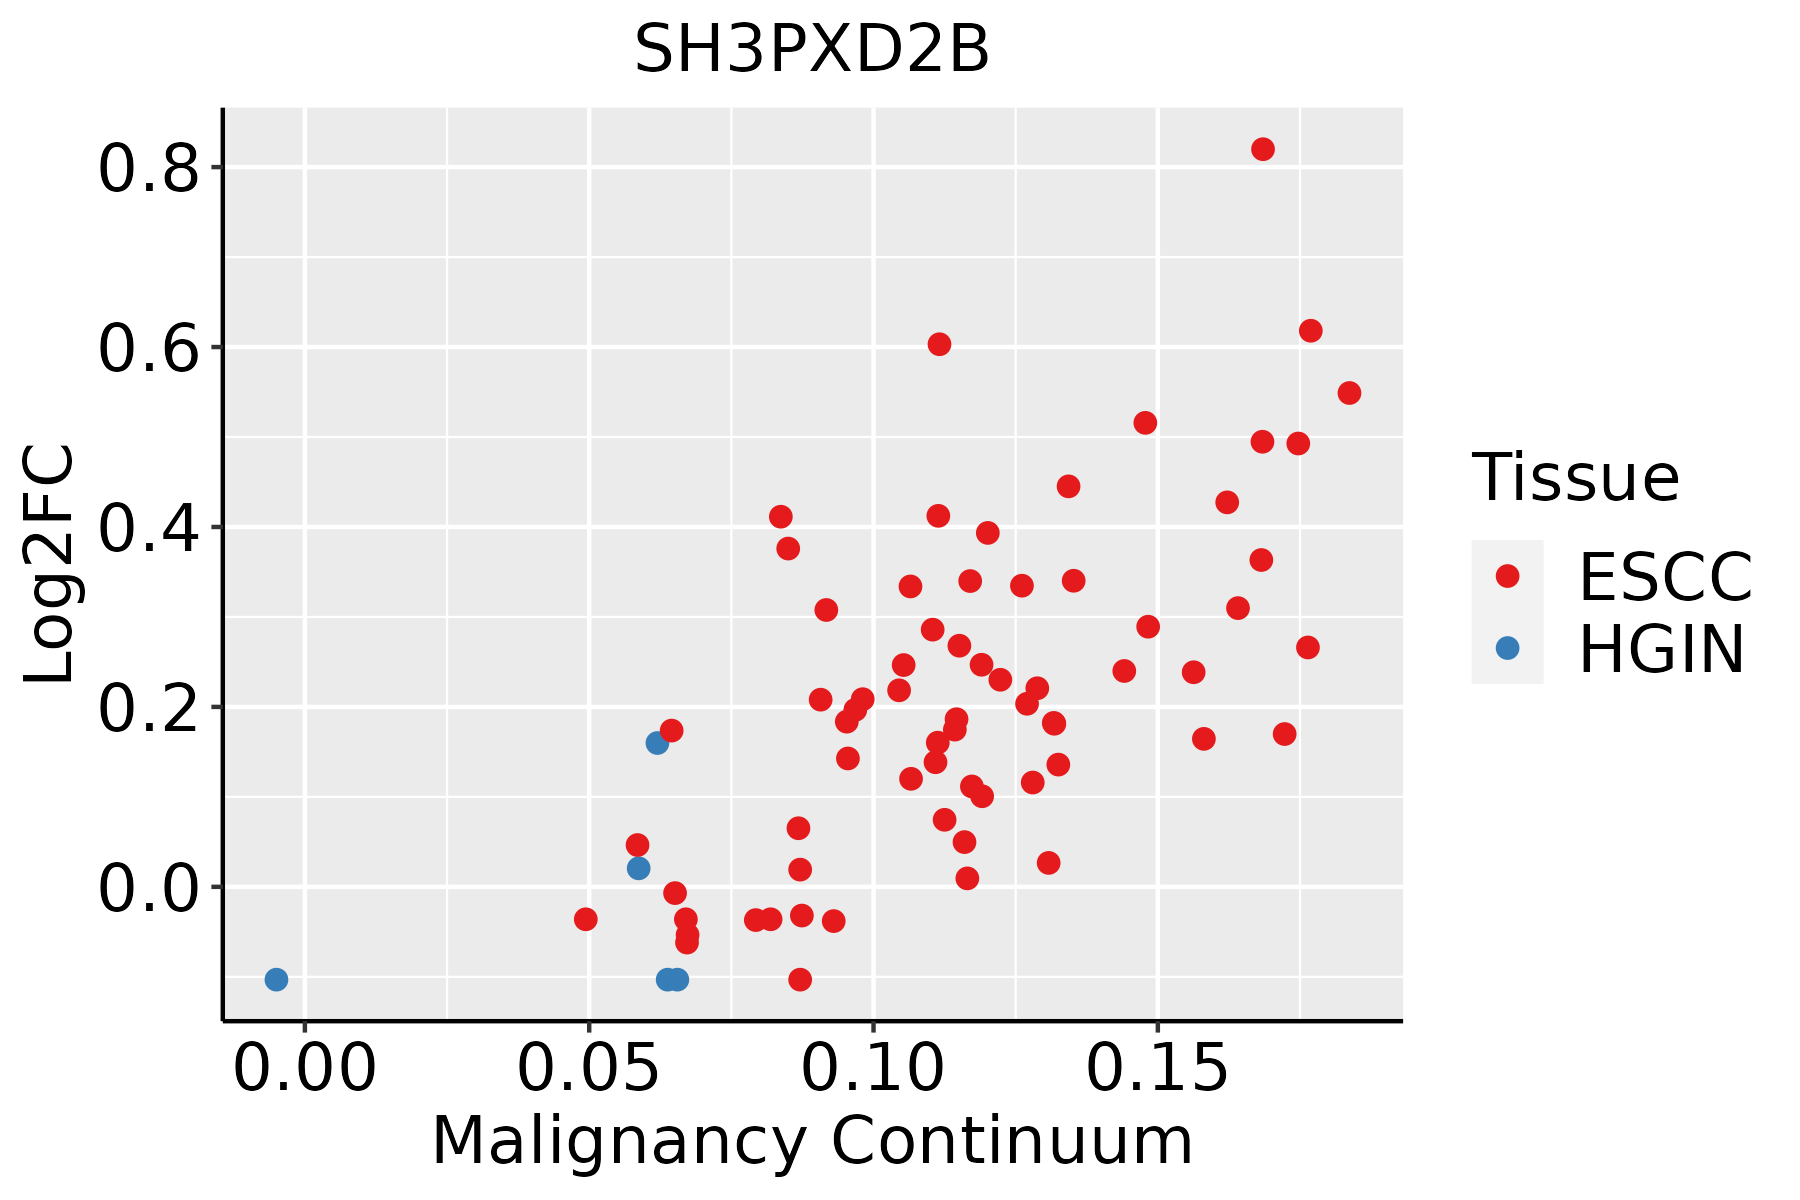 | ESCC: Esophageal squamous cell carcinoma |
| HGIN: High-grade intraepithelial neoplasias | ||
| LGIN: Low-grade intraepithelial neoplasias | ||
| Oral Cavity | 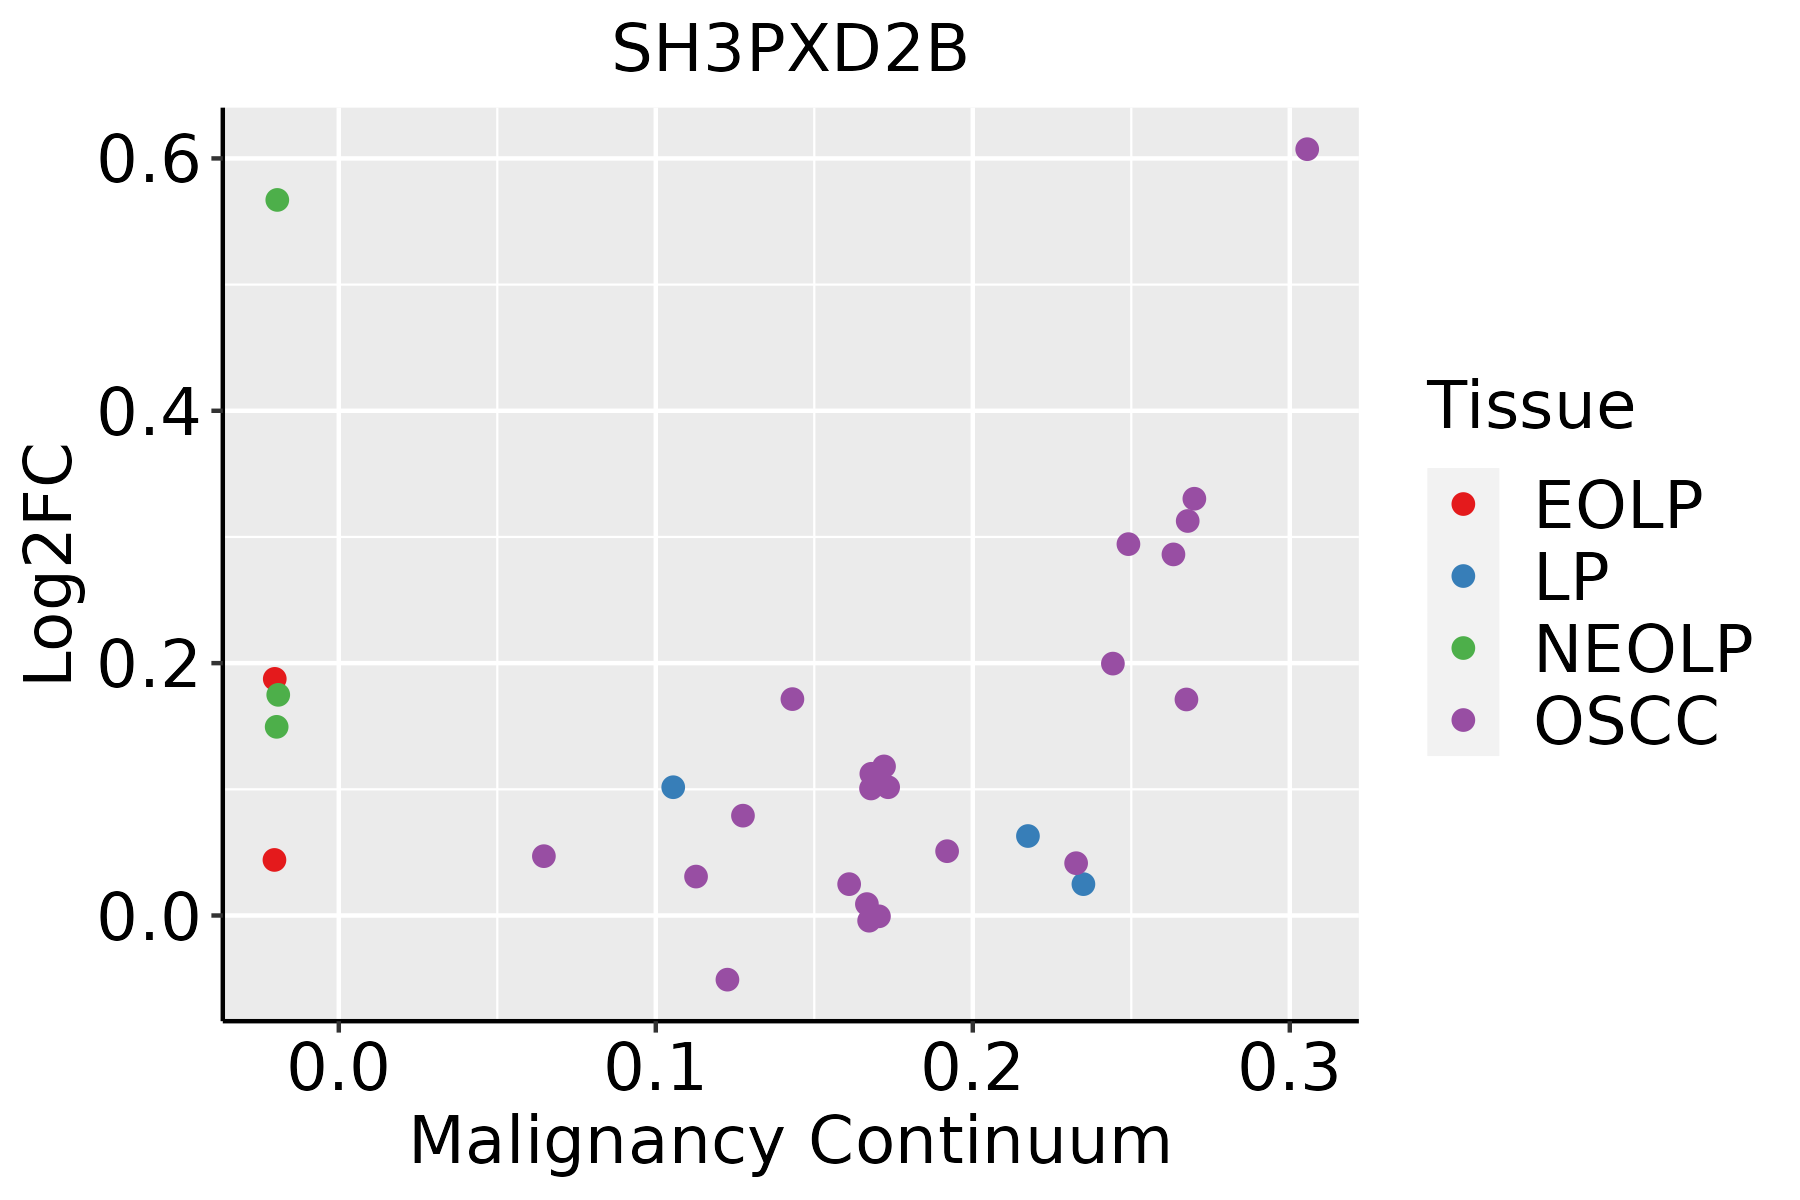 | EOLP: Erosive Oral lichen planus |
| LP: leukoplakia | ||
| NEOLP: Non-erosive oral lichen planus | ||
| OSCC: Oral squamous cell carcinoma | ||
| Thyroid |  | ATC: Anaplastic thyroid cancer |
| HT: Hashimoto's thyroiditis | ||
| PTC: Papillary thyroid cancer |
| ∗log2FC in expression of this searched gene in stem-like cells from each diseased tissue sample relative to stem-like cells in normal samples in each tissue plotted against the malignancy continuum. Samples are colored based on if they are from different disease stage. |
Top |
Malignant transformation related pathway analysis |
| Find out the enriched GO biological processes and KEGG pathways involved in transition from healthy to precancer to cancer |
| Tissue | Disease Stage | Enriched GO biological Processes |
| Colorectum | AD |  |
| Colorectum | SER |  |
| Colorectum | MSS |  |
| Colorectum | MSI-H |  |
| Colorectum | FAP |  |
| ∗Top 15 enriched GO BP terms are showed in the bar plot of each disease state in each tissue. Each row represents a significant GO biological process which is colored according to the -log10(p.adjust). |
| Page: 1 2 3 4 5 6 7 8 9 |
| GO ID | Tissue | Disease Stage | Description | Gene Ratio | Bg Ratio | pvalue | p.adjust | Count |
| GO:00452296 | Thyroid | PTC | external encapsulating structure organization | 124/5968 | 304/18723 | 5.96e-04 | 3.79e-03 | 124 |
| GO:002241124 | Thyroid | ATC | cellular component disassembly | 248/6293 | 443/18723 | 1.34e-22 | 3.69e-20 | 248 |
| GO:003019812 | Thyroid | ATC | extracellular matrix organization | 152/6293 | 301/18723 | 8.63e-10 | 2.24e-08 | 152 |
| GO:004306212 | Thyroid | ATC | extracellular structure organization | 152/6293 | 302/18723 | 1.17e-09 | 2.94e-08 | 152 |
| GO:004522912 | Thyroid | ATC | external encapsulating structure organization | 152/6293 | 304/18723 | 2.11e-09 | 5.08e-08 | 152 |
| GO:006034813 | Thyroid | ATC | bone development | 102/6293 | 205/18723 | 1.18e-06 | 1.52e-05 | 102 |
| GO:007259333 | Thyroid | ATC | reactive oxygen species metabolic process | 112/6293 | 239/18723 | 1.34e-05 | 1.28e-04 | 112 |
| GO:00614484 | Thyroid | ATC | connective tissue development | 112/6293 | 252/18723 | 2.08e-04 | 1.38e-03 | 112 |
| Page: 1 2 3 |
| Pathway ID | Tissue | Disease Stage | Description | Gene Ratio | Bg Ratio | pvalue | p.adjust | qvalue | Count |
| Page: 1 |
Top |
Cell-cell communication analysis |
| Identification of potential cell-cell interactions between two cell types and their ligand-receptor pairs for different disease states |
| Ligand | Receptor | LRpair | Pathway | Tissue | Disease Stage |
| Page: 1 |
Top |
Single-cell gene regulatory network inference analysis |
| Find out the significant the regulons (TFs) and the target genes of each regulon across cell types for different disease states |
| TF | Cell Type | Tissue | Disease Stage | Target Gene | RSS | Regulon Activity |
| ∗The dot plots of a searched regulon are shown for all cell subpopulations in each disease state of each tissue based on the regulon specific score inferred using pySCENIC and by calculating the average expression. |
| Page: 1 |
Top |
Somatic mutation of malignant transformation related genes |
| Annotation of somatic variants for genes involved in malignant transformation |
| Hugo Symbol | Variant Class | Variant Classification | dbSNP RS | HGVSc | HGVSp | HGVSp Short | SWISSPROT | BIOTYPE | SIFT | PolyPhen | Tumor Sample Barcode | Tissue | Histology | Sex | Age | Stage | Therapy Types | Drugs | Outcome |
| SH3PXD2B | SNV | Missense_Mutation | c.960N>C | p.Gln320His | p.Q320H | A1X283 | protein_coding | tolerated(0.06) | possibly_damaging(0.497) | TCGA-A2-A0SY-01 | Breast | breast invasive carcinoma | Female | <65 | III/IV | Hormone Therapy | arimidex | SD | |
| SH3PXD2B | SNV | Missense_Mutation | novel | c.1411C>T | p.Pro471Ser | p.P471S | A1X283 | protein_coding | deleterious(0.01) | benign(0.062) | TCGA-A7-A6VY-01 | Breast | breast invasive carcinoma | Female | <65 | I/II | Chemotherapy | cyclophosphamide | CR |
| SH3PXD2B | SNV | Missense_Mutation | c.1045N>T | p.Arg349Cys | p.R349C | A1X283 | protein_coding | deleterious(0) | probably_damaging(0.995) | TCGA-AC-A23H-01 | Breast | breast invasive carcinoma | Female | >=65 | I/II | Unknown | Unknown | PD | |
| SH3PXD2B | SNV | Missense_Mutation | c.1464G>T | p.Trp488Cys | p.W488C | A1X283 | protein_coding | deleterious(0.05) | possibly_damaging(0.662) | TCGA-AN-A0XS-01 | Breast | breast invasive carcinoma | Female | <65 | III/IV | Unknown | Unknown | SD | |
| SH3PXD2B | SNV | Missense_Mutation | c.1680N>G | p.Ile560Met | p.I560M | A1X283 | protein_coding | deleterious(0.05) | benign(0.024) | TCGA-B6-A0RH-01 | Breast | breast invasive carcinoma | Female | <65 | I/II | Unknown | Unknown | PD | |
| SH3PXD2B | SNV | Missense_Mutation | c.364T>C | p.Phe122Leu | p.F122L | A1X283 | protein_coding | deleterious(0.01) | probably_damaging(1) | TCGA-D8-A1XK-01 | Breast | breast invasive carcinoma | Female | <65 | I/II | Chemotherapy | doxorubicine+cyclophosphamide | SD | |
| SH3PXD2B | insertion | In_Frame_Ins | novel | c.1642_1643insCAACCTCCG | p.Gln548delinsProThrSerGlu | p.Q548delinsPTSE | A1X283 | protein_coding | TCGA-A2-A0EY-01 | Breast | breast invasive carcinoma | Female | <65 | I/II | Chemotherapy | adriamycin | SD | ||
| SH3PXD2B | SNV | Missense_Mutation | rs141428218 | c.854C>T | p.Pro285Leu | p.P285L | A1X283 | protein_coding | tolerated(0.13) | benign(0.001) | TCGA-2W-A8YY-01 | Cervix | cervical & endocervical cancer | Female | <65 | I/II | Chemotherapy | cisplatin | CR |
| SH3PXD2B | SNV | Missense_Mutation | rs771397027 | c.976N>C | p.Glu326Gln | p.E326Q | A1X283 | protein_coding | tolerated(0.17) | benign(0.015) | TCGA-DG-A2KL-01 | Cervix | cervical & endocervical cancer | Female | <65 | I/II | Chemotherapy | cisplatin | SD |
| SH3PXD2B | SNV | Missense_Mutation | c.1564N>G | p.Leu522Val | p.L522V | A1X283 | protein_coding | deleterious(0.01) | possibly_damaging(0.523) | TCGA-EK-A2PM-01 | Cervix | cervical & endocervical cancer | Female | >=65 | I/II | Unknown | Unknown | SD |
| Page: 1 2 3 4 5 6 7 8 9 10 |
Top |
Related drugs of malignant transformation related genes |
| Identification of chemicals and drugs interact with genes involved in malignant transfromation |
| (DGIdb 4.0) |
| Entrez ID | Symbol | Category | Interaction Types | Drug Claim Name | Drug Name | PMIDs |
| Page: 1 |

Copyright 2023-Present -The University of Texas Health Science Center at Houston |