| Tissue | Expression Dynamics | Abbreviation |
| Colorectum (GSE201348) |  | FAP: Familial adenomatous polyposis |
| CRC: Colorectal cancer |
| Colorectum (HTA11) |  | AD: Adenomas |
| SER: Sessile serrated lesions |
| MSI-H: Microsatellite-high colorectal cancer |
| MSS: Microsatellite stable colorectal cancer |
| Esophagus | 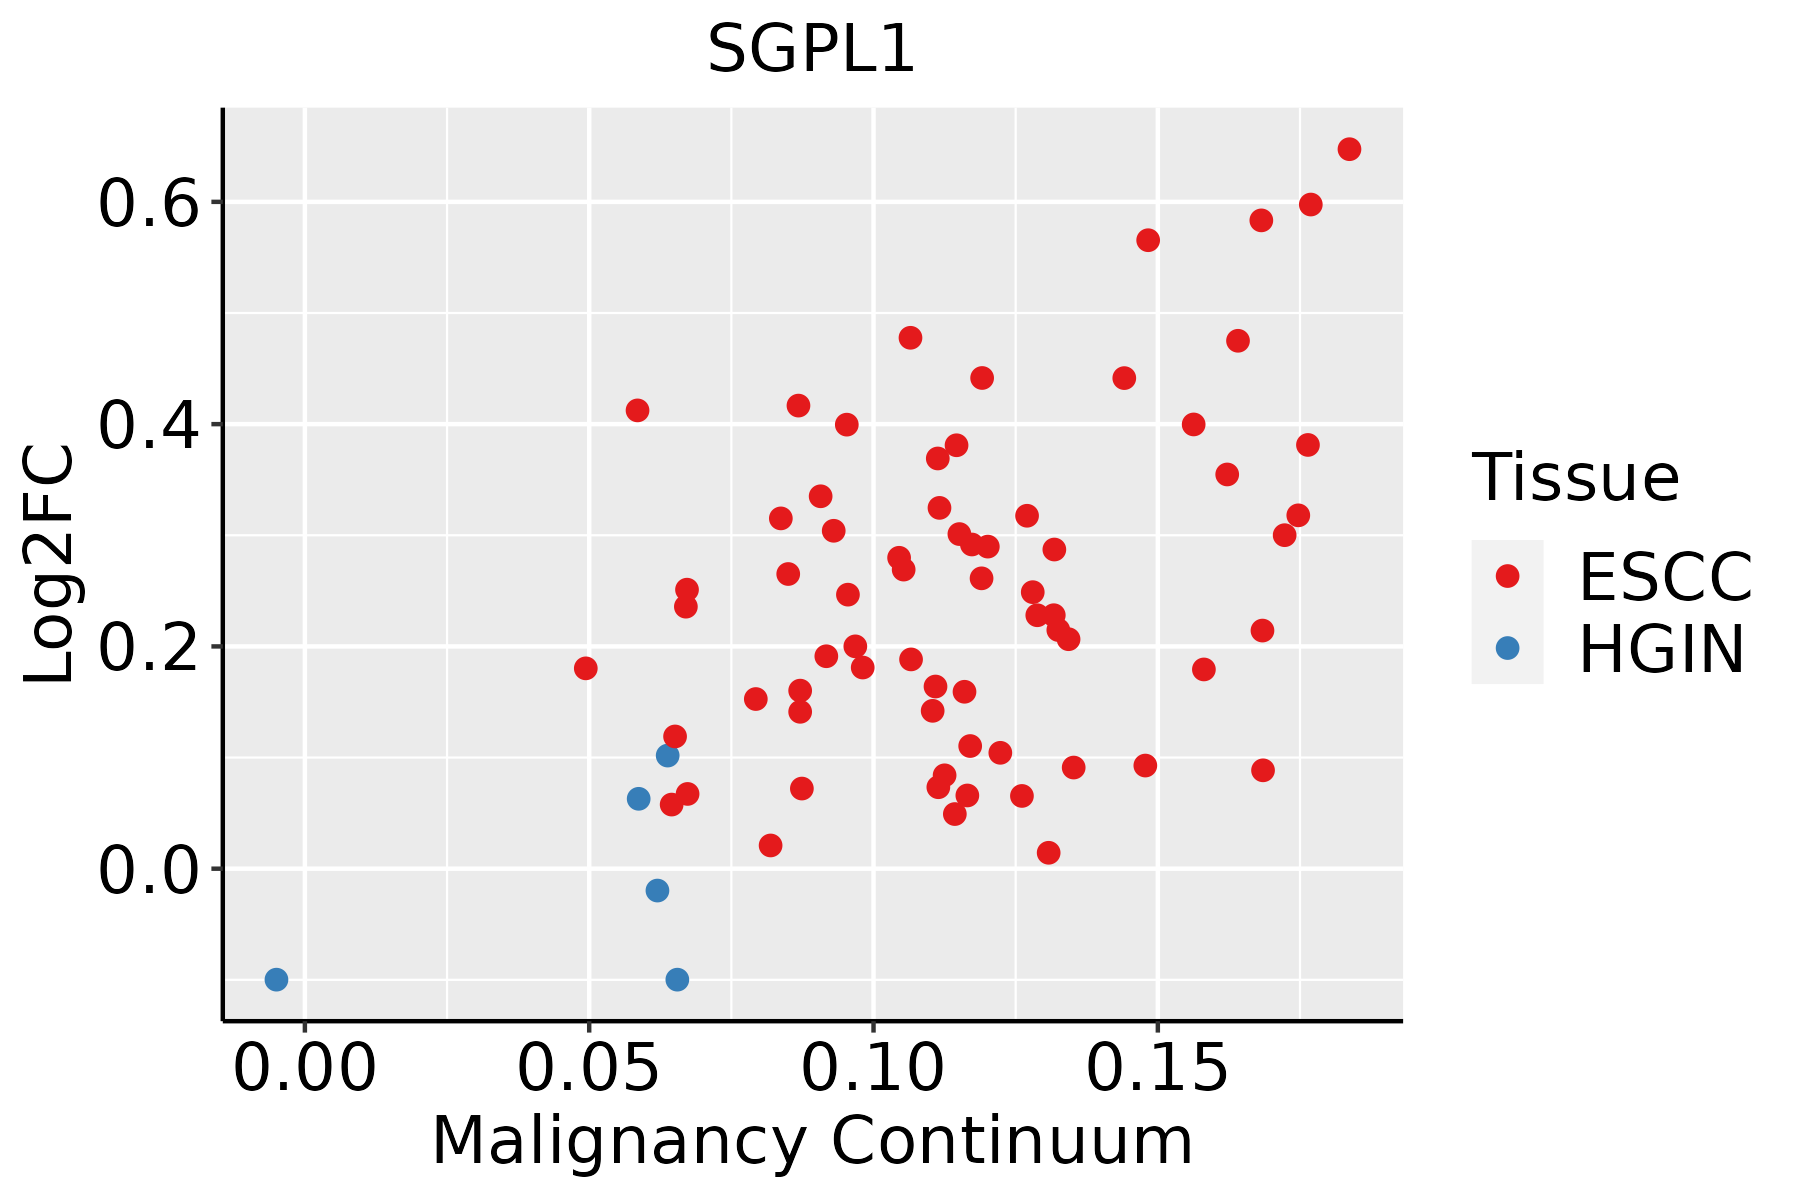 | ESCC: Esophageal squamous cell carcinoma |
| HGIN: High-grade intraepithelial neoplasias |
| LGIN: Low-grade intraepithelial neoplasias |
| Liver |  | HCC: Hepatocellular carcinoma |
| NAFLD: Non-alcoholic fatty liver disease |
| Oral Cavity | 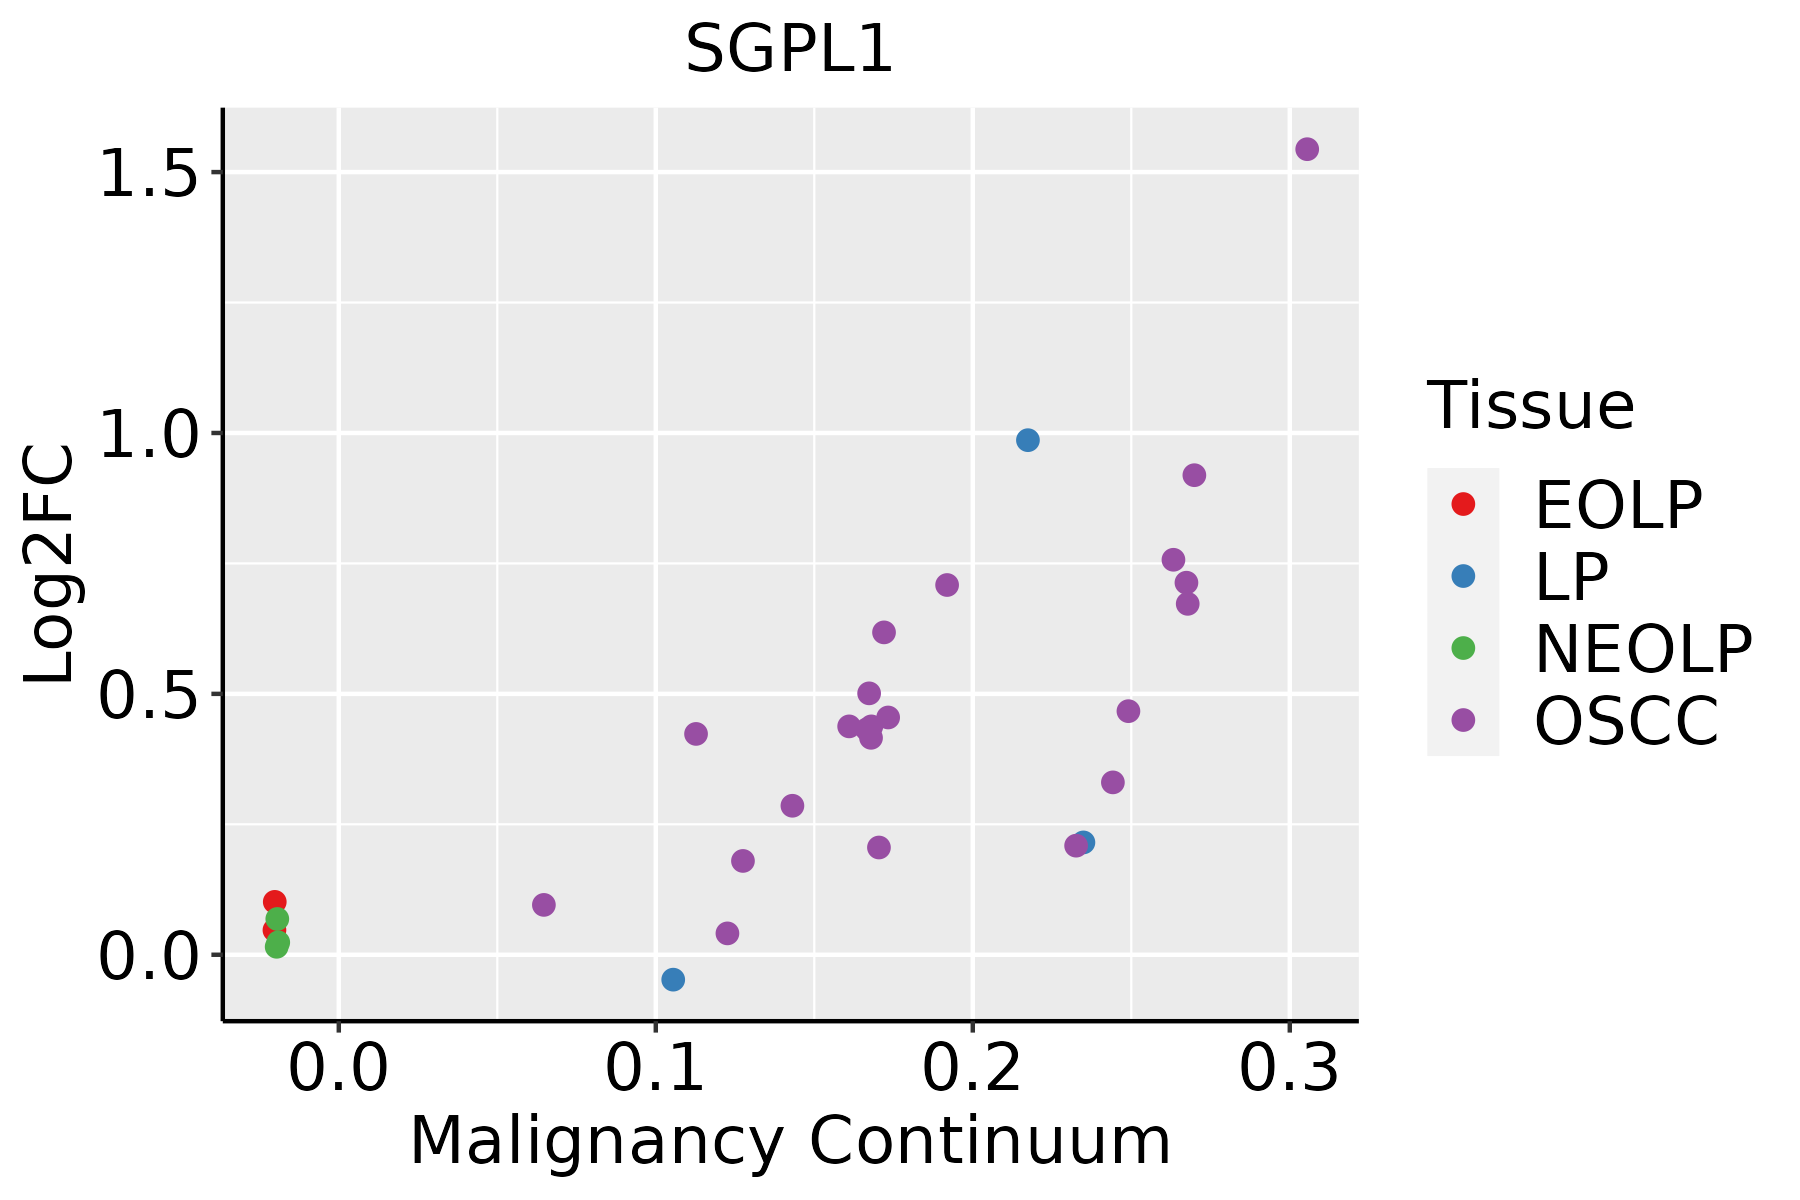 | EOLP: Erosive Oral lichen planus |
| LP: leukoplakia |
| NEOLP: Non-erosive oral lichen planus |
| OSCC: Oral squamous cell carcinoma |
| Thyroid | 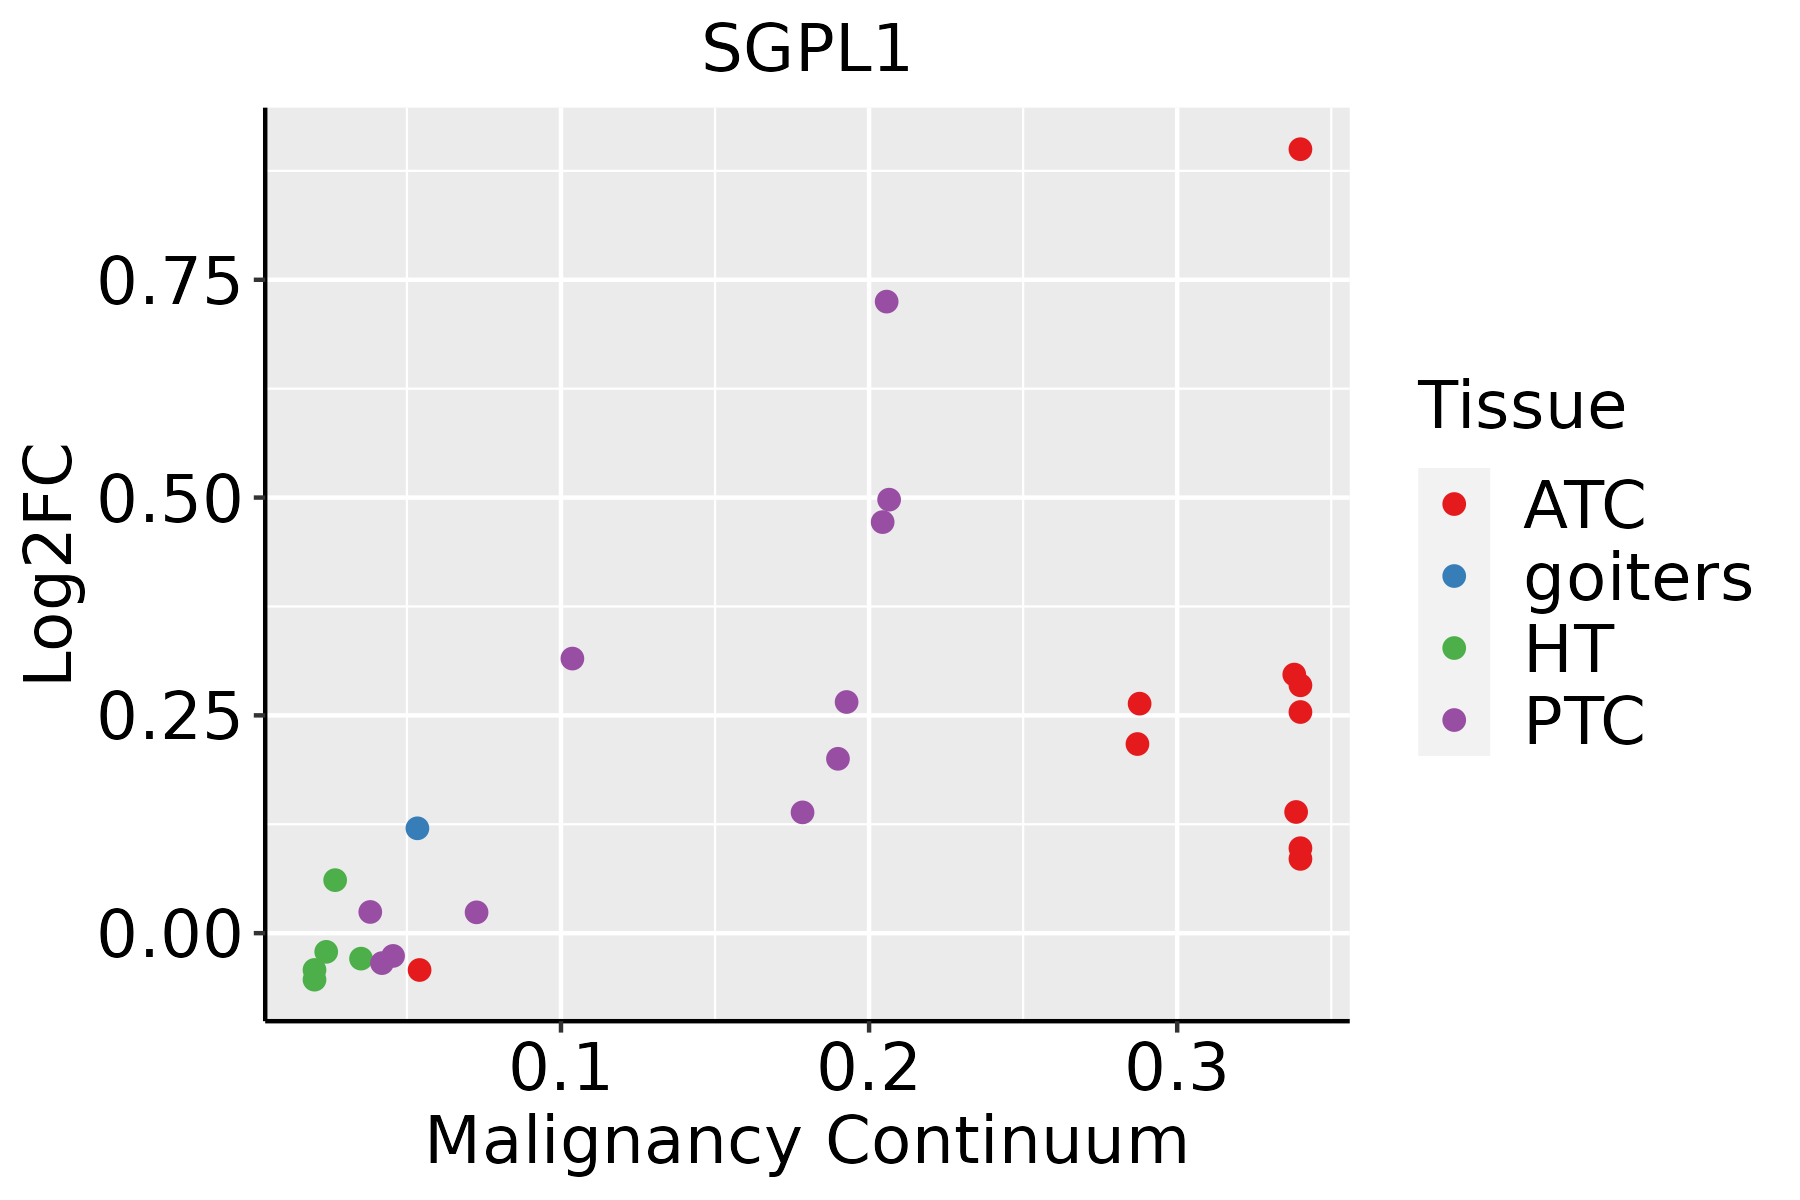 | ATC: Anaplastic thyroid cancer |
| HT: Hashimoto's thyroiditis |
| PTC: Papillary thyroid cancer |
| GO ID | Tissue | Disease Stage | Description | Gene Ratio | Bg Ratio | pvalue | p.adjust | Count |
| GO:0001570 | Colorectum | CRC | vasculogenesis | 17/2078 | 80/18723 | 6.09e-03 | 4.47e-02 | 17 |
| GO:0048705 | Colorectum | CRC | skeletal system morphogenesis | 37/2078 | 220/18723 | 6.58e-03 | 4.71e-02 | 37 |
| GO:00480081 | Colorectum | CRC | platelet-derived growth factor receptor signaling pathway | 13/2078 | 56/18723 | 7.26e-03 | 4.98e-02 | 13 |
| GO:00066433 | Esophagus | ESCC | membrane lipid metabolic process | 130/8552 | 203/18723 | 9.29e-08 | 1.54e-06 | 130 |
| GO:0061458110 | Esophagus | ESCC | reproductive system development | 247/8552 | 427/18723 | 2.24e-07 | 3.42e-06 | 247 |
| GO:004860818 | Esophagus | ESCC | reproductive structure development | 245/8552 | 424/18723 | 2.82e-07 | 4.14e-06 | 245 |
| GO:00464673 | Esophagus | ESCC | membrane lipid biosynthetic process | 91/8552 | 142/18723 | 7.19e-06 | 7.19e-05 | 91 |
| GO:00480087 | Esophagus | ESCC | platelet-derived growth factor receptor signaling pathway | 42/8552 | 56/18723 | 7.62e-06 | 7.54e-05 | 42 |
| GO:00097919 | Esophagus | ESCC | post-embryonic development | 56/8552 | 80/18723 | 9.08e-06 | 8.71e-05 | 56 |
| GO:00603242 | Esophagus | ESCC | face development | 34/8552 | 44/18723 | 1.90e-05 | 1.67e-04 | 34 |
| GO:00066652 | Esophagus | ESCC | sphingolipid metabolic process | 96/8552 | 155/18723 | 3.21e-05 | 2.66e-04 | 96 |
| GO:00066318 | Esophagus | ESCC | fatty acid metabolic process | 217/8552 | 390/18723 | 4.21e-05 | 3.39e-04 | 217 |
| GO:00352647 | Esophagus | ESCC | multicellular organism growth | 80/8552 | 132/18723 | 3.84e-04 | 2.22e-03 | 80 |
| GO:004851118 | Esophagus | ESCC | rhythmic process | 164/8552 | 298/18723 | 6.80e-04 | 3.57e-03 | 164 |
| GO:00442427 | Esophagus | ESCC | cellular lipid catabolic process | 121/8552 | 214/18723 | 8.63e-04 | 4.43e-03 | 121 |
| GO:00101711 | Esophagus | ESCC | body morphogenesis | 30/8552 | 43/18723 | 1.21e-03 | 5.88e-03 | 30 |
| GO:000166720 | Esophagus | ESCC | ameboidal-type cell migration | 250/8552 | 475/18723 | 1.22e-03 | 5.97e-03 | 250 |
| GO:00603253 | Esophagus | ESCC | face morphogenesis | 21/8552 | 28/18723 | 1.57e-03 | 7.33e-03 | 21 |
| GO:00107619 | Esophagus | ESCC | fibroblast migration | 32/8552 | 47/18723 | 1.59e-03 | 7.43e-03 | 32 |
| GO:00301481 | Esophagus | ESCC | sphingolipid biosynthetic process | 62/8552 | 103/18723 | 2.10e-03 | 9.38e-03 | 62 |
| Pathway ID | Tissue | Disease Stage | Description | Gene Ratio | Bg Ratio | pvalue | p.adjust | qvalue | Count |
| hsa04071 | Colorectum | AD | Sphingolipid signaling pathway | 43/2092 | 121/8465 | 4.83e-03 | 2.28e-02 | 1.45e-02 | 43 |
| hsa040711 | Colorectum | AD | Sphingolipid signaling pathway | 43/2092 | 121/8465 | 4.83e-03 | 2.28e-02 | 1.45e-02 | 43 |
| hsa040714 | Colorectum | FAP | Sphingolipid signaling pathway | 34/1404 | 121/8465 | 9.53e-04 | 5.22e-03 | 3.17e-03 | 34 |
| hsa040715 | Colorectum | FAP | Sphingolipid signaling pathway | 34/1404 | 121/8465 | 9.53e-04 | 5.22e-03 | 3.17e-03 | 34 |
| hsa040716 | Colorectum | CRC | Sphingolipid signaling pathway | 30/1091 | 121/8465 | 2.49e-04 | 3.09e-03 | 2.09e-03 | 30 |
| hsa040717 | Colorectum | CRC | Sphingolipid signaling pathway | 30/1091 | 121/8465 | 2.49e-04 | 3.09e-03 | 2.09e-03 | 30 |
| hsa0407116 | Esophagus | ESCC | Sphingolipid signaling pathway | 85/4205 | 121/8465 | 3.04e-06 | 1.73e-05 | 8.84e-06 | 85 |
| hsa006003 | Esophagus | ESCC | Sphingolipid metabolism | 36/4205 | 53/8465 | 5.41e-03 | 1.36e-02 | 6.99e-03 | 36 |
| hsa0407117 | Esophagus | ESCC | Sphingolipid signaling pathway | 85/4205 | 121/8465 | 3.04e-06 | 1.73e-05 | 8.84e-06 | 85 |
| hsa0060012 | Esophagus | ESCC | Sphingolipid metabolism | 36/4205 | 53/8465 | 5.41e-03 | 1.36e-02 | 6.99e-03 | 36 |
| hsa040718 | Liver | HCC | Sphingolipid signaling pathway | 72/4020 | 121/8465 | 5.01e-03 | 1.47e-02 | 8.18e-03 | 72 |
| hsa00600 | Liver | HCC | Sphingolipid metabolism | 34/4020 | 53/8465 | 1.06e-02 | 2.71e-02 | 1.51e-02 | 34 |
| hsa0407111 | Liver | HCC | Sphingolipid signaling pathway | 72/4020 | 121/8465 | 5.01e-03 | 1.47e-02 | 8.18e-03 | 72 |
| hsa006001 | Liver | HCC | Sphingolipid metabolism | 34/4020 | 53/8465 | 1.06e-02 | 2.71e-02 | 1.51e-02 | 34 |
| hsa0407114 | Oral cavity | OSCC | Sphingolipid signaling pathway | 82/3704 | 121/8465 | 6.97e-08 | 5.08e-07 | 2.58e-07 | 82 |
| hsa006002 | Oral cavity | OSCC | Sphingolipid metabolism | 33/3704 | 53/8465 | 5.00e-03 | 1.20e-02 | 6.13e-03 | 33 |
| hsa0407115 | Oral cavity | OSCC | Sphingolipid signaling pathway | 82/3704 | 121/8465 | 6.97e-08 | 5.08e-07 | 2.58e-07 | 82 |
| hsa0060011 | Oral cavity | OSCC | Sphingolipid metabolism | 33/3704 | 53/8465 | 5.00e-03 | 1.20e-02 | 6.13e-03 | 33 |
| hsa0407122 | Oral cavity | LP | Sphingolipid signaling pathway | 48/2418 | 121/8465 | 5.30e-03 | 2.15e-02 | 1.39e-02 | 48 |
| hsa0407132 | Oral cavity | LP | Sphingolipid signaling pathway | 48/2418 | 121/8465 | 5.30e-03 | 2.15e-02 | 1.39e-02 | 48 |
| Hugo Symbol | Variant Class | Variant Classification | dbSNP RS | HGVSc | HGVSp | HGVSp Short | SWISSPROT | BIOTYPE | SIFT | PolyPhen | Tumor Sample Barcode | Tissue | Histology | Sex | Age | Stage | Therapy Types | Drugs | Outcome |
| SGPL1 | SNV | Missense_Mutation | novel | c.95N>A | p.Gly32Glu | p.G32E | O95470 | protein_coding | tolerated(0.9) | benign(0.003) | TCGA-AN-A046-01 | Breast | breast invasive carcinoma | Female | >=65 | I/II | Unknown | Unknown | SD |
| SGPL1 | SNV | Missense_Mutation | novel | c.190G>A | p.Glu64Lys | p.E64K | O95470 | protein_coding | deleterious(0.03) | benign(0.418) | TCGA-BH-A2L8-01 | Breast | breast invasive carcinoma | Female | <65 | I/II | Chemotherapy | cytoxan | CR |
| SGPL1 | insertion | Nonsense_Mutation | novel | c.1554_1555insTTAATTAGGGGGTCAGATGTTCTATAAGGAAACCAGTTACAT | p.Lys518_Thr519insLeuIleArgGlySerAspValLeuTerGlyAsnGlnLeuHis | p.K518_T519insLIRGSDVL*GNQLH | O95470 | protein_coding | | | TCGA-A2-A04V-01 | Breast | breast invasive carcinoma | Female | <65 | I/II | Chemotherapy | cytoxan | PD |
| SGPL1 | insertion | Nonsense_Mutation | novel | c.1562_1563insGCGATATAGAGGGCTTAGGGCAGCAGCTTAGGGCTTAGGCCAGACC | p.Met522ArgfsTer10 | p.M522Rfs*10 | O95470 | protein_coding | | | TCGA-A8-A06P-01 | Breast | breast invasive carcinoma | Female | <65 | III/IV | Unspecific | | SD |
| SGPL1 | SNV | Missense_Mutation | novel | c.186G>T | p.Gln62His | p.Q62H | O95470 | protein_coding | tolerated(0.07) | benign(0.067) | TCGA-2W-A8YY-01 | Cervix | cervical & endocervical cancer | Female | <65 | I/II | Chemotherapy | cisplatin | CR |
| SGPL1 | SNV | Missense_Mutation | novel | c.286A>G | p.Lys96Glu | p.K96E | O95470 | protein_coding | tolerated(0.96) | benign(0.007) | TCGA-2W-A8YY-01 | Cervix | cervical & endocervical cancer | Female | <65 | I/II | Chemotherapy | cisplatin | CR |
| SGPL1 | SNV | Missense_Mutation | novel | c.1679A>G | p.Gln560Arg | p.Q560R | O95470 | protein_coding | tolerated(0.16) | benign(0.05) | TCGA-C5-A1MN-01 | Cervix | cervical & endocervical cancer | Female | <65 | III/IV | Chemotherapy | cisplatin | SD |
| SGPL1 | SNV | Missense_Mutation | | c.1282N>T | p.Arg428Cys | p.R428C | O95470 | protein_coding | deleterious(0) | probably_damaging(0.978) | TCGA-DS-A0VM-01 | Cervix | cervical & endocervical cancer | Female | <65 | I/II | Chemotherapy | cisplatin | PD |
| SGPL1 | SNV | Missense_Mutation | novel | c.494G>T | p.Gly165Val | p.G165V | O95470 | protein_coding | deleterious(0.01) | benign(0.071) | TCGA-IR-A3LA-01 | Cervix | cervical & endocervical cancer | Female | <65 | I/II | Chemotherapy | cisplatin | CR |
| SGPL1 | SNV | Missense_Mutation | | c.306N>A | p.Asn102Lys | p.N102K | O95470 | protein_coding | tolerated(0.6) | benign(0) | TCGA-A6-A565-01 | Colorectum | colon adenocarcinoma | Female | <65 | III/IV | Unspecific | 5FU | PD |


