
|
|||||
|
 | |
| |
| |
| |
| |
| |
|
Gene: SERPINC1 |
Gene summary for SERPINC1 |
| Gene information | Species | Human | Gene symbol | SERPINC1 | Gene ID | 462 |
| Gene name | serpin family C member 1 | |
| Gene Alias | AT3 | |
| Cytomap | 1q25.1 | |
| Gene Type | protein-coding | GO ID | GO:0002376 | UniProtAcc | A0A024R944 |
Top |
Malignant transformation analysis |
| Identification of the aberrant gene expression in precancerous and cancerous lesions by comparing the gene expression of stem-like cells in diseased tissues with normal stem cells |
| Entrez ID | Symbol | Replicates | Species | Organ | Tissue | Adj P-value | Log2FC | Malignancy |
| 462 | SERPINC1 | NAFLD1 | Human | Liver | NAFLD | 1.84e-10 | 5.02e-01 | -0.04 |
| 462 | SERPINC1 | HCC1_Meng | Human | Liver | HCC | 5.34e-48 | 2.70e-02 | 0.0246 |
| 462 | SERPINC1 | HCC2_Meng | Human | Liver | HCC | 1.07e-06 | -3.21e-01 | 0.0107 |
| 462 | SERPINC1 | HCC1 | Human | Liver | HCC | 1.66e-26 | 4.48e+00 | 0.5336 |
| 462 | SERPINC1 | HCC2 | Human | Liver | HCC | 2.78e-32 | 3.34e+00 | 0.5341 |
| 462 | SERPINC1 | Pt13.a | Human | Liver | HCC | 5.08e-66 | 1.02e+00 | 0.021 |
| 462 | SERPINC1 | Pt13.b | Human | Liver | HCC | 2.44e-86 | 7.49e-01 | 0.0251 |
| 462 | SERPINC1 | Pt13.c | Human | Liver | HCC | 9.15e-30 | 1.06e+00 | 0.0076 |
| 462 | SERPINC1 | Pt14.a | Human | Liver | HCC | 6.44e-06 | 1.39e-01 | 0.0169 |
| 462 | SERPINC1 | Pt14.b | Human | Liver | HCC | 8.83e-25 | 6.85e-01 | 0.018 |
| 462 | SERPINC1 | Pt14.d | Human | Liver | HCC | 3.78e-08 | 3.28e-01 | 0.0143 |
| 462 | SERPINC1 | S029 | Human | Liver | HCC | 1.47e-07 | 3.60e-01 | 0.2581 |
| Page: 1 |
| Tissue | Expression Dynamics | Abbreviation |
| Liver | 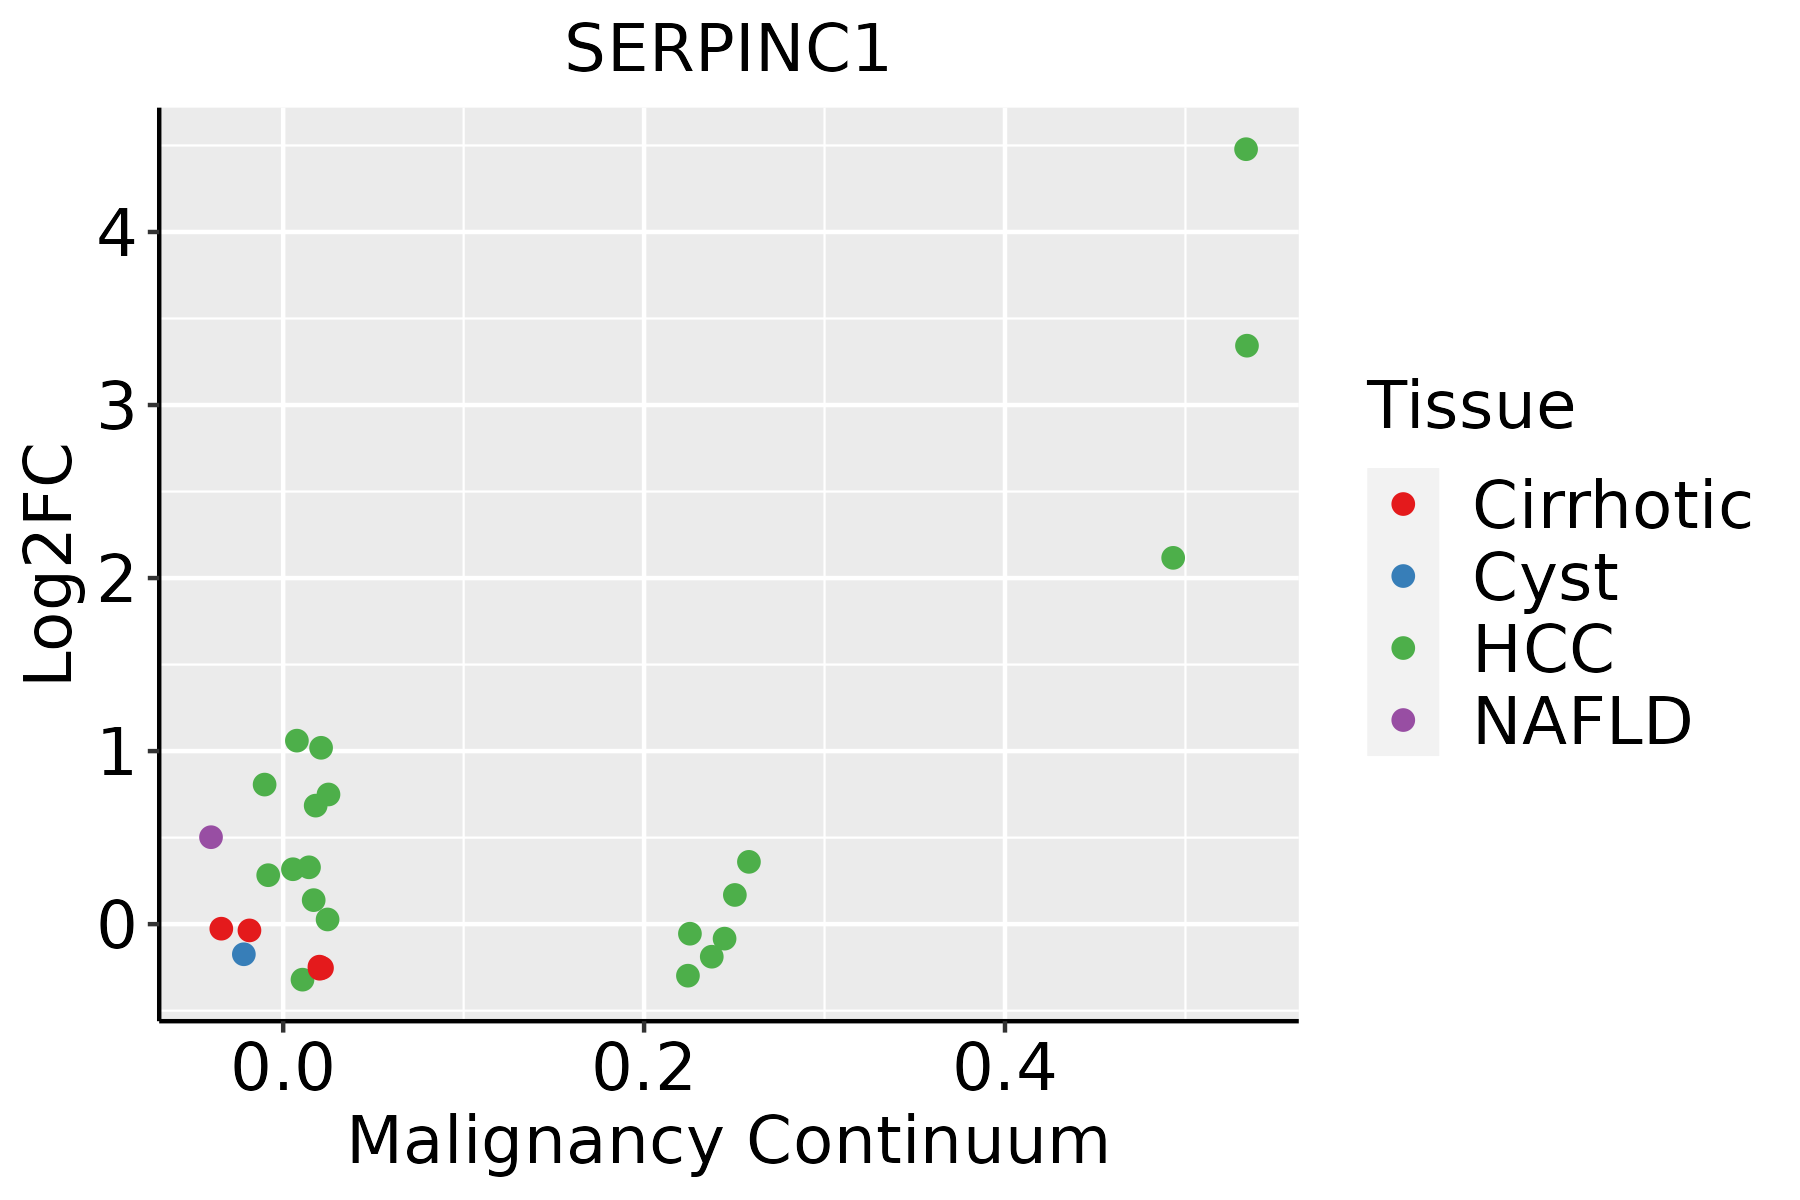 | HCC: Hepatocellular carcinoma |
| NAFLD: Non-alcoholic fatty liver disease |
| ∗log2FC in expression of this searched gene in stem-like cells from each diseased tissue sample relative to stem-like cells in normal samples in each tissue plotted against the malignancy continuum. Samples are colored based on if they are from different disease stage. |
Top |
Malignant transformation related pathway analysis |
| Find out the enriched GO biological processes and KEGG pathways involved in transition from healthy to precancer to cancer |
| Tissue | Disease Stage | Enriched GO biological Processes |
| Colorectum | AD |  |
| Colorectum | SER |  |
| Colorectum | MSS |  |
| Colorectum | MSI-H |  |
| Colorectum | FAP |  |
| ∗Top 15 enriched GO BP terms are showed in the bar plot of each disease state in each tissue. Each row represents a significant GO biological process which is colored according to the -log10(p.adjust). |
| Page: 1 2 3 4 5 6 7 8 9 |
| GO ID | Tissue | Disease Stage | Description | Gene Ratio | Bg Ratio | pvalue | p.adjust | Count |
| GO:001095121 | Liver | HCC | negative regulation of endopeptidase activity | 129/7958 | 252/18723 | 3.17e-03 | 1.47e-02 | 129 |
| GO:00025262 | Liver | HCC | acute inflammatory response | 62/7958 | 112/18723 | 4.06e-03 | 1.77e-02 | 62 |
| GO:00723762 | Liver | HCC | protein activation cascade | 10/7958 | 12/18723 | 4.79e-03 | 2.02e-02 | 10 |
| GO:001046621 | Liver | HCC | negative regulation of peptidase activity | 132/7958 | 262/18723 | 5.82e-03 | 2.42e-02 | 132 |
| GO:00075951 | Liver | HCC | lactation | 29/7958 | 47/18723 | 6.16e-03 | 2.52e-02 | 29 |
| Page: 1 2 3 |
| Pathway ID | Tissue | Disease Stage | Description | Gene Ratio | Bg Ratio | pvalue | p.adjust | qvalue | Count |
| hsa04610 | Liver | NAFLD | Complement and coagulation cascades | 35/1043 | 86/8465 | 2.48e-11 | 2.04e-09 | 1.64e-09 | 35 |
| hsa046101 | Liver | NAFLD | Complement and coagulation cascades | 35/1043 | 86/8465 | 2.48e-11 | 2.04e-09 | 1.64e-09 | 35 |
| hsa046104 | Liver | HCC | Complement and coagulation cascades | 57/4020 | 86/8465 | 3.19e-04 | 1.45e-03 | 8.04e-04 | 57 |
| hsa046105 | Liver | HCC | Complement and coagulation cascades | 57/4020 | 86/8465 | 3.19e-04 | 1.45e-03 | 8.04e-04 | 57 |
| Page: 1 |
Top |
Cell-cell communication analysis |
| Identification of potential cell-cell interactions between two cell types and their ligand-receptor pairs for different disease states |
| Ligand | Receptor | LRpair | Pathway | Tissue | Disease Stage |
| Page: 1 |
Top |
Single-cell gene regulatory network inference analysis |
| Find out the significant the regulons (TFs) and the target genes of each regulon across cell types for different disease states |
| TF | Cell Type | Tissue | Disease Stage | Target Gene | RSS | Regulon Activity |
| ∗The dot plots of a searched regulon are shown for all cell subpopulations in each disease state of each tissue based on the regulon specific score inferred using pySCENIC and by calculating the average expression. |
| Page: 1 |
Top |
Somatic mutation of malignant transformation related genes |
| Annotation of somatic variants for genes involved in malignant transformation |
| Hugo Symbol | Variant Class | Variant Classification | dbSNP RS | HGVSc | HGVSp | HGVSp Short | SWISSPROT | BIOTYPE | SIFT | PolyPhen | Tumor Sample Barcode | Tissue | Histology | Sex | Age | Stage | Therapy Types | Drugs | Outcome |
| SERPINC1 | SNV | Missense_Mutation | c.604N>A | p.Leu202Ile | p.L202I | P01008 | protein_coding | tolerated(0.18) | probably_damaging(0.986) | TCGA-A2-A0YJ-01 | Breast | breast invasive carcinoma | Female | <65 | III/IV | Chemotherapy | cytoxan | PD | |
| SERPINC1 | SNV | Missense_Mutation | novel | c.1142C>G | p.Ser381Cys | p.S381C | P01008 | protein_coding | deleterious(0) | benign(0.148) | TCGA-A2-A4S3-01 | Breast | breast invasive carcinoma | Female | <65 | I/II | Unknown | Unknown | SD |
| SERPINC1 | SNV | Missense_Mutation | c.147N>A | p.Met49Ile | p.M49I | P01008 | protein_coding | tolerated(0.16) | benign(0.003) | TCGA-BH-A0BR-01 | Breast | breast invasive carcinoma | Female | <65 | I/II | Unknown | Unknown | SD | |
| SERPINC1 | SNV | Missense_Mutation | c.32C>T | p.Ser11Phe | p.S11F | P01008 | protein_coding | deleterious_low_confidence(0.03) | benign(0.094) | TCGA-BH-A0E1-01 | Breast | breast invasive carcinoma | Female | <65 | I/II | Chemotherapy | cytoxan | SD | |
| SERPINC1 | SNV | Missense_Mutation | novel | c.1007N>G | p.Leu336Arg | p.L336R | P01008 | protein_coding | deleterious(0) | probably_damaging(0.999) | TCGA-BH-A42T-01 | Breast | breast invasive carcinoma | Female | >=65 | I/II | Unknown | Unknown | SD |
| SERPINC1 | SNV | Missense_Mutation | c.79N>C | p.Trp27Arg | p.W27R | P01008 | protein_coding | deleterious(0) | possibly_damaging(0.721) | TCGA-E2-A1IN-01 | Breast | breast invasive carcinoma | Female | <65 | I/II | Hormone Therapy | arimidex | SD | |
| SERPINC1 | SNV | Missense_Mutation | novel | c.176A>G | p.Glu59Gly | p.E59G | P01008 | protein_coding | tolerated(0.09) | benign(0.007) | TCGA-EW-A6SB-01 | Breast | breast invasive carcinoma | Female | <65 | I/II | Unknown | Unknown | SD |
| SERPINC1 | insertion | Nonsense_Mutation | novel | c.227_228insTTGAAGGAGTTAACAACTGAGGTGGCTATTA | p.Asn77Ter | p.N77* | P01008 | protein_coding | TCGA-A2-A04Y-01 | Breast | breast invasive carcinoma | Female | <65 | I/II | Chemotherapy | cytoxan | SD | ||
| SERPINC1 | SNV | Missense_Mutation | rs775413132 | c.1120G>A | p.Asp374Asn | p.D374N | P01008 | protein_coding | tolerated(0.05) | probably_damaging(0.946) | TCGA-2W-A8YY-01 | Cervix | cervical & endocervical cancer | Female | <65 | I/II | Chemotherapy | cisplatin | CR |
| SERPINC1 | SNV | Missense_Mutation | rs201541724 | c.1172G>A | p.Arg391Gln | p.R391Q | P01008 | protein_coding | tolerated(0.25) | benign(0.003) | TCGA-EA-A3QE-01 | Cervix | cervical & endocervical cancer | Female | <65 | I/II | Unknown | Unknown | SD |
| Page: 1 2 3 4 5 6 7 |
Top |
Related drugs of malignant transformation related genes |
| Identification of chemicals and drugs interact with genes involved in malignant transfromation |
| (DGIdb 4.0) |
| Entrez ID | Symbol | Category | Interaction Types | Drug Claim Name | Drug Name | PMIDs |
| 462 | SERPINC1 | DRUGGABLE GENOME, PROTEASE INHIBITOR | Unfractionated heparin | |||
| 462 | SERPINC1 | DRUGGABLE GENOME, PROTEASE INHIBITOR | SULODEXIDE | SULODEXIDE | ||
| 462 | SERPINC1 | DRUGGABLE GENOME, PROTEASE INHIBITOR | activator | CHEMBL1201476 | ENOXAPARIN SODIUM | |
| 462 | SERPINC1 | DRUGGABLE GENOME, PROTEASE INHIBITOR | Sulodexide | SULODEXIDE | ||
| 462 | SERPINC1 | DRUGGABLE GENOME, PROTEASE INHIBITOR | FONDAPARINUX | FONDAPARINUX | ||
| 462 | SERPINC1 | DRUGGABLE GENOME, PROTEASE INHIBITOR | RO-14 | |||
| 462 | SERPINC1 | DRUGGABLE GENOME, PROTEASE INHIBITOR | ENOXAPARIN | ENOXAPARIN | ||
| 462 | SERPINC1 | DRUGGABLE GENOME, PROTEASE INHIBITOR | avatrombopag | AVATROMBOPAG | ||
| 462 | SERPINC1 | DRUGGABLE GENOME, PROTEASE INHIBITOR | Avatrombopag | AVATROMBOPAG | ||
| 462 | SERPINC1 | DRUGGABLE GENOME, PROTEASE INHIBITOR | Heparin Calcium |
| Page: 1 2 3 4 5 6 |

Copyright 2023-Present -The University of Texas Health Science Center at Houston |