
|
|||||
|
 | |
| |
| |
| |
| |
| |
|
Gene: SDF2 |
Gene summary for SDF2 |
| Gene information | Species | Human | Gene symbol | SDF2 | Gene ID | 6388 |
| Gene name | stromal cell derived factor 2 | |
| Gene Alias | SDF2 | |
| Cytomap | 17q11.2 | |
| Gene Type | protein-coding | GO ID | GO:0006457 | UniProtAcc | Q6IBU4 |
Top |
Malignant transformation analysis |
| Identification of the aberrant gene expression in precancerous and cancerous lesions by comparing the gene expression of stem-like cells in diseased tissues with normal stem cells |
| Entrez ID | Symbol | Replicates | Species | Organ | Tissue | Adj P-value | Log2FC | Malignancy |
| 6388 | SDF2 | HTA11_1938_2000001011 | Human | Colorectum | AD | 3.80e-02 | 2.78e-01 | -0.0811 |
| 6388 | SDF2 | HTA11_347_2000001011 | Human | Colorectum | AD | 2.54e-12 | 4.37e-01 | -0.1954 |
| 6388 | SDF2 | HTA11_696_2000001011 | Human | Colorectum | AD | 2.22e-05 | 3.08e-01 | -0.1464 |
| 6388 | SDF2 | HTA11_866_2000001011 | Human | Colorectum | AD | 8.36e-03 | 2.02e-01 | -0.1001 |
| 6388 | SDF2 | HTA11_1391_2000001011 | Human | Colorectum | AD | 8.78e-07 | 3.95e-01 | -0.059 |
| 6388 | SDF2 | HTA11_866_3004761011 | Human | Colorectum | AD | 3.05e-06 | 3.21e-01 | 0.096 |
| 6388 | SDF2 | HTA11_7696_3000711011 | Human | Colorectum | AD | 2.55e-10 | 2.76e-01 | 0.0674 |
| 6388 | SDF2 | HTA11_6818_2000001021 | Human | Colorectum | AD | 6.90e-06 | 3.46e-01 | 0.0588 |
| 6388 | SDF2 | HTA11_99999971662_82457 | Human | Colorectum | MSS | 3.56e-07 | 4.00e-01 | 0.3859 |
| 6388 | SDF2 | HTA11_99999974143_84620 | Human | Colorectum | MSS | 3.04e-12 | 4.04e-01 | 0.3005 |
| 6388 | SDF2 | A002-C-114 | Human | Colorectum | FAP | 4.92e-02 | -1.14e-01 | -0.1561 |
| 6388 | SDF2 | LZE2D | Human | Esophagus | HGIN | 4.46e-02 | 2.33e-01 | 0.0642 |
| 6388 | SDF2 | LZE2T | Human | Esophagus | ESCC | 1.22e-03 | 5.50e-01 | 0.082 |
| 6388 | SDF2 | LZE4T | Human | Esophagus | ESCC | 8.51e-11 | 3.53e-01 | 0.0811 |
| 6388 | SDF2 | LZE7T | Human | Esophagus | ESCC | 1.30e-14 | 6.77e-01 | 0.0667 |
| 6388 | SDF2 | LZE8T | Human | Esophagus | ESCC | 2.15e-12 | 4.14e-01 | 0.067 |
| 6388 | SDF2 | LZE20T | Human | Esophagus | ESCC | 2.66e-03 | 2.25e-01 | 0.0662 |
| 6388 | SDF2 | LZE22D1 | Human | Esophagus | HGIN | 5.36e-03 | 1.46e-01 | 0.0595 |
| 6388 | SDF2 | LZE22T | Human | Esophagus | ESCC | 2.43e-05 | 7.84e-01 | 0.068 |
| 6388 | SDF2 | LZE24T | Human | Esophagus | ESCC | 7.04e-36 | 9.86e-01 | 0.0596 |
| Page: 1 2 3 4 5 6 7 |
| Tissue | Expression Dynamics | Abbreviation |
| Colorectum (GSE201348) |  | FAP: Familial adenomatous polyposis |
| CRC: Colorectal cancer | ||
| Colorectum (HTA11) |  | AD: Adenomas |
| SER: Sessile serrated lesions | ||
| MSI-H: Microsatellite-high colorectal cancer | ||
| MSS: Microsatellite stable colorectal cancer | ||
| Esophagus | 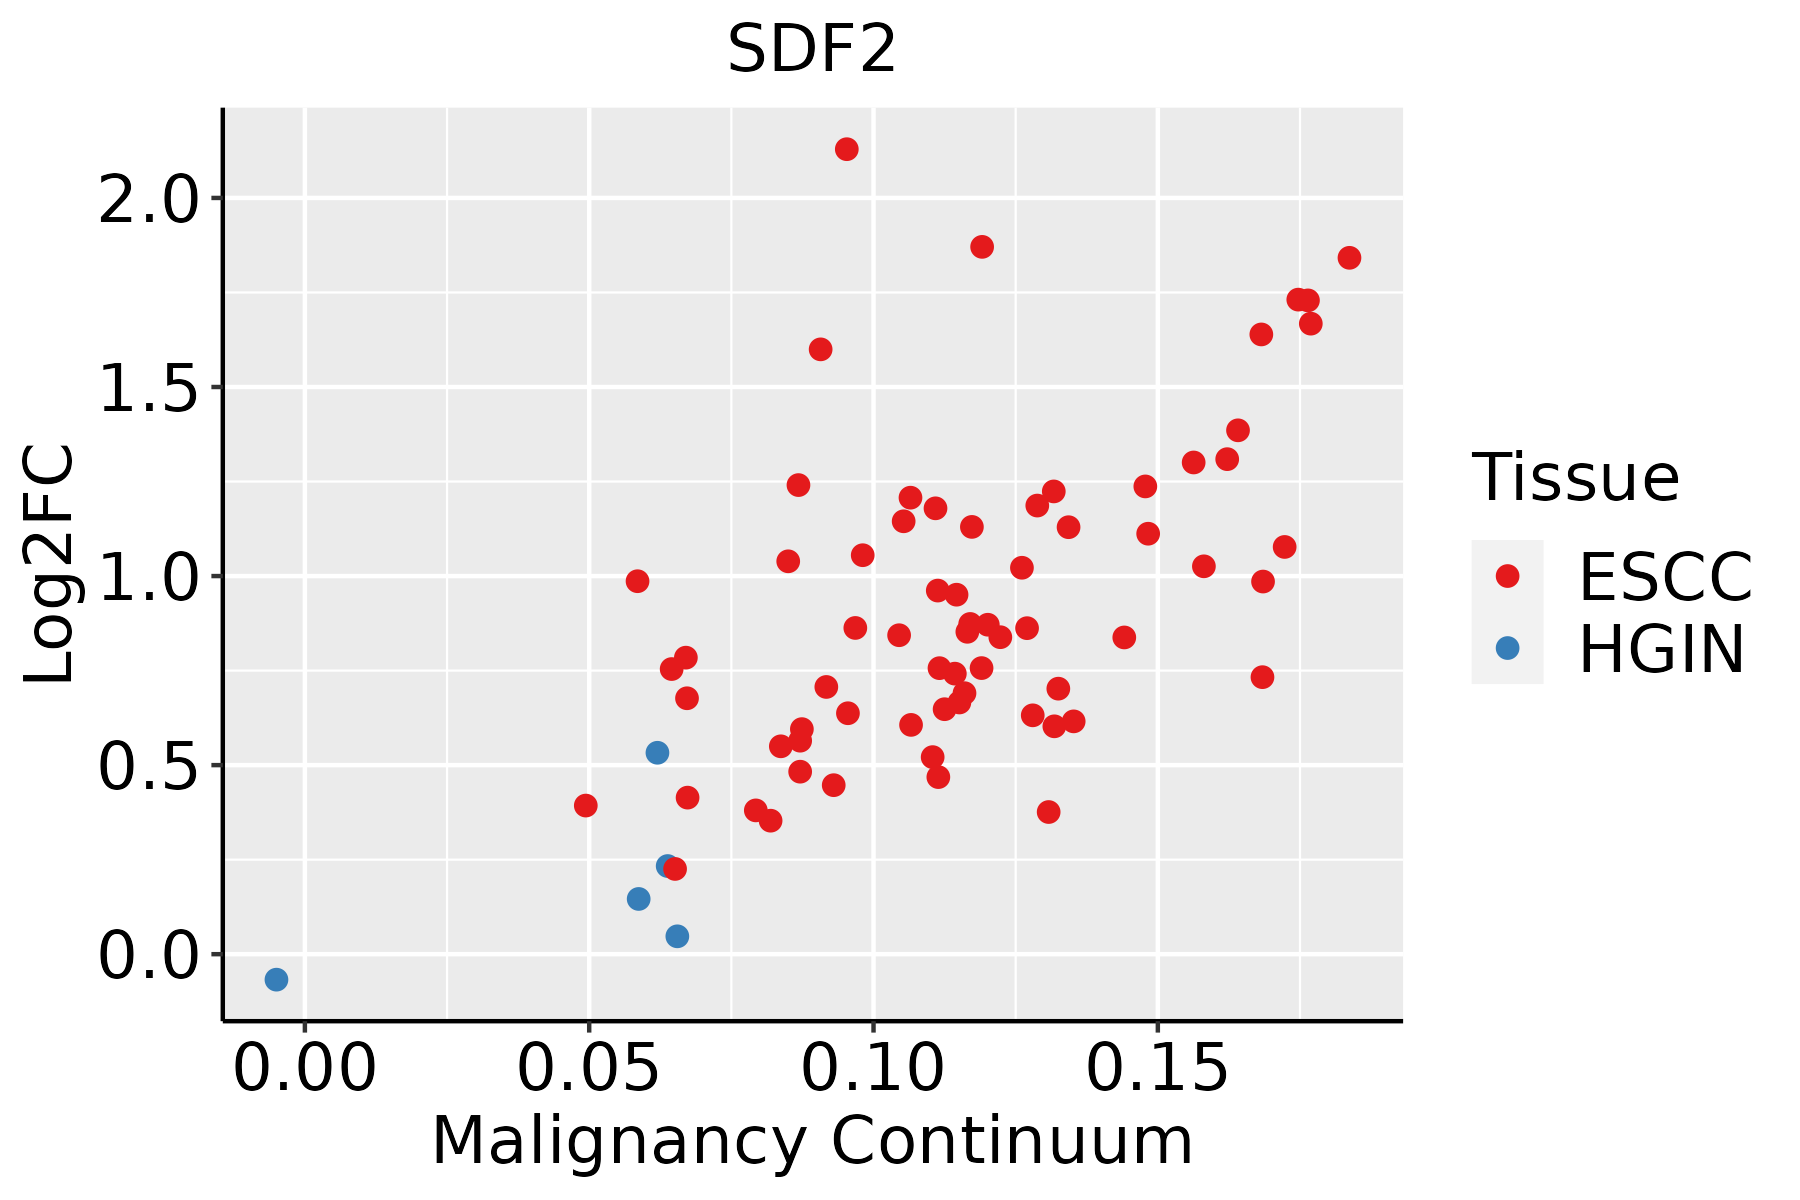 | ESCC: Esophageal squamous cell carcinoma |
| HGIN: High-grade intraepithelial neoplasias | ||
| LGIN: Low-grade intraepithelial neoplasias | ||
| Liver | 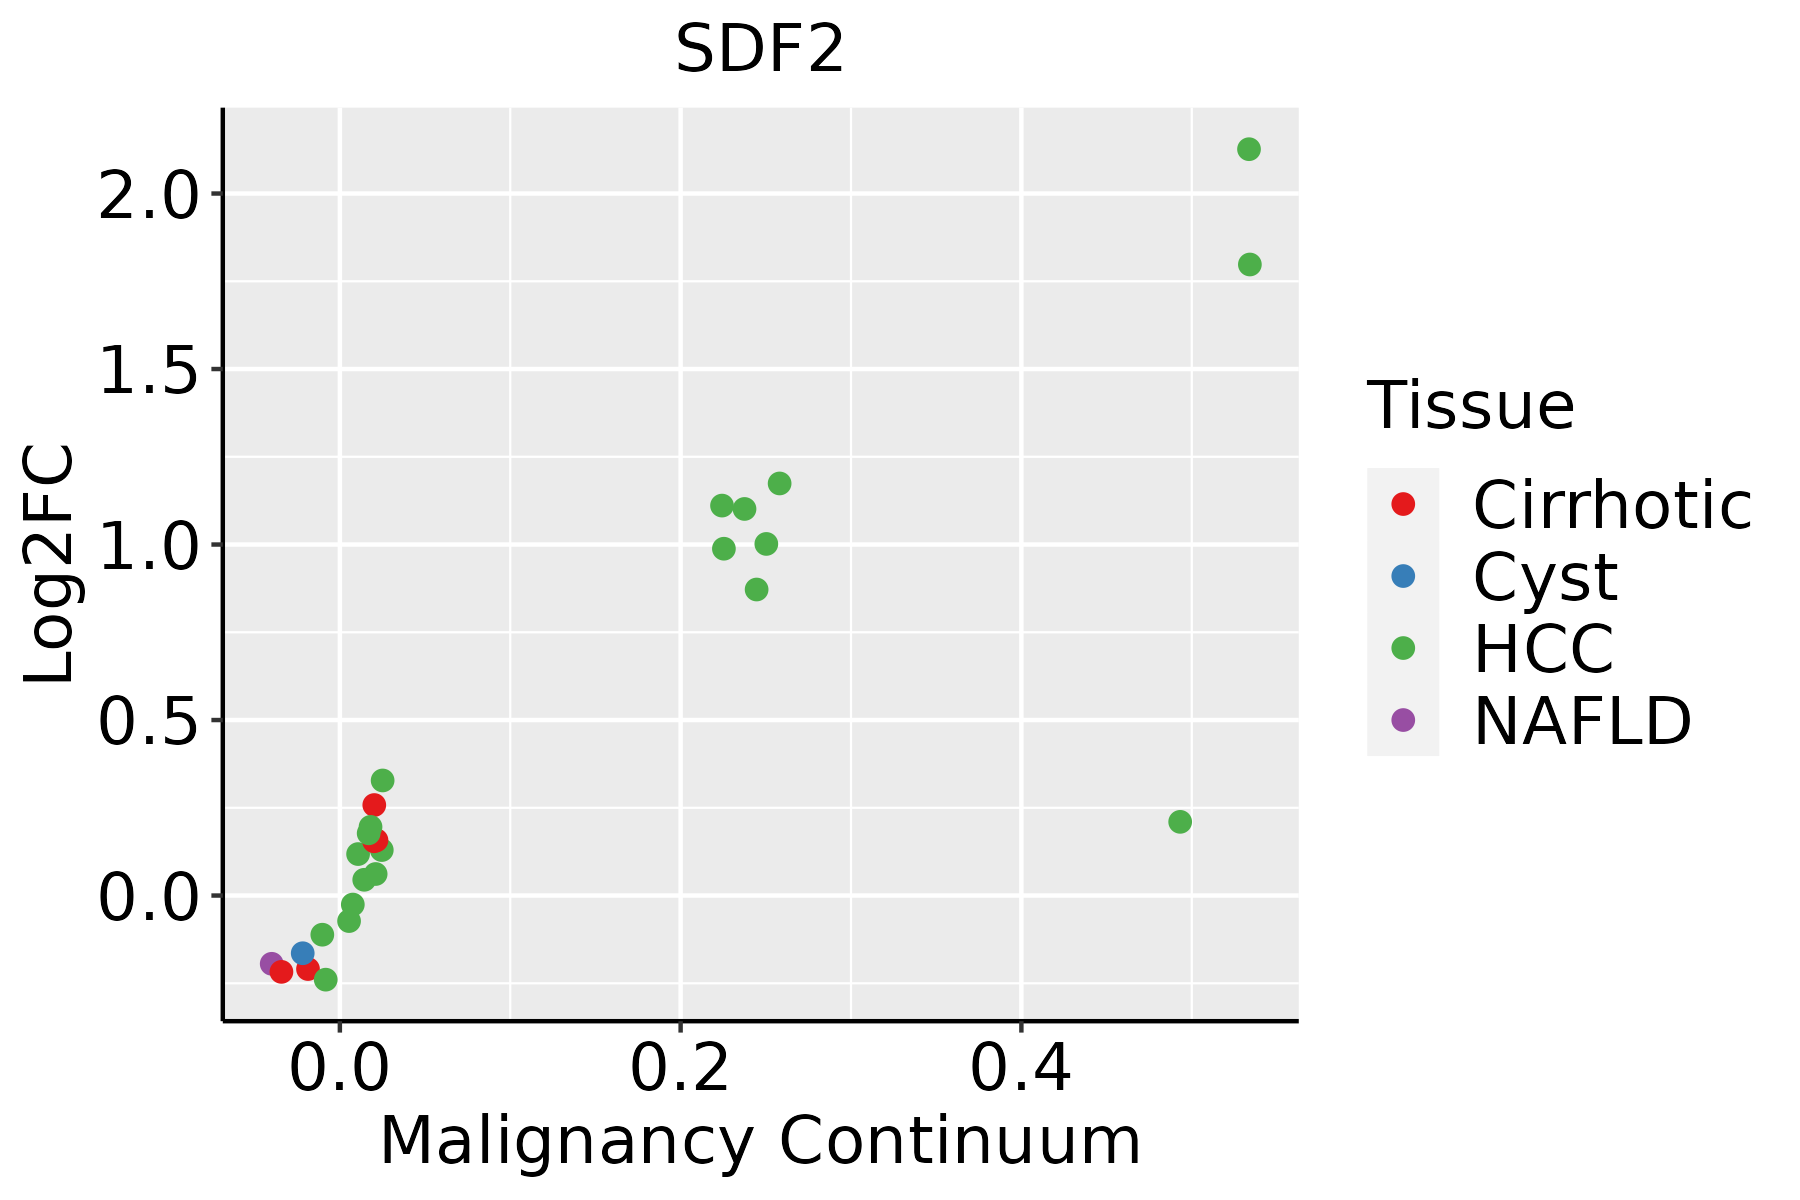 | HCC: Hepatocellular carcinoma |
| NAFLD: Non-alcoholic fatty liver disease | ||
| Oral Cavity |  | EOLP: Erosive Oral lichen planus |
| LP: leukoplakia | ||
| NEOLP: Non-erosive oral lichen planus | ||
| OSCC: Oral squamous cell carcinoma | ||
| Skin | 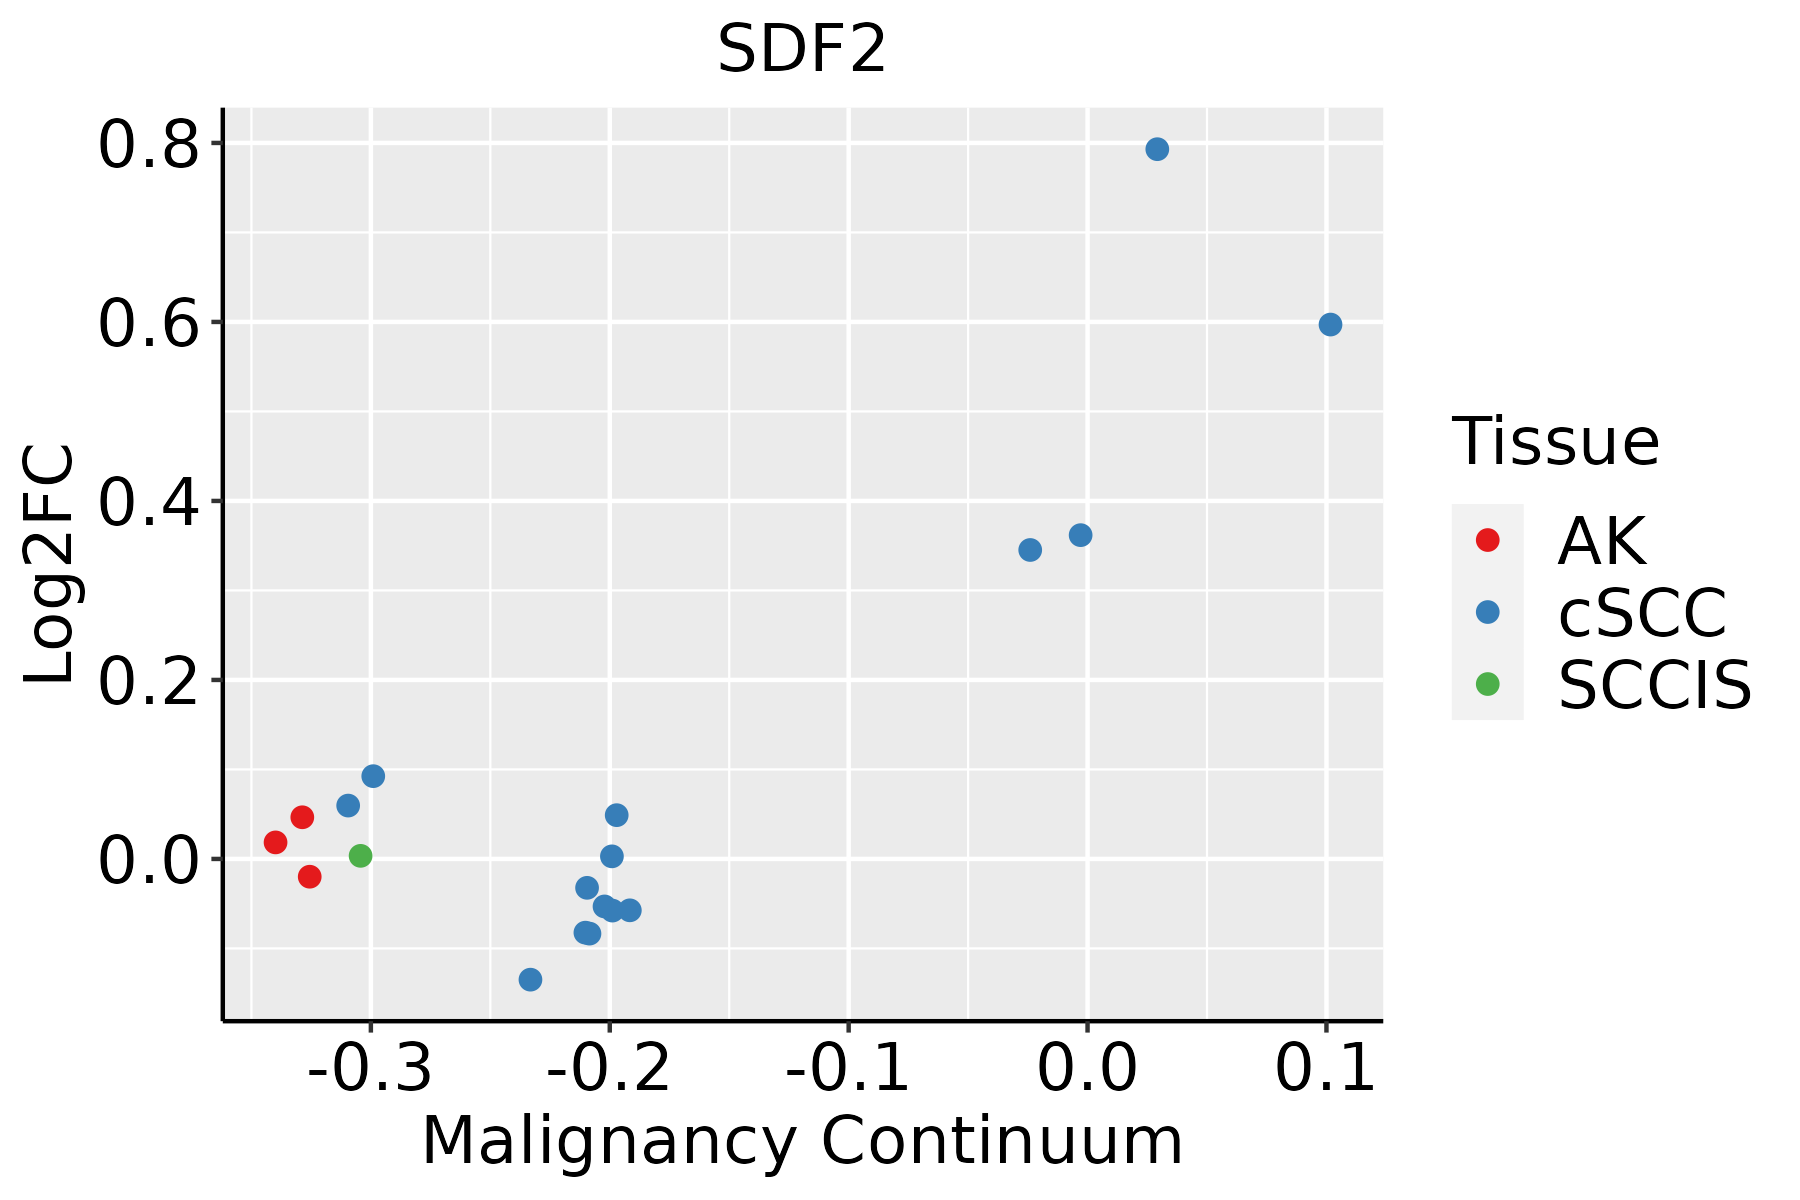 | AK: Actinic keratosis |
| cSCC: Cutaneous squamous cell carcinoma | ||
| SCCIS:squamous cell carcinoma in situ | ||
| Thyroid | 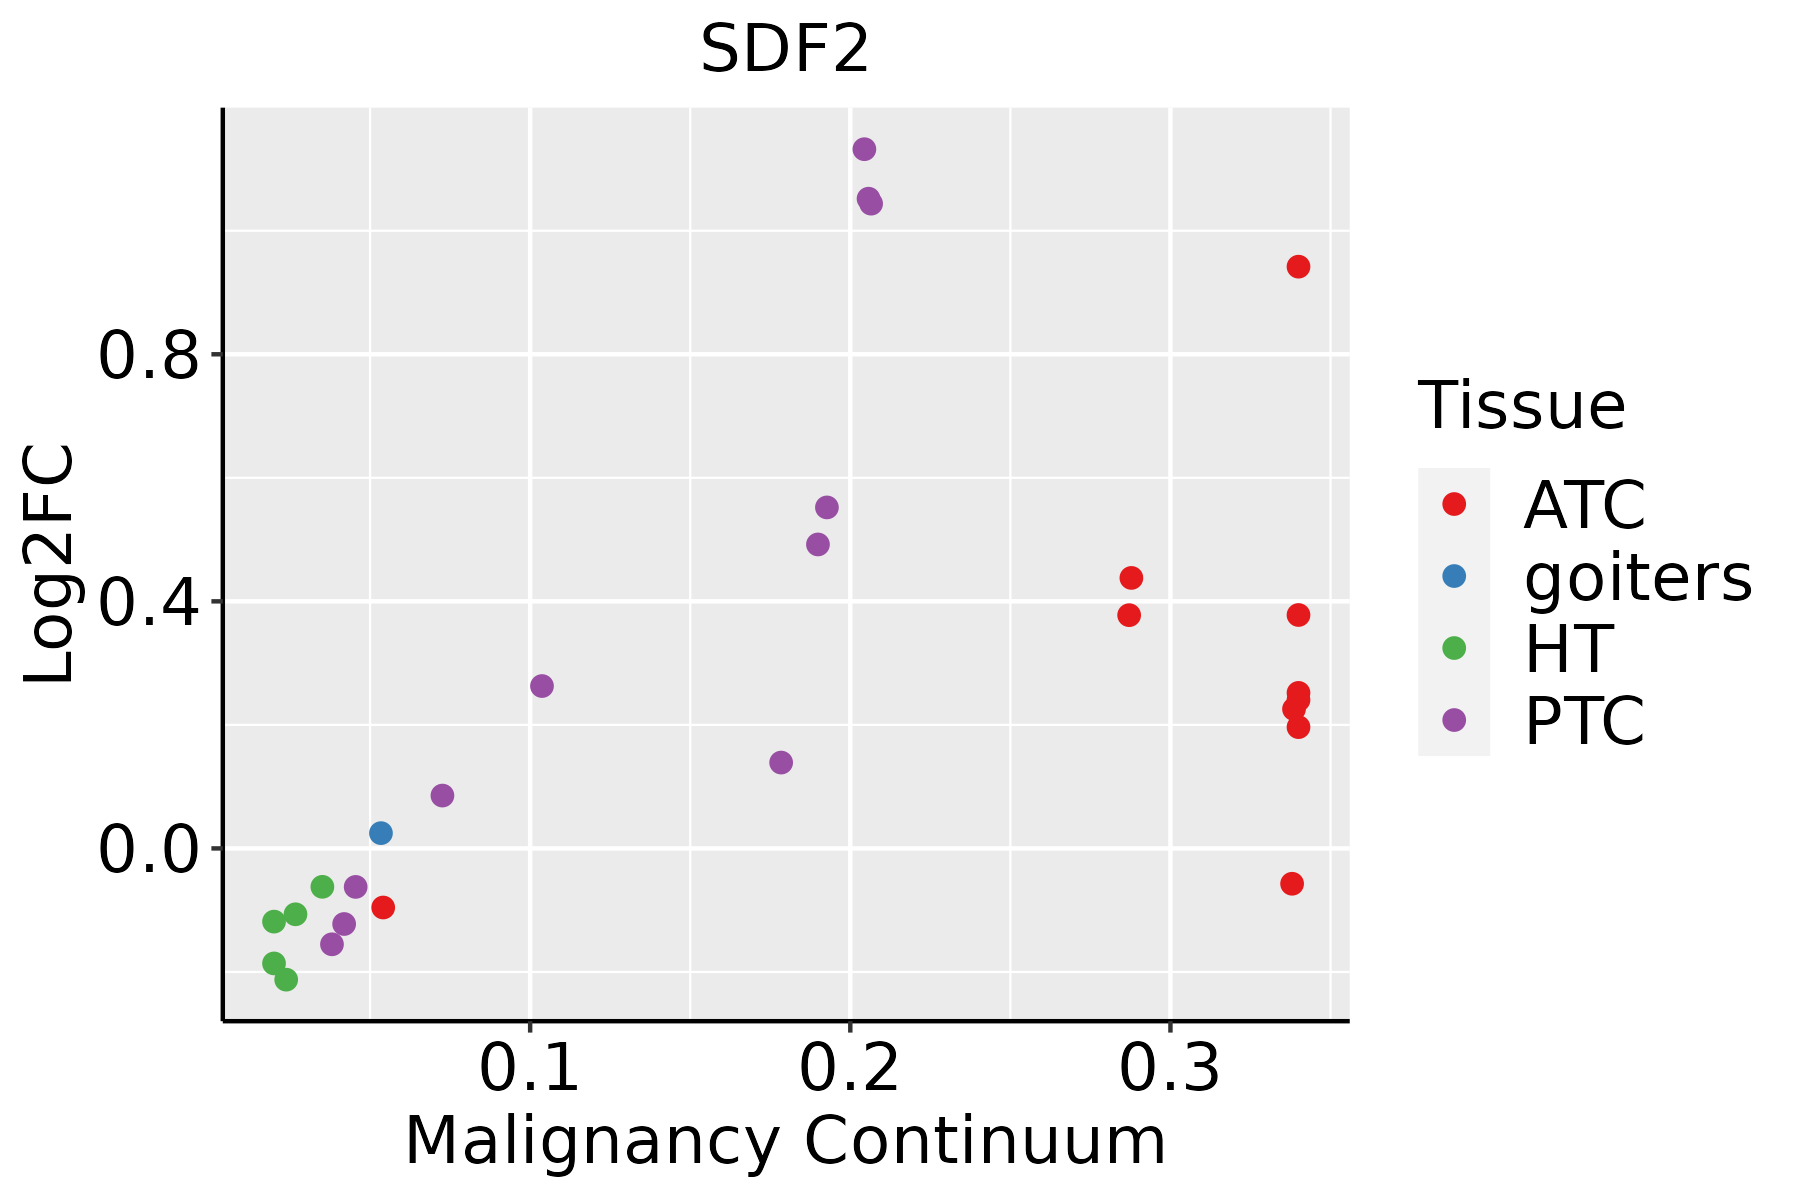 | ATC: Anaplastic thyroid cancer |
| HT: Hashimoto's thyroiditis | ||
| PTC: Papillary thyroid cancer |
| ∗log2FC in expression of this searched gene in stem-like cells from each diseased tissue sample relative to stem-like cells in normal samples in each tissue plotted against the malignancy continuum. Samples are colored based on if they are from different disease stage. |
Top |
Malignant transformation related pathway analysis |
| Find out the enriched GO biological processes and KEGG pathways involved in transition from healthy to precancer to cancer |
| Tissue | Disease Stage | Enriched GO biological Processes |
| Colorectum | AD |  |
| Colorectum | SER |  |
| Colorectum | MSS |  |
| Colorectum | MSI-H |  |
| Colorectum | FAP |  |
| ∗Top 15 enriched GO BP terms are showed in the bar plot of each disease state in each tissue. Each row represents a significant GO biological process which is colored according to the -log10(p.adjust). |
| Page: 1 2 3 4 5 6 7 8 9 |
| GO ID | Tissue | Disease Stage | Description | Gene Ratio | Bg Ratio | pvalue | p.adjust | Count |
| GO:00349761 | Colorectum | SER | response to endoplasmic reticulum stress | 74/2897 | 256/18723 | 3.01e-08 | 2.05e-06 | 74 |
| GO:00359661 | Colorectum | SER | response to topologically incorrect protein | 46/2897 | 159/18723 | 1.14e-05 | 3.63e-04 | 46 |
| GO:00359671 | Colorectum | SER | cellular response to topologically incorrect protein | 36/2897 | 116/18723 | 1.88e-05 | 5.51e-04 | 36 |
| GO:00064571 | Colorectum | SER | protein folding | 54/2897 | 212/18723 | 1.04e-04 | 2.18e-03 | 54 |
| GO:00065151 | Colorectum | SER | protein quality control for misfolded or incompletely synthesized proteins | 12/2897 | 28/18723 | 4.92e-04 | 7.02e-03 | 12 |
| GO:00717121 | Colorectum | SER | ER-associated misfolded protein catabolic process | 7/2897 | 12/18723 | 8.12e-04 | 1.01e-02 | 7 |
| GO:00610771 | Colorectum | SER | chaperone-mediated protein folding | 21/2897 | 67/18723 | 8.44e-04 | 1.04e-02 | 21 |
| GO:00064581 | Colorectum | SER | 'de novo' protein folding | 15/2897 | 43/18723 | 1.36e-03 | 1.51e-02 | 15 |
| GO:00365031 | Colorectum | SER | ERAD pathway | 28/2897 | 107/18723 | 2.92e-03 | 2.59e-02 | 28 |
| GO:00510851 | Colorectum | SER | chaperone cofactor-dependent protein refolding | 12/2897 | 34/18723 | 3.60e-03 | 3.03e-02 | 12 |
| GO:00510841 | Colorectum | SER | 'de novo' posttranslational protein folding | 13/2897 | 39/18723 | 4.39e-03 | 3.51e-02 | 13 |
| GO:0071218 | Colorectum | SER | cellular response to misfolded protein | 9/2897 | 23/18723 | 5.20e-03 | 3.95e-02 | 9 |
| GO:00104982 | Colorectum | MSS | proteasomal protein catabolic process | 157/3467 | 490/18723 | 2.39e-13 | 5.25e-11 | 157 |
| GO:00064572 | Colorectum | MSS | protein folding | 71/3467 | 212/18723 | 1.25e-07 | 5.91e-06 | 71 |
| GO:00349762 | Colorectum | MSS | response to endoplasmic reticulum stress | 81/3467 | 256/18723 | 2.65e-07 | 1.10e-05 | 81 |
| GO:00359672 | Colorectum | MSS | cellular response to topologically incorrect protein | 42/3467 | 116/18723 | 4.99e-06 | 1.38e-04 | 42 |
| GO:00359662 | Colorectum | MSS | response to topologically incorrect protein | 53/3467 | 159/18723 | 5.50e-06 | 1.49e-04 | 53 |
| GO:00064582 | Colorectum | MSS | 'de novo' protein folding | 20/3467 | 43/18723 | 2.50e-05 | 5.21e-04 | 20 |
| GO:00510842 | Colorectum | MSS | 'de novo' posttranslational protein folding | 18/3467 | 39/18723 | 7.19e-05 | 1.21e-03 | 18 |
| GO:00610772 | Colorectum | MSS | chaperone-mediated protein folding | 26/3467 | 67/18723 | 8.06e-05 | 1.33e-03 | 26 |
| Page: 1 2 3 4 5 6 7 8 9 10 11 12 13 |
| Pathway ID | Tissue | Disease Stage | Description | Gene Ratio | Bg Ratio | pvalue | p.adjust | qvalue | Count |
| Page: 1 |
Top |
Cell-cell communication analysis |
| Identification of potential cell-cell interactions between two cell types and their ligand-receptor pairs for different disease states |
| Ligand | Receptor | LRpair | Pathway | Tissue | Disease Stage |
| Page: 1 |
Top |
Single-cell gene regulatory network inference analysis |
| Find out the significant the regulons (TFs) and the target genes of each regulon across cell types for different disease states |
| TF | Cell Type | Tissue | Disease Stage | Target Gene | RSS | Regulon Activity |
| ∗The dot plots of a searched regulon are shown for all cell subpopulations in each disease state of each tissue based on the regulon specific score inferred using pySCENIC and by calculating the average expression. |
| Page: 1 |
Top |
Somatic mutation of malignant transformation related genes |
| Annotation of somatic variants for genes involved in malignant transformation |
| Hugo Symbol | Variant Class | Variant Classification | dbSNP RS | HGVSc | HGVSp | HGVSp Short | SWISSPROT | BIOTYPE | SIFT | PolyPhen | Tumor Sample Barcode | Tissue | Histology | Sex | Age | Stage | Therapy Types | Drugs | Outcome |
| SDF2 | SNV | Missense_Mutation | novel | c.450N>G | p.Phe150Leu | p.F150L | Q99470 | protein_coding | tolerated(0.73) | benign(0.051) | TCGA-DG-A2KK-01 | Cervix | cervical & endocervical cancer | Female | <65 | III/IV | Chemotherapy | cisplatin | SD |
| SDF2 | SNV | Missense_Mutation | novel | c.217N>T | p.Arg73Trp | p.R73W | Q99470 | protein_coding | deleterious(0) | probably_damaging(0.973) | TCGA-ZJ-AAXN-01 | Cervix | cervical & endocervical cancer | Female | <65 | I/II | Unknown | Unknown | SD |
| SDF2 | SNV | Missense_Mutation | novel | c.353T>C | p.Val118Ala | p.V118A | Q99470 | protein_coding | deleterious(0) | probably_damaging(0.995) | TCGA-AA-3877-01 | Colorectum | colon adenocarcinoma | Female | >=65 | I/II | Unknown | Unknown | SD |
| SDF2 | SNV | Missense_Mutation | rs758457609 | c.5C>T | p.Ala2Val | p.A2V | Q99470 | protein_coding | tolerated(0.35) | benign(0.007) | TCGA-CK-4951-01 | Colorectum | colon adenocarcinoma | Female | >=65 | I/II | Unknown | Unknown | PD |
| SDF2 | SNV | Missense_Mutation | c.4G>A | p.Ala2Thr | p.A2T | Q99470 | protein_coding | tolerated(0.59) | benign(0.057) | TCGA-CM-4746-01 | Colorectum | colon adenocarcinoma | Male | <65 | I/II | Unknown | Unknown | SD | |
| SDF2 | SNV | Missense_Mutation | novel | c.470N>C | p.Val157Ala | p.V157A | Q99470 | protein_coding | tolerated(0.48) | benign(0.015) | TCGA-G4-6302-01 | Colorectum | colon adenocarcinoma | Female | >=65 | I/II | Unknown | Unknown | SD |
| SDF2 | SNV | Missense_Mutation | novel | c.11N>C | p.Val4Ala | p.V4A | Q99470 | protein_coding | tolerated(0.12) | benign(0) | TCGA-WS-AB45-01 | Colorectum | colon adenocarcinoma | Female | <65 | I/II | Unknown | Unknown | SD |
| SDF2 | SNV | Missense_Mutation | c.358N>A | p.Ala120Thr | p.A120T | Q99470 | protein_coding | deleterious(0) | probably_damaging(0.996) | TCGA-A5-A0G2-01 | Endometrium | uterine corpus endometrioid carcinoma | Female | <65 | III/IV | Unknown | Unknown | SD | |
| SDF2 | SNV | Missense_Mutation | novel | c.289N>A | p.Val97Ile | p.V97I | Q99470 | protein_coding | tolerated(0.29) | benign(0.02) | TCGA-AP-A1DR-01 | Endometrium | uterine corpus endometrioid carcinoma | Female | <65 | III/IV | Chemotherapy | cisplatin | SD |
| SDF2 | SNV | Missense_Mutation | rs766623300 | c.530N>G | p.His177Arg | p.H177R | Q99470 | protein_coding | deleterious(0.04) | possibly_damaging(0.895) | TCGA-AX-A06D-01 | Endometrium | uterine corpus endometrioid carcinoma | Female | >=65 | III/IV | Chemotherapy | carboplatin | PD |
| Page: 1 2 3 |
Top |
Related drugs of malignant transformation related genes |
| Identification of chemicals and drugs interact with genes involved in malignant transfromation |
| (DGIdb 4.0) |
| Entrez ID | Symbol | Category | Interaction Types | Drug Claim Name | Drug Name | PMIDs |
| Page: 1 |

Copyright 2023-Present -The University of Texas Health Science Center at Houston |